. 2018 Jul 24;115(30):E7043-E7052.
doi: 10.1073/pnas.1803130115. Epub 2018 Jul 9.

Hsp70-Bag3 complex is a hub for proteotoxicity-induced signaling that controls protein aggregation

Affiliations

Hsp70-Bag3 complex is a hub for proteotoxicity-induced signaling that controls protein aggregation

Anatoli B Meriin et al. Proc Natl Acad Sci U S A. .

Abstract

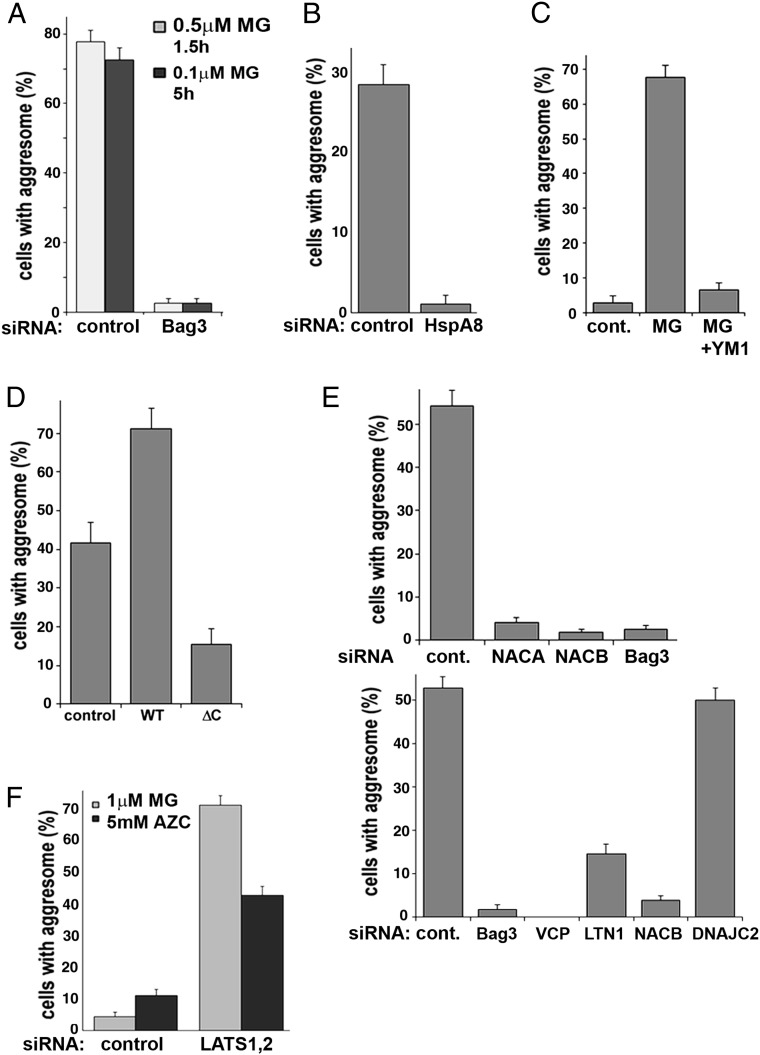
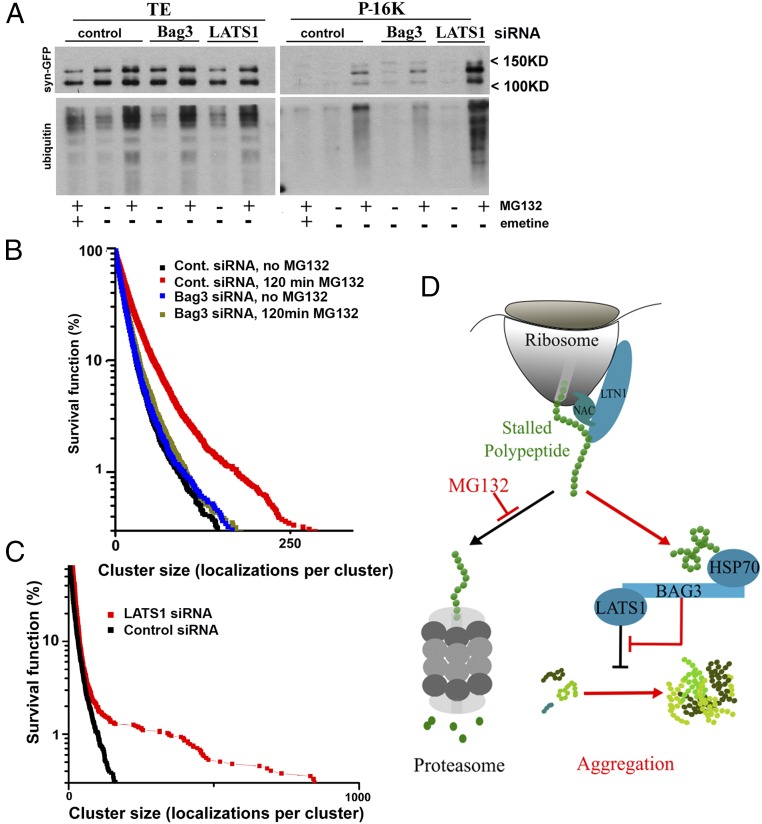
Protein abnormalities in cells are the cause of major pathologies, and a number of adaptive responses have evolved to relieve the toxicity of misfolded polypeptides. To trigger these responses, cells must detect the buildup of aberrant proteins which often associate with proteasome failure, but the sensing mechanism is poorly understood. Here we demonstrate that this mechanism involves the heat shock protein 70-Bcl-2-associated athanogene 3 (Hsp70-Bag3) complex, which upon proteasome suppression responds to the accumulation of defective ribosomal products, preferentially recognizing the stalled polypeptides. Components of the ribosome quality control system LTN1 and VCP and the ribosome-associated chaperone NAC are necessary for the interaction of these species with the Hsp70-Bag3 complex. This complex regulates important signaling pathways, including the Hippo pathway effectors LATS1/2 and the p38 and JNK stress kinases. Furthermore, under proteotoxic stress Hsp70-Bag3-LATS1/2 signaling regulates protein aggregation. We established that the regulated step was the emergence and growth of abnormal protein oligomers containing only a few molecules, indicating that aggregation is regulated at very early stages. The Hsp70-Bag3 complex therefore functions as an important signaling node that senses proteotoxicity and triggers multiple pathways that control cell physiology, including activation of protein aggregation.

Keywords: DRiPs; Hippo pathway; aggresome; proteasome inhibition; stress kinases.


Conflict of interest statement

Conflict of interest statement: I.A. is cofounder of ActivSignal. The authors declare no other conflicts of interest.

Figures

Fig. 1.
Fig. 1.
The HB complex mediates LATS1/2 suppression in response to proteasome inhibition. The antibodies for immunoblots are indicated on the right. (A) Bag3 depletion reverses the effects of proteasome inhibition on JNK and p38 activity. Control MCF10A cells and MCF10A cells depleted of Bag3 were treated with MG132 under the indicated conditions. Here and throughout the figures, the results of immunoblotting of total cellular lysates were independently reproduced at least three times. (B) The effects of the deletion of various functional domains in Bag3 on its association with LATS1. HeLa cells were transfected with plasmids encoding His-tagged full-length Bag3, with Bag3 deletion mutants, or with empty plasmid (vector, V). Here and throughout this work HeLa cells were utilized because, unlike MCF10A cells, they could be efficiently transfected with a plasmid DNA. On the next day the cells were treated for 75 min with 5 μM MG132 or were left untreated. Then the cells were incubated for 10 min with 1.2% formaldehyde, and His-tagged constructs were isolated using cobalt affinity resin. To calculate relative amounts of LATS1 associated with each His-tagged construct, the quantified LATS1 signal in each lane was normalized by a FLAG signal representing the amount of pulled-down Bag3 in the same sample. No detectable signal was seen in the isolate from the cells transfected with empty vector (V). The results of this pull-down are typical of three independent experiments. ΔC, mutant with a deleted C terminus containing the Bag domain critical for interaction with Hsp70; ΔM, mutant with a deleted M-domain; ΔP, mutant with a deleted PxxP motif; ΔWW, mutant with a deleted WW domain; WT, full-length Bag3. (C) Proteasome inhibition leads to the suppression of LATS1/2 activity as monitored by phosphorylation of YAP. MCF10A cells were incubated for 3.5 h with the indicated concentrations of MG132. (D) Bag3 depletion reduces the effects of proteasome inhibition on LATS1/2 activity. Control MCF10A cells and cells depleted of Bag3 were treated with MG132 under the indicated conditions. Quantification (expressed in relative units) of the phospho-YAP signal normalized by total YAP in the same samples is shown for each of the series. (E) Hsp70 depletion blocks the effects of proteasome inhibition on LATS1/2 activity. MCF10A cells were infected with HSF1 shRNA, briefly selected, and 3 d after the infection were transfected with either HspA8 or control siRNA. Two days later the cells were treated with MG132. Quantification (expressed in relative units) of the phospho-YAP signal normalized by total YAP in the same samples is shown for each of the series. (F) The Bag domain of Bag3 is critical for the regulation of LATS1/2 by proteasome inhibition. MCF10A cells were infected with retroviruses encoding full-length Bag3 (WT) or its ΔC-truncated form (both with mutations making them resistant to the Bag3 siRNA used in this experiment) or with an empty vector. After selection, the cells were transfected with either Bag3 (Lower), or control (Upper) siRNA and 2 d later were treated for 3.5 h with 0.6 μM MG132. Quantification (expressed in relative units) of the phospho-YAP signal normalized by total YAP signal in the same samples is shown for each of the series. Results of an analogous experiment are shown in SI Appendix, Fig. S1G.
Fig. 2.
Fig. 2.
DRiPs interact with the HB complex to activate the response to proteasome failure. (A) Incubation with the proline analog AZC enhances the effects of proteasome inhibition. MCF10A cells were left untreated or were incubated for 3 h with the indicated concentrations of MG132 alone or combined with 2.5 mM AZC. YM1, an inhibitor of the HB complex, reverses the effects of proteasome inhibition on LATS1/2 activity. Cells were preincubated with YM1 for 3 h and were incubated with 5 μM MG132 combined with 5 μM YM1. (B) Slowing down translation lessens the effects of proteasome inhibition on the suppression of LATS1/2. MCF10A cells were left untreated or were incubated for 3 h with 1 μM MG132 alone or combined with 0.15 μM emetine. Results of an analogous experiment with the addition of cycloheximide are shown in SI Appendix, Fig. S2A. (C) The effects of proteasome inhibition, inhibition of translation, and disruption of the HB complex on the association of Hsp70 and LATS1 with ubiquitinated species. MCF10A cells were incubated for 2 h with the indicated combinations of 2.5 μM MG132, 0.5 μM emetine, or 10 μM YM1. All cells incubated with YM1 were preincubated for 1.5 h. After the treatments, cells were incubated for 10 min with 1.2% formaldehyde to cross-link protein complexes. Ubiquitinated species were isolated from the cell lysates and analyzed by immunoblotting. To measure Hsp70, we used a mixture of antibodies against HspA1 and HspA8. Typical results of two independent experiments are shown.
Fig. 3.
Fig. 3.
Stalled proteins interact with and regulate the HB complex. (A) Effects of depletion of LTN1, NACA, or DNAJC2 (ZUO1) on the suppression of LATS1/2 upon proteasome inhibition. MCF10A cells with the indicated depletions were incubated for the indicated times with 3 μM MG132, and the lysates were analyzed by immunoblot. (B) Effects of proteasome inhibition and depletion of LTN1 or NACA on levels of GFP-NS. One day after siRNA transfection, HeLa cells were transfected with plasmids encoding either GFP-NS or WT EGFP (this plasmid was 10-fold diluted with an empty vector). Indicated samples were treated for 4 h with 5 μM MG132. (C) The effects of LTN1 or NACA depletion on the association of GFP-NS with the HB complex were assessed by the Duolink assay. HeLa cells transfected for 1 d with one of the indicated siRNAs were transfected with a mixture of plasmids encoding GFP-NS and FLAG-Bag3 (3:1) and 1 d later were treated with MG132 or were left untreated. The cells transfected with only the GFP-NS–encoding plasmid or only the FLAG-Bag3–encoding plasmid were used as negative controls and did not produce any measurable signal. The cells grown on a glass-bottomed plate were treated according to the Duolink protocol with anti-GFP and anti-FLAG antibodies. Images of the Duolink signal and of DAPI nuclear staining were taken from at least 10 randomly chosen images with a fluorescence microscope with a 20× objective. Duolink images were quantified using NIH ImageJ software, and the data were normalized by the total number of cells in all fields chosen for each sample. The error bars represent the SD. For images of cells, see SI Appendix, Fig. S3. (D) Effects of LTN1 or NACA depletion on the association of GFP-NS with the HB complex assessed by the modified ActivSignal protocol. The cells were grown and treated as in Fig. 3B, but here the cells were plated on a plastic 96-well plate for incubation with MG132 and for a following protein–protein interaction assay (Materials and Methods). The qPCR results are presented. The results for a signal produced with the pair of anti-GFP and anti-FLAG antibodies (reflecting the amount of GFP-NS associated with FLAG-Bag3) were normalized by a signal produced with the pair of anti-Bag3 and anti-FLAG antibodies (reflecting the relative amount of FLAG-Bag3) for the same cells. The signals generated from the cells transfected only with a vector were used as a baseline. The error bars represent the SD. For the effect of LTN1 depletion (compared with control), P < 10−6; for NACA, P < 10−5.
Fig. 4.
Fig. 4.
The HB complex and its partners control aggresome formation. In all experiments cells were fixed with formaldehyde, and the fraction of cells with an aggresome was counted under a fluorescence microscope; in all experiments less than 5% of naive cells formed an aggresome. Error bars on the graphs depicting aggresome formation represent SEs. (A) Bag3 depletion suppresses aggresome formation. MCF10A cells stably expressing Syn-GFP with the indicated depletions were treated with MG132 under the indicated conditions. (B) Hsp70 depletion suppresses aggresome formation. MCF10A cells stably expressing Syn-GFP were infected with HSF1 shRNA and were briefly selected and transfected with either HspA8 or control siRNA. Two days later the cells were treated for 3.5 h with 45 nM MG132. (C) Blocking the Hsp70–Bag3 interaction by the small molecule YM1 suppresses aggresome formation. MCF10A cells stably expressing Syn-GFP were treated for 4.5 h with 100 nM MG132 with or without the addition of 5 μM YM1 or were left untreated. YM1 was added 1.5 h before the addition of MG132. (D) The effects of Bag3 on the aggresome require an intact Bag domain. HeLa cells stably expressing Syn-GFP and transfected with plasmids encoding full-length Bag3 (WT), with its ΔC deletion mutant (ΔC), or with empty vector were treated for 5 h with 2 μM MG132. The fraction of cells with an aggresome was counted only among the transfected cells. (E) The effects of ribosome-associated factors involved in handling DRiPs on aggresome formation. MCF10A cells stably expressing Syn-GFP with the indicated depletions were treated with 90 nM MG132 for 3 h (Upper) or with 50 nM MG132 for 5 h (Lower). (F) Depletion of LATS1 stimulates aggresome formation in response to proteasome inhibition. MCF10A cells stably expressing Syn-GFP depleted of LATS1 were treated with 30 nM MG132 for 2.5 h.
Fig. 5.
Fig. 5.
Bag3 and LATS1 regulate protein aggregation in response to proteasome inhibition. (A) Depletion of Bag3 reduces and depletion of LATS1 increases the association of Syn-GFP and ubiquitinated species with the particulate fraction. MCF10A cells stably expressing Syn-GFP with the indicated depletions were treated for 2 h with 2.5 μM MG132 with or without 0.5 μM emetine. The preclarified lysates were subjected to 15-min centrifugation at 16,000 × g. The pellets were washed once with a lysis buffer and then were dissolved in Laemmli sample buffer for immunoblotting with the antibodies indicated on the left. Note that both bands developed with anti-GFP antibody are specific. (B) The effects of incubation with 1 μM MG132 on the distribution of cluster sizes in naive and Bag3-depleted cells. Survival plots delineate a fraction of clusters containing at least N (indicated on the x axis) localization counts. Each plot was generated from 10 cells and represents the statistical distribution of 9,000–10,000 identified aggregates. (C) Survival plot showing the effects of LATS1 depletion on the distribution of cluster sizes in naive cells. Each plot was generated from 10 cells and represents the statistical distribution of 4,000 (LATS1) or 7,000 (control) identified aggregates. (D) A model for DRiPs sensing by the HB complex. Blue indicates elements of the pathway regulating the aggregation response. Red indicates changes upon proteasome inhibition; under these conditions the HB complex suppresses LATS1/2, thus removing its inhibition of protein aggregation.

References

    1. Sherman MY, Goldberg AL. Cellular defenses against unfolded proteins: A cell biologist thinks about neurodegenerative diseases. Neuron. 2001;29:15–32. - PubMed
    1. Meriin AB, Gabai VL, Yaglom J, Shifrin VI, Sherman MY. Proteasome inhibitors activate stress kinases and induce Hsp72. Diverse effects on apoptosis. J Biol Chem. 1998;273:6373–6379. - PubMed
    1. Lee DH, Goldberg AL. Proteasome inhibitors cause induction of heat shock proteins and trehalose, which together confer thermotolerance in Saccharomyces cerevisiae. Mol Cell Biol. 1998;18:30–38. - PMC - PubMed
    1. Bush KT, Goldberg AL, Nigam SK. Proteasome inhibition leads to a heat-shock response, induction of endoplasmic reticulum chaperones, and thermotolerance. J Biol Chem. 1997;272:9086–9092. - PubMed
    1. Taguchi K, Motohashi H, Yamamoto M. Molecular mechanisms of the Keap1-Nrf2 pathway in stress response and cancer evolution. Genes Cells. 2011;16:123–140. - PubMed

Publication types

MeSH terms

Substances