. 2018 Jul 24;115(30):E7091-E7100.
doi: 10.1073/pnas.1721443115. Epub 2018 Jul 9.

Scleral hypoxia is a target for myopia control

Affiliations

Scleral hypoxia is a target for myopia control

Hao Wu et al. Proc Natl Acad Sci U S A. .

Abstract

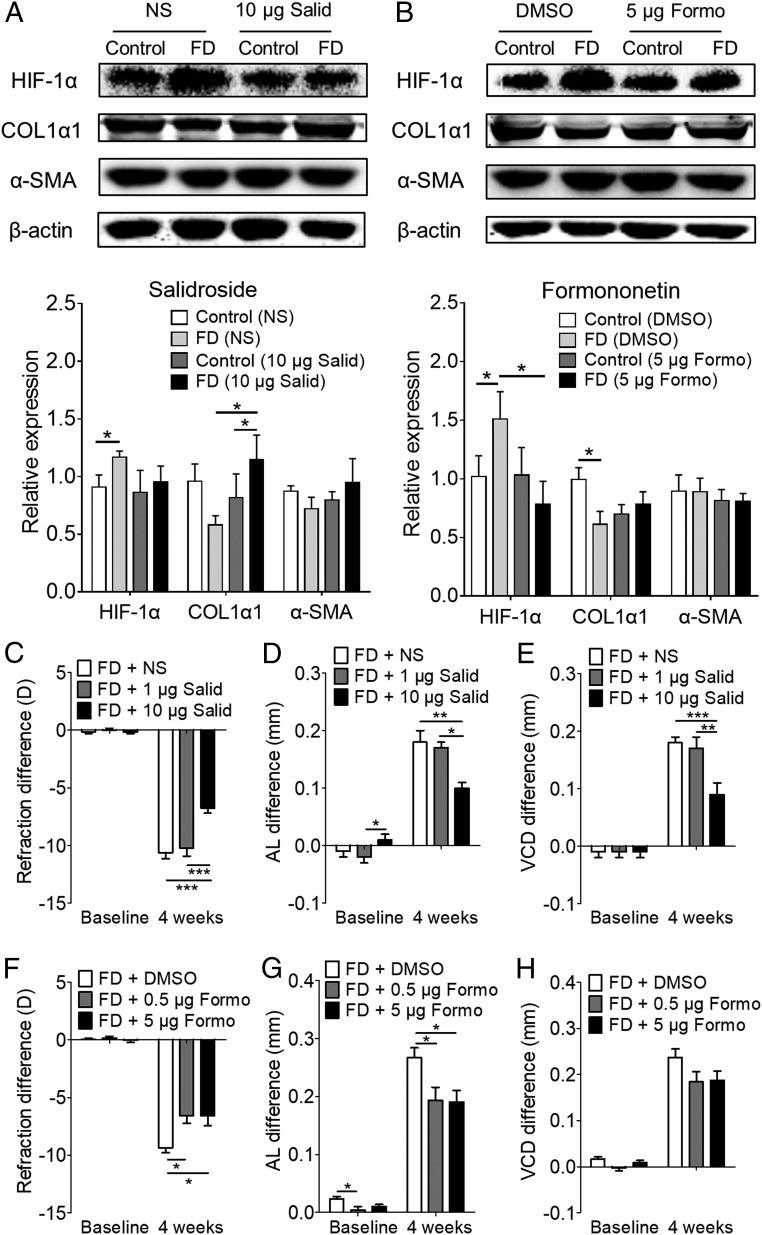
Worldwide, myopia is the leading cause of visual impairment. It results from inappropriate extension of the ocular axis and concomitant declines in scleral strength and thickness caused by extracellular matrix (ECM) remodeling. However, the identities of the initiators and signaling pathways that induce scleral ECM remodeling in myopia are unknown. Here, we used single-cell RNA-sequencing to identify pathways activated in the sclera during myopia development. We found that the hypoxia-signaling, the eIF2-signaling, and mTOR-signaling pathways were activated in murine myopic sclera. Consistent with the role of hypoxic pathways in mouse model of myopia, nearly one third of human myopia risk genes from the genome-wide association study and linkage analyses interact with genes in the hypoxia-inducible factor-1α (HIF-1α)-signaling pathway. Furthermore, experimental myopia selectively induced HIF-1α up-regulation in the myopic sclera of both mice and guinea pigs. Additionally, hypoxia exposure (5% O2) promoted myofibroblast transdifferentiation with down-regulation of type I collagen in human scleral fibroblasts. Importantly, the antihypoxia drugs salidroside and formononetin down-regulated HIF-1α expression as well as the phosphorylation levels of eIF2α and mTOR, slowing experimental myopia progression without affecting normal ocular growth in guinea pigs. Furthermore, eIF2α phosphorylation inhibition suppressed experimental myopia, whereas mTOR phosphorylation induced myopia in normal mice. Collectively, these findings defined an essential role of hypoxia in scleral ECM remodeling and myopia development, suggesting a therapeutic approach to control myopia by ameliorating hypoxia.

Keywords: HIF-1α; myopia; scRNA-seq; scleral ECM remodeling; scleral hypoxia.


Conflict of interest statement

The authors declare no conflict of interest.

Figures

Fig. 1.
Fig. 1.
Identification of two scleral fibroblast subpopulations by single-cell transcriptomic analysis. (A) Cell-type identification was based on log-transformed TPM values. Markers used for identifying cell types included collagen subtypes (Col1a1 and Col1a2), a fibroblast marker (Vim), fibroblast transdifferentiation markers (Ddr2, Fap, Postn, Acta2, and S100a4), a leukocyte marker (Ptprc), and a myocyte marker (Des). (B) The expected CV2 values of highly variable genes (pink dots) were less than the observed values. The red continuous curve represents the average expression levels. (C) Unsupervised hierarchical cluster analysis of 71 scleral fibroblasts based on the log-transformed TPM values of 4,463 genes with high CV2 values. The x axis contains the genes with large CV2 values, and the y axis indicates single scleral cells. Pink indicates FD eyes, and blue indicates control eyes. (D) Composition of A1 and A2 fibroblast subpopulations in FD and control eyes. The A2 subpopulation constituted 85.7% of the fibroblasts in the FD eyes vs. 58.3% in the control eyes (P = 0.021, χ2 test).
Fig. 2.
Fig. 2.
Pathways and transcription factors underlying gene-expression changes during the transition of A1 to A2. (A) Pathways with enrichment P < 0.01 and absolute activation Z-score >2 are shown. Almost all pathways were significantly activated in the A2 population except for PPAR/RXRα, which was inhibited. (B) Hierarchical cluster analysis of the A2 population. The x axis indicates the genes with large CV2 values, and the y axis indicates the single scleral cells in the A2 population. The A2 population contained four subpopulations [the color gradient from yellow to red indicates the cosine distance (CD) to the A1 cell type, with those in yellow color being the closest to A1 cells and the red-colored ones being the farthest away]. Light to dark orange subpopulations represent intermediate cells. (C) Expression dynamics of Hif1a among different populations and subpopulations. The x axis is ranked by CD to A1, with the nearest subpopulation on the left (A2_1) and the farthest subpopulation on the right (A2_4). The A2_2 and A2_3 subpopulations are interspersed between them. Data are expressed as medians (interquartile ranges); *P < 0.05, Wilcoxon-rank test. (D) Relationship between human pathologic myopia-risk genes (red ovals) and genes in the HIF-1α–signaling pathway (blue ovals) according to the PPI network. The risk gene for pathologic myopia with the most interactions was GATA4, which is an important transcription activator involved in the developmental process. SNPs in this gene were reported to be associated with myopia in a French population (27).
Fig. 3.
Fig. 3.
Dynamic changes in the HIF-1α protein level during myopia development in mice. Western blot analysis of scleral (A and B) and retinal (C and D) HIF-1α expression in mice in response to FD for 2 d and 2 wk. Only right eyes from age-matched normal animals are shown. The bar graphs represent relative levels of HIF-1α from experiments (n = 3–6). Data are expressed as mean ± SEM. *P < 0.05; **P < 0.01; Student’s t test.
Fig. 4.
Fig. 4.
Dynamic changes in HIF-1α protein level during myopia development in guinea pigs. (AD) Western blot analysis of scleral HIF-1α expression in guinea pigs in response to FD (A and B) or LI (C and D) for 2 d or 1 wk and 2 d after recovery (Rec) from 1 wk of myopia induction. (EH) Corresponding retinal HIF-1α expression levels in response to FD (E and F) or LI (G and H) at these time points. Only right eyes from age-matched normal animals are shown. Bar graphs represent HIF-1α levels from experiments (n = 3–4). Data are expressed as mean ± SEM. *P < 0.05; ***P < 0.001; Student’s t test.
Fig. 5.
Fig. 5.
Myofibroblast transdifferentiation in response to hypoxia in vitro. (A) HSFs exposed to 5% O2 were analyzed by Western blot for the protein expression of HIF-1A, vinculin, paxillin, α-SMA, and COL1A1. (BE) Bar graphs represent vinculin (B), paxillin (C), α-SMA (D), and COL1A1 (E) levels, respectively (n = 4). Data are expressed as mean ± SEM. *P < 0.05; **P < 0.01. Treatment duration: 2, 4, 7, or 10 h vs. control (0 h); Student’s t test.
Fig. 6.
Fig. 6.
Effect of antihypoxic drugs on myopia in guinea pigs with FD for 4 wk. (A and B) Protein levels of scleral HIF-1α, COL1α1, and α-SMA were detected by Western blot after periocular injection in FD eyes of salidroside(Salid) (10 μg per eye) (A) or formononetin (Formo) (5 μg per eye) (B) for 4 wk. Bar graphs represent HIF-1α, COL1α1, and α-SMA levels from experiments (n = 4–6). Data are expressed as mean ± SEM. *P < 0.05; Student’s t test. (CH) Interocular differences (injected eye minus fellow untreated eye) in refraction (C and F), axial length (D and G), and vitreous chamber depth (E and H) in FD guinea pigs before and after 4 wk of treatment with normal saline (vehicle control, n = 13), salidroside,1 μg per eye (n = 10) or 10 μg per eye (n = 16) (CE) or with 0.1% dimethyl sulfoxide (vehicle control, n = 18) or formononetin, 0.5 μg per eye (n = 19) or 5 μg per eye (n = 17) In FH, data are expressed as mean ± SEM. *P < 0.05; **P < 0.01; ***P < 0.001; two-way repeated-measures ANOVA with Bonferroni multiple comparison. AL, axial length; D, diopter; DMSO, dimethyl sulfoxide; NS, normal saline; VCD, vitreous chamber depth.
Fig. 7.
Fig. 7.
Paradigm for myofibroblast transdifferentiation involved in the pathogenesis of myopia. (A) The choroidal layer thins rapidly followed by scleral thinning that results from ECM remodeling during myopic visual stimulus. (B) These myopia-related visual signals decrease choroidal blood flow that leads to an insufficient supply of oxygen and nutrients to the avascular sclera. Scleral fibroblasts first sense and quickly respond to the altered extracellular microenvironment through the accumulation of HIF-1α and enhanced phosphorylation levels of eIF2α and mTOR. This induces a phenotypic shift of fibroblast-like cells toward myofibroblast-like cells as well as a decrease in collagen production. As a result, the sclera becomes thinner and weaker. Consequently, axial length increases, and myopia ensues.

References

    1. Wojciechowski R. Nature and nurture: The complex genetics of myopia and refractive error. Clin Genet. 2011;79:301–320. - PMC - PubMed
    1. Dolgin E. The myopia boom. Nature. 2015;519:276–278. - PubMed
    1. Holden BA, et al. Global prevalence of myopia and high myopia and temporal trends from 2000 through 2050. Ophthalmology. 2016;123:1036–1042. - PubMed
    1. Flitcroft DI. The complex interactions of retinal, optical and environmental factors in myopia aetiology. Prog Retin Eye Res. 2012;31:622–660. - PubMed
    1. Leo SW. Scientific Bureau of World Society of Paediatric Ophthalmology and Strabismus (WSPOS) Current approaches to myopia control. Curr Opin Ophthalmol. 2017;28:267–275. - PubMed

Publication types

MeSH terms

Substances