. 2018 Jul 9;9(7):756.
doi: 10.1038/s41419-018-0802-8.

α-ketoglutarate dehydrogenase inhibition counteracts breast cancer-associated lung metastasis

Affiliations

α-ketoglutarate dehydrogenase inhibition counteracts breast cancer-associated lung metastasis

Sandra Atlante et al. Cell Death Dis. .

Abstract

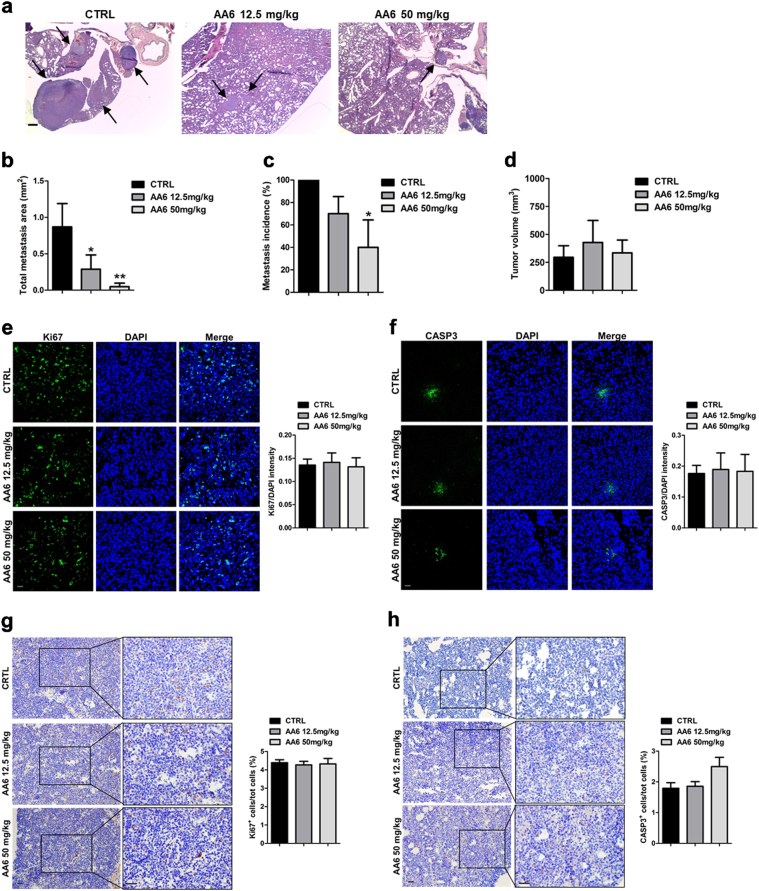
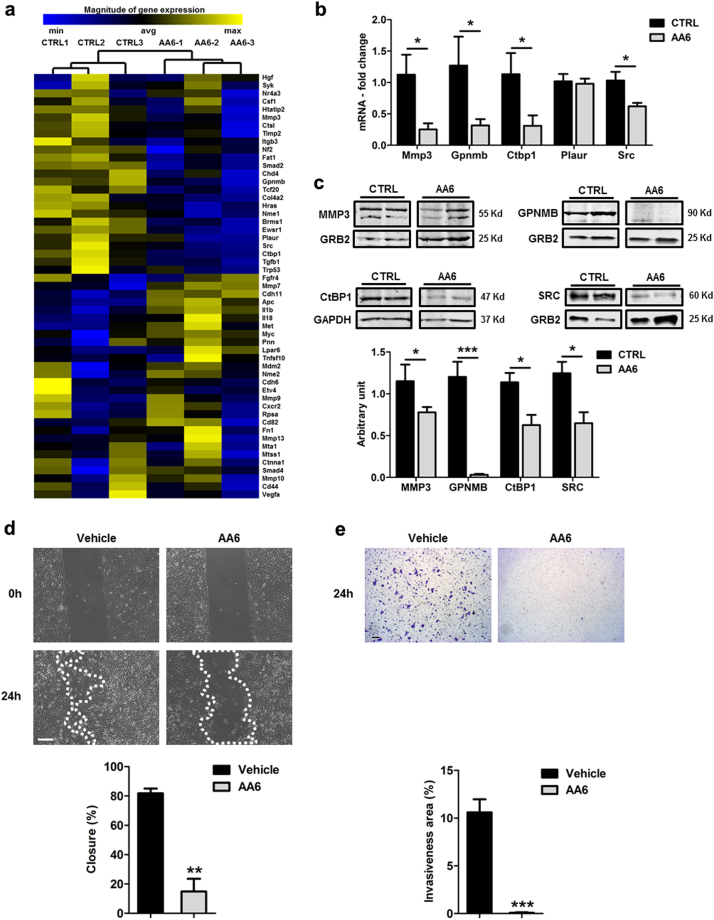
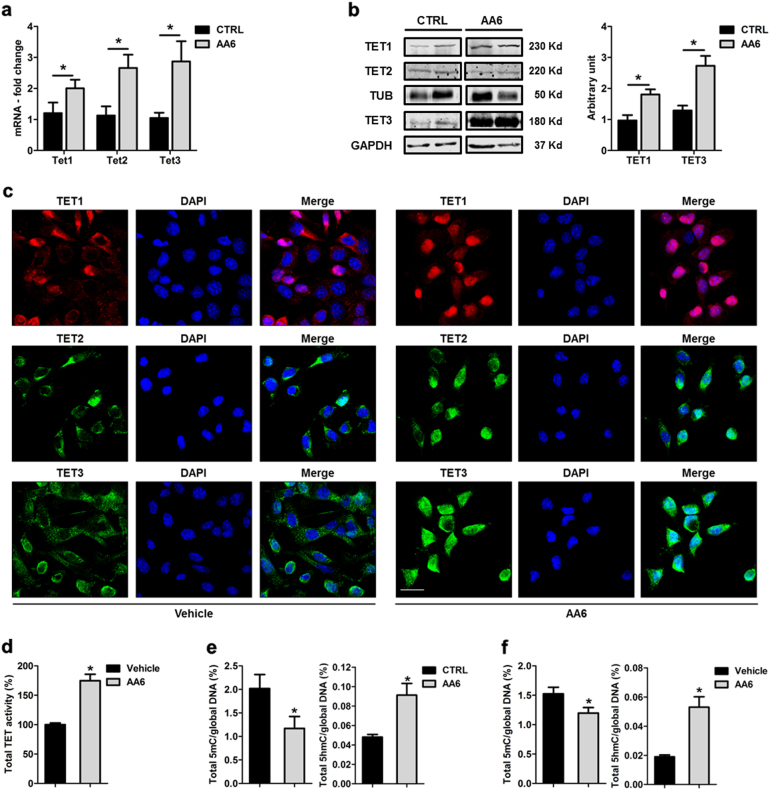
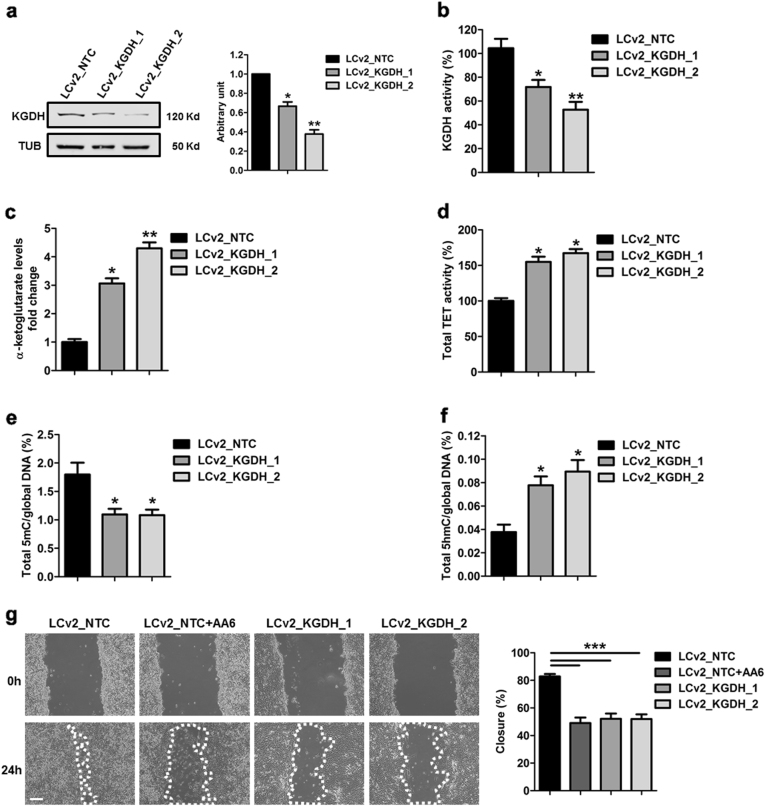
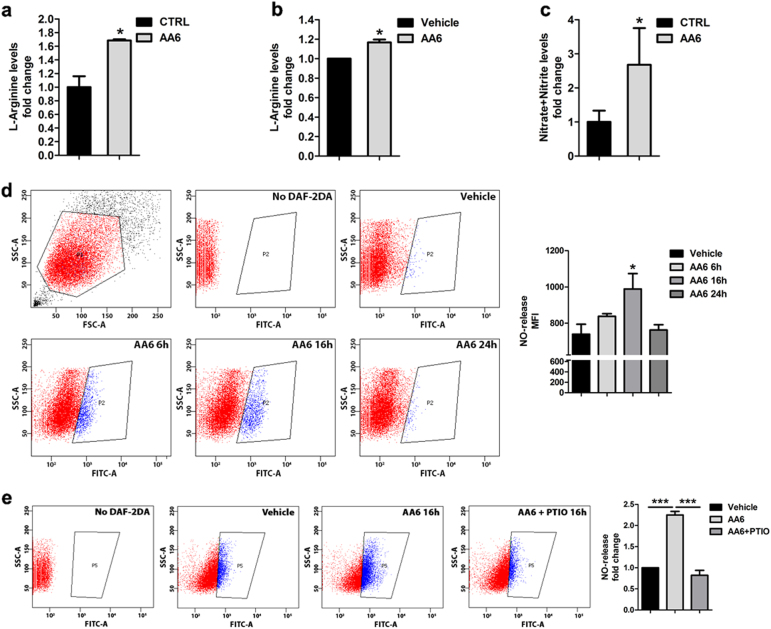
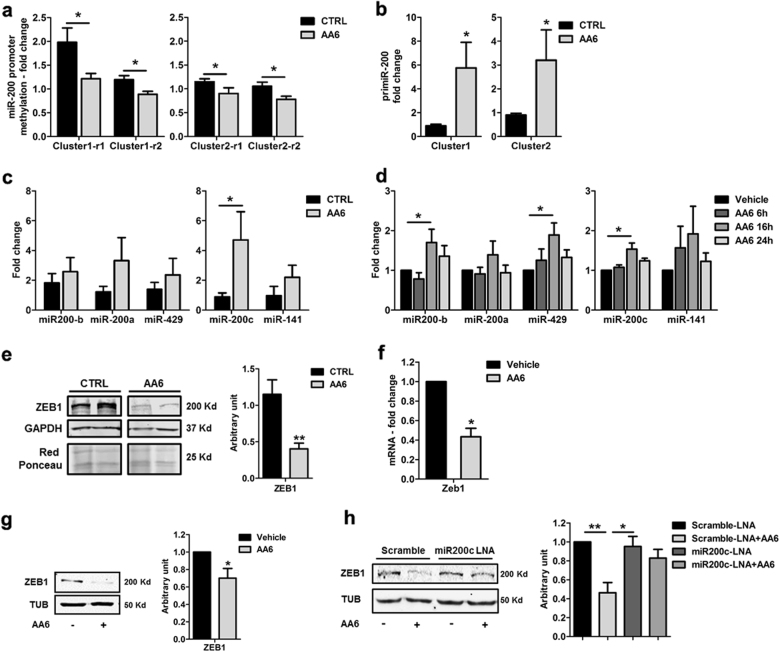
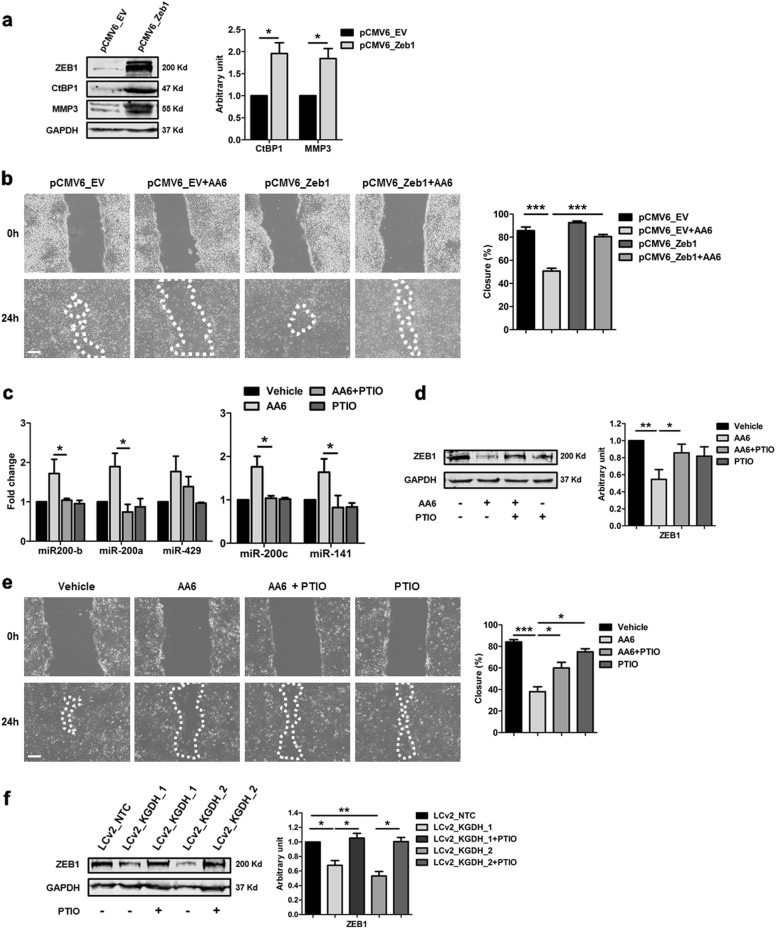
Metastasis formation requires active energy production and is regulated at multiple levels by mitochondrial metabolism. The hyperactive metabolism of cancer cells supports their extreme adaptability and plasticity and facilitates resistance to common anticancer therapies. In spite the potential relevance of a metastasis metabolic control therapy, so far, limited experience is available in this direction. Here, we evaluated the effect of the recently described α-ketoglutarate dehydrogenase (KGDH) inhibitor, (S)-2-[(2,6-dichlorobenzoyl) amino] succinic acid (AA6), in an orthotopic mouse model of breast cancer 4T1 and in other human breast cancer cell lines. In all conditions, AA6 altered Krebs cycle causing intracellular α-ketoglutarate (α-KG) accumulation. Consequently, the activity of the α-KG-dependent epigenetic enzymes, including the DNA demethylation ten-eleven translocation translocation hydroxylases (TETs), was increased. In mice, AA6 injection reduced metastasis formation and increased 5hmC levels in primary tumours. Moreover, in vitro and in vivo treatment with AA6 determined an α-KG accumulation paralleled by an enhanced production of nitric oxide (NO). This epigenetically remodelled metabolic environment efficiently counteracted the initiating steps of tumour invasion inhibiting the epithelial-to-mesenchymal transition (EMT). Mechanistically, AA6 treatment could be linked to upregulation of the NO-sensitive anti-metastatic miRNA 200 family and down-modulation of EMT-associated transcription factor Zeb1 and its CtBP1 cofactor. This scenario led to a decrease of the matrix metalloproteinase 3 (MMP3) and to an impairment of 4T1 aggressiveness. Overall, our data suggest that AA6 determines an α-KG-dependent epigenetic regulation of the TET-miR200-Zeb1/CtBP1-MMP3 axis providing an anti-metastatic effect in a mouse model of breast cancer-associated metastasis.


Conflict of interest statement

The authors declare that they have no conflict of interest.

Figures

Fig. 1
Fig. 1. AA6 prevents 4T1 cell lung metastasis formation.
a Hematoxylin and eosin staining: arrows represent lung metastasis reduction after 3 weeks of treatment of 4T1 orthotopic mouse model of breast cancer with AA6 (12.5 mg/kg n = 10; 50 mg/kg n = 5), compared to controls; n = 10. Scale bar 50 μm. b–d The graph shows the measured metastasis area in AA6 treated mice (12.5–50 mg/kg; grey bars) compared to controls (black bars) (b) and the percentage of metastasis incidence analysed by Mantel-Cox Test (*p = 0.0082) (c); no difference was observed in the primary - tumour volume (d). e, f Representative confocal images (left panels) and relative densitometry (right panels) showing cell proliferation (Ki67) (e) and apoptosis (CASP3) (f) in AA6 treated mice primary tumour (12.5–50 mg/kg; grey bars) compared to controls (black bars). Samples were probed by an anti-Ki67 antibody (green; monoclonal), anti-CASP3 (green; monoclonal) and counterstained by DAPI (blue). Scale bar 50 μm; control n = 10; 12.5 mg/kg n = 10; 50 mg/kg n = 5. g, h Representative immunohistochemistry images (left panels) and relative quantification (right panels) showing cell proliferation (Ki67) (g) and apoptosis (CASP-3) (h) in AA6 treated mice primary tumour (grey bars) compared to controls (black bars). Samples were probed by an anti-Ki67 antibody (monoclonal), anti-CASP3 (monoclonal) and counterstained by hematoxylin. Scale bar 50 μm; control n = 10; 12.5 mg/kg n = 10; 50 mg/kg n = 5. Data are presented as mean ± SE; *p < 0.0332, **p < 0.0021, ***p < 0.0002 vs controls. Data were analysed by non-parametric Mann–Whitney test
Fig. 2
Fig. 2. AA6 administration decreases metastasis-associated transcripts and interferes with 4T1 cells migration.
a Heatmap showing the 53 most differentially regulated genes in tumour mass derived from AA6 injected mice (50 mg/kg), or untreated mice; n = 3 each group. Yellow and blue represent over- and under-expressed genes, respectively. b mRNA expression analysis of Matrix metallopeptidase 3 (Mmp3), Glycoprotein transmembrane non-metastatic B (Gpnmb), C-terminal binding protein 1 (Ctbp1), Plasminogen activator, urokinase receptor (Plaur) and Rous sarcoma oncogene (Src) genes in AA6 injected mice (50 mg/kg; grey bars) and control mice (black bars); n = 5. c Representative western blot (upper panels) and relative densitometry (lower panel) of MMP3, GPNMB, CtBP1 and SRC protein levels in AA6 (50 mg/kg; grey bars) treated mice compared to controls (black bars). GRB2 and GAPDH were used as loading controls; n = 5 each group. d Representative phase contrast microscopy images (upper panel) depicting 4T1 cells motility after 24 h treatment with AA6 (50 µM) or vehicle alone; the graph (lower panel) shows the percentage of closure in 4T1 cells after 24 h treatment with AA6 (50 µM; grey bar) or vehicle (black bar). Scale bar 100 μm; n = 5 each group. e Representative pictures (upper panel) showing 4T1 cell invasiveness after AA6 (50 µM) treatment versus vehicle; the graphs (lower panel) represent migrated cells counted after 24 h treatment with AA6 (50 µM; grey bar) or vehicle alone (black bar). Scale bar 50 μm; n = 3. Data are presented as mean ± SE; *p < 0.05, **p < 0.005, ***p < 0.0005 vs controls. Data were analysed by two-way ANOVA and non-parametric two-tailed paired Student’s t-test
Fig. 3
Fig. 3. KGDH inhibition increases TET expression and modulates 5mC/5hmC global levels both in vivo and in vitro.
a Ten-eleven translocation hydroxylases (Tet) -1, 2, 3 mRNA expression levels in AA6 injected mice (50 mg/kg; grey bars) and control mice (black bars); n = 5. b Representative western blot (left panel) and relative densitometry (right panel; n = 4) of TET1, 2, 3 in AA6 (50 mg/kg; grey bars) treated mice compared to controls (black bars). α-tubulin and Glyceraldehyde 3-phosphate dehydrogenase (GAPDH) were used as a loading controls. c Representative confocal images depicting the intracellular content of TET1, 2, 3 enzymes in 4T1 cells treated with AA6 (50 µM) or vehicle alone. Cells were probed by an anti-TET1 antibody (red; monoclonal), TET2 (green; polyclonal), TET3 (green; polyclonal) and counterstained by DAPI (blue). Scale bar 25 μm; n = 3. d TET activity quantification performed in 4T1 cells treated with AA6 (50 µM; grey bar) for 48 h indicated as percentage versus vehicle-treated cells (black bar); n = 3. e Quantification of 5mC (left panel) and 5hmC (right panel) global levels in 4T1-injected mice after AA6 administration (50 mg/kg; grey bars) compared to untreated mice (black bars); n = 5 each group. f Quantification of 5mC (left panel) and 5hmC (right panel) global levels in 4T1 cells exposed to AA6 (50 µM; grey bars) for 48 h indicated as fold-change versus vehicle-treated cells (black bars); n = 3 each group. Data are presented as mean ± SE; *p < 0.05 vs controls. Data were analysed by two-way ANOVA and non-parametric two-tailed paired Student’s t-test
Fig. 4
Fig. 4. CRISPR/Cas9 KGDH inactivation increases α-KG levels, TET activity and global 5hmC and interferes with 4T1 cell line biological properties.
a Representative WB (left panel) and relative densitometry (right panel) of KGDH protein levels in 4T1 cells after CRISPR/Cas9 inactivation of KGDH (LCv2_KGDH_1 and LCv2_KGDH_2) compared to control vector (LCv2_NTC). α-tubulin was used as a loading control; n = 5. b KGDH activity and c α-KG level quantification of LCv2_NTC- (black bars), LCv2_KGDH_1- (dark grey bars) and LCv2_KGDH_2- (light grey bars) 4T1 cells; n = 3 each group. d TET activity quantification performed in LCv2_KGDH_1- (dark grey bar) and LCv2_KGDH_2- (light grey bar) 4T1 cells compared to LCv2_NTC (black bar); n = 3. e Global 5mC and f 5hmC levels in 4T1 cells after CRISPR/Cas9 inactivation of KGDH (LCv2_KGDH_1 and LCv2_KGDH_2; grey bars) compared to control vector (LCv2_NTC; black bars); n = 3 each group. g Representative phase contrast microscopy images (left panel) and relative percentage of closure measurements (right panel) showing 4T1 cells motility after CRISPR/Cas9 inactivation of KGDH (LCv2_KGDH_1; medium grey bar and LCv2_KGDH_2; light grey bar) compared to control vector (LCv2_NTC; black bar) in the presence or absence of AA6 (50 µM; dark grey bars). Scale bar 100 μm; n = 3 each condition. Data are presented as means ± SE; *p < 0.05, **p < 0.005, ***p < 0.0005 vs controls. Data were analysed by non-parametric two-tailed paired Student’s t-test
Fig. 5
Fig. 5. AA6 increases nitric oxide-release in 4T1 cells.
a L-Arginine levels in 4T1-injected mice after AA6 administration (50 mg/kg; grey bar) compared to untreated mice (black bar); n = 3. b L-Arginine levels in 4T1 cells after 16 h of treatment with AA6 (50 µM; grey bar) or vehicle alone (black bar); n = 3. c Nitrate and nitrite quantification in 4T1-injected mice after AA6 administration (50 mg/kg; grey bar) compared to untreated mice (black bar); n = 3. d Representative dot plot (left panel) and relative densitometry (right panel) showing NO-release evaluation by FACS analysis of DAF-2DA-stained 4T1 cells, after 6, 16, and 24 h of treatment with AA6 (50 µM; grey bars), expressed as fold change to vehicle-treated cells (black bar); the gated cell populations (blue, P5) indicate DAF-2T-positive cells for each condition, negative controls were in absence of DAF-2D; n = 3 each group. e Representative dot plot (left panel) and relative densitometry (right panel) showing NO-release evaluation by FACS analysis of DAF-2 DA stained 4T1 cells after 16 h of treatment with vehicle only (black bar), AA6 (50 µM; light grey bar) and AA6 (50 µM) + PTIO (100 µM; dark grey bar); n = 4 each condition. Data are presented as mean ± SE; *p < 0.05, ***p < 0.0005 vs controls. Data were analysed by one-way ANOVA and non-parametric two-tailed paired Student’s t-test
Fig. 6
Fig. 6. AA6 prevents metastasization targeting the TET–miR200–Zeb1/CtBP1–MMP3 axis.
a Relative enrichment of 5mC in selected CCpGG sites of miR-200 family promoter regions for cluster 1 (left panel) and cluster 2 (right panel) in 4T1-injected mice DNA treated with AA6 (50 mg/kg; grey bars) versus control mice DNA (black bars); n = 5. b Pri-miR-200 cluster 1 (left panel) and cluster 2 (right panel) level of AA6 (50 mg/kg; grey bars) treated 4T1-injected mice expressed as fold-induction compared to untreated mice (black bars); n = 3. c Cluster 1 (miR-200b, miR-200a and miR-429; left panel) and cluster 2 (miR-200c and miR-141; right panel) expression in 4T1-injected mice treated with AA6 (50 mg/kg; grey bars), the graph represents average fold changes versus controls (black bars); n = 4. d Cluster 1 (miR-200b, miR-200a and miR-429; left panel) and cluster 2 (miR-200c and miR-141; right panel) expression in 4T1 cells treated with AA6 (50 µM; grey bars) for 6, 16, and 24 h, bar graphs represent average fold changes versus vehicle-treated cells (black bars); n = 4. e Representative WB (left panel) and relative densitometry (right panel; n = 5) of ZEB1 protein level in AA6 (50 mg/kg; grey bar) treated mice compared to controls (black bar). GAPDH and Red Ponceau were used as loading controls. f, g Zeb1 mRNA expression levels (f) and representative western blotting analysis of ZEB1 protein expression (g) in 4T1 cells exposed to AA6 (50 µM; grey bars) for 48 h indicated as fold-change versus vehicle-treated cells (black bars); the right panel shows the relative densitometry as fold-change versus vehicle. α-tubulin was used as loading control; n = 4. h Representative WB (left panel) and relative densitometry (right panel) of ZEB1 protein expression level in AA6 treated 4T1 cells compared to vehicle-treated cells after transfection either with scramble-LNA (vehicle: black bar; AA6 50 µM: light grey bar) or anti-miR-200c-LNA (vehicle: dark grey bar; AA6 50 µM: medium grey bar). α-tubulin was used as loading control; n = 4. Data are presented as mean ± SE; *p < 0.05, **p < 0.005 vs controls. Data were analysed by one and two-way ANOVA and non-parametric two-tailed paired Student’s t-test
Fig. 7
Fig. 7. Zeb1 overexpression or PTIO administration counteracts AA6 effect in 4T1 cells.
a Representative WB (left panel) and relative densitometry (right panel) of ZEB1, CtBP1, and MMP3 protein levels in 4T1 cells transfected with pCMV6_Zeb1 (grey bars) after 48 h compared to control vector (pCMV6; black bars). GAPDH was used as a loading control; n = 4. b Representative phase contrast images (left panel) depicting 4T1 cells motility and relative percentage of closure measurements (right panel) after Zeb1 overexpression (pCMV6_Zeb1; dark grey bar and pCMV6_Zeb1 + AA6–50 µM; medium grey bar) compared to control vector (pCMV6; black bar and pCMV6 + AA6–50 µM; light grey bars). Scale bar 100 μm; n = 4. c Cluster 1 (miR-200b, miR-200a, and miR-429; left panel) and cluster 2 (miR-200c and miR-141; right panel) expression in 4T1 cells after 16 h of treatment with vehicle only (black bars), AA6 (50 µM; light grey bars), AA6 (50 µM) + PTIO (100 µM; medium grey bars) and PTIO alone (100 µM; dark grey bars); n = 3. d Representative WB (left panel) and relative densitometry (right panel) of ZEB1 levels in 4T1 cells after 16 h of treatment with vehicle alone (black bar), AA6 (50 µM; light grey bar), AA6 (50 µM) + PTIO (100 µM; medium grey bar) and PTIO alone (100 µM; dark grey bar). GAPDH was used as a loading control; n = 4. e Representative phase contrast images (left panel) depicting 4T1 cells motility and relative percentage of closure measurements (right panel) in 4T1 cells after 16 h of treatment with vehicle only (black bar), AA6 (50 µM; light grey bar), AA6 (50 µM) + PTIO (100 µM; medium grey bar) and PTIO alone (100 µM; dark grey bar); n = 4. f Representative WB (left panel) and relative densitometry (right panel) of ZEB1 levels in 4T1 cells after CRISPR/Cas9 inactivation of KGDH (LCv2_KGDH_1 and LCv2_KGDH_2; light grey bars) compared to control vector (LCv2_NTC; black bar) with or without PTIO (100 µM; dark grey bars) treatment. GAPDH was used as a loading control; n = 4. Data are presented as mean ± SE; *p < 0.05, **p < 0.005, ***p < 0.0005 vs controls. Data were analysed by one and two-way ANOVA and non-parametric two-tailed paired Student’s t-test

References

    1. Jemal A, et al. Global cancer statistics. CA Cancer J. Clin. 2011;61:69–90. doi: 10.3322/caac.20107. - DOI - PubMed
    1. Siegel R, Naishadham D, Jemal A. Cancer statistics, 2013. CA Cancer J. Clin. 2013;63:11–30. doi: 10.3322/caac.21166. - DOI - PubMed
    1. Di Cosimo S, Baselga J. Management of breast cancer with targeted agents: importance of heterogeneity. [corrected] Nat. Rev. Clin. Oncol. 2010;7:139–147. doi: 10.1038/nrclinonc.2009.234. - DOI - PubMed
    1. Coleman RE, Rubens RD. The clinical course of bone metastases from breast cancer. Br. J. Cancer. 1987;55:61–66. doi: 10.1038/bjc.1987.13. - DOI - PMC - PubMed
    1. Elias AD. Triple-negative breast cancer: a short review. Am. J. Clin. Oncol. 2010;33:637–645. doi: 10.1097/COC.0b013e3181b8afcf. - DOI - PubMed

Publication types

MeSH terms