. 2018 Aug;19(8):871-884.
doi: 10.1038/s41590-018-0156-5. Epub 2018 Jul 9.

Second signals rescue B cells from activation-induced mitochondrial dysfunction and death

Affiliations

Second signals rescue B cells from activation-induced mitochondrial dysfunction and death

Munir Akkaya et al. Nat Immunol. 2018 Aug.

Abstract

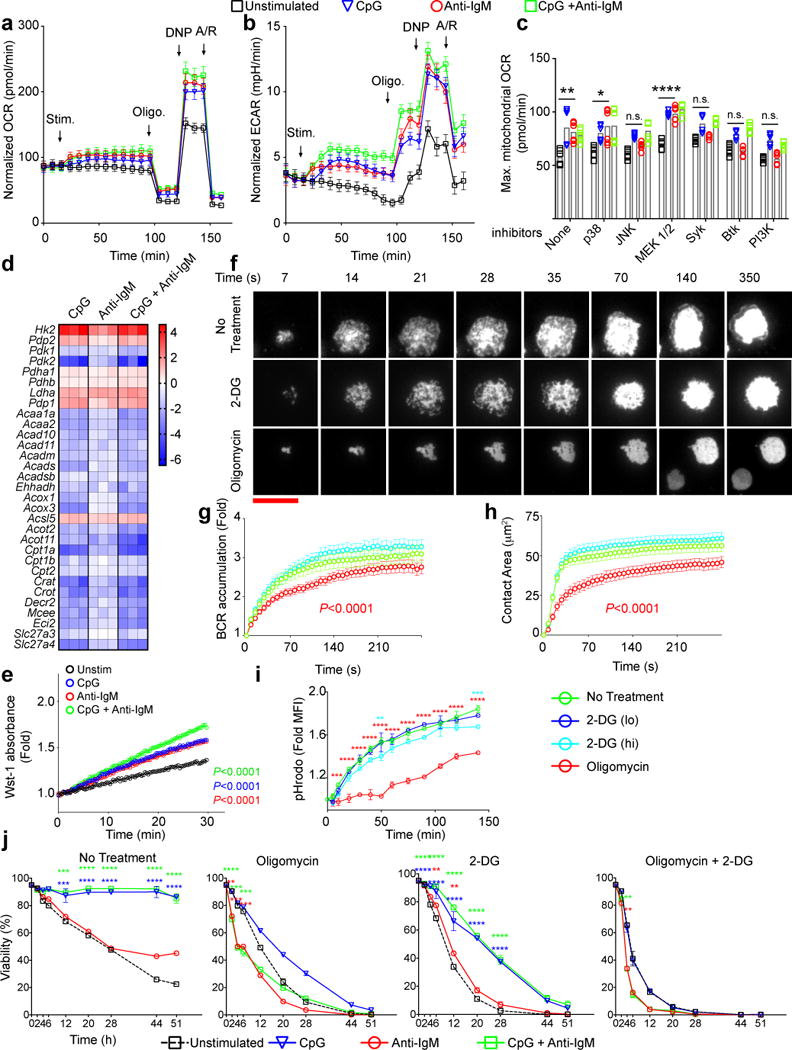
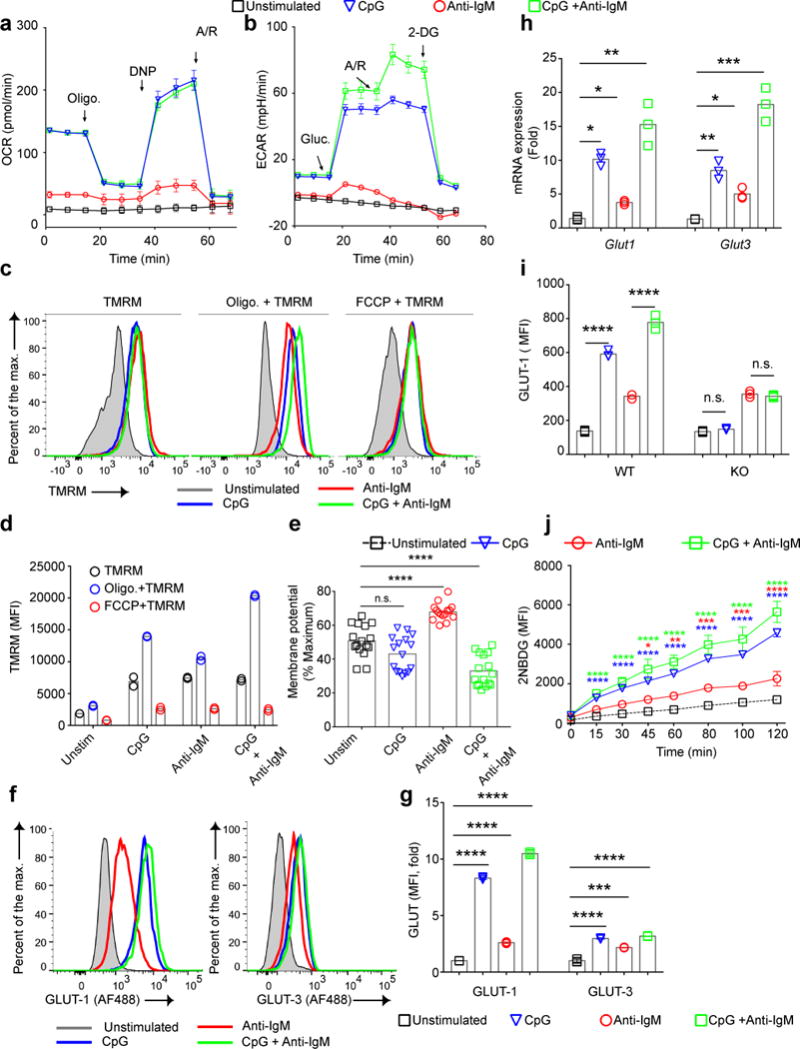
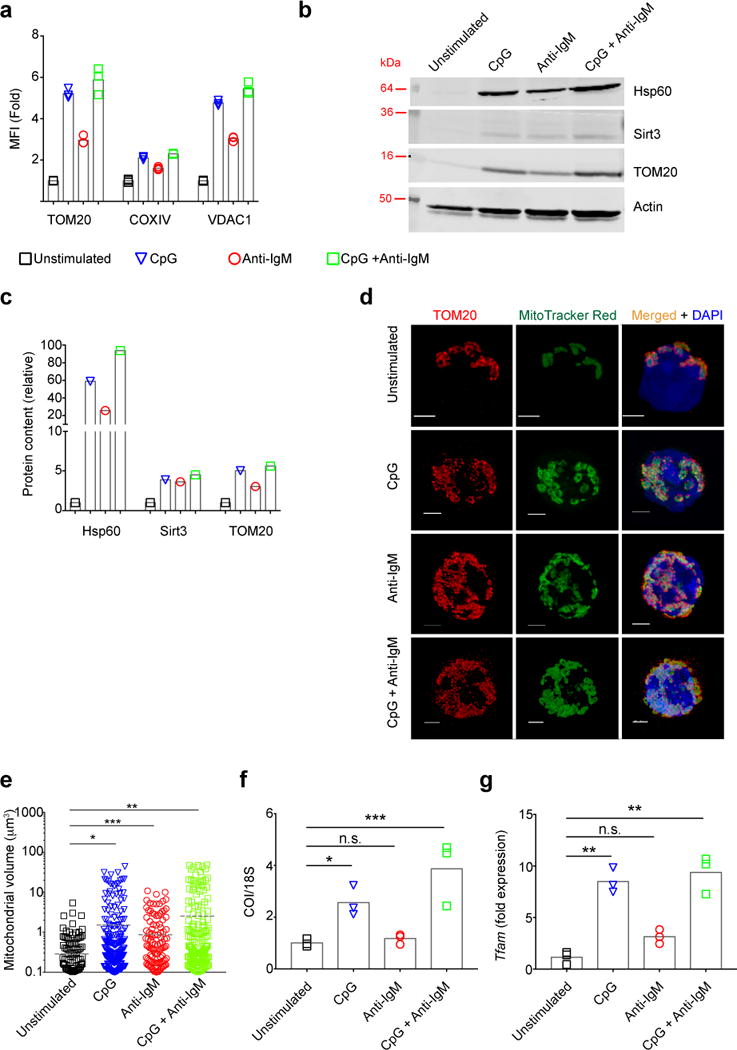
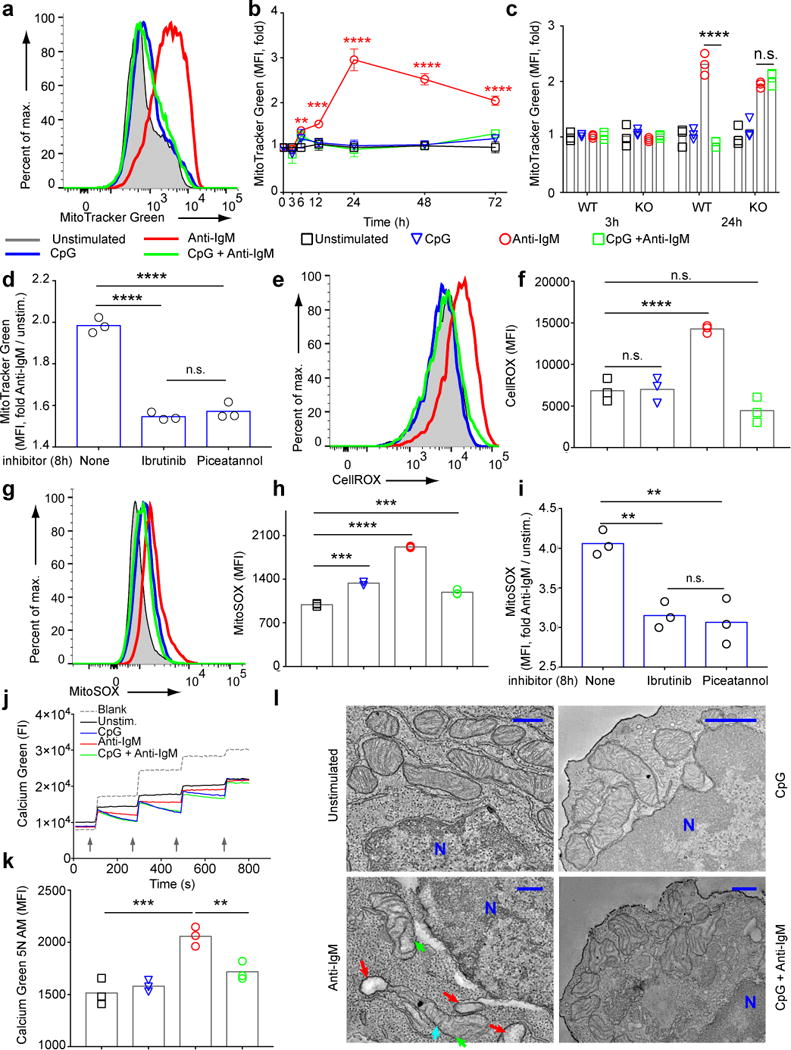
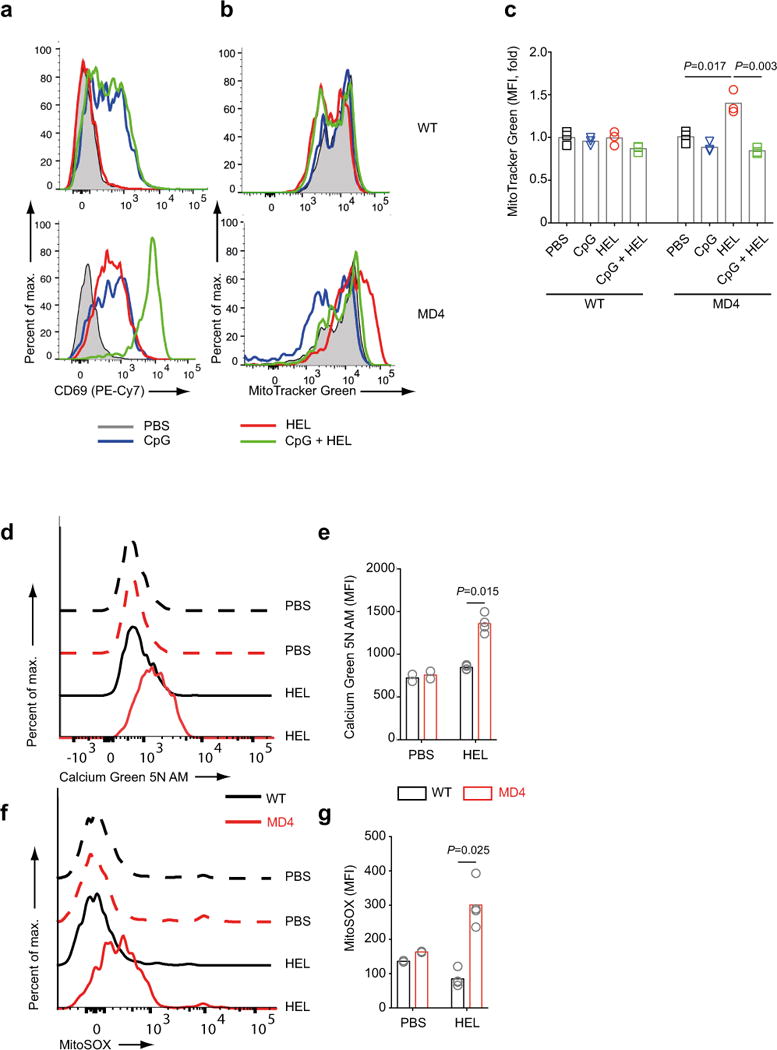
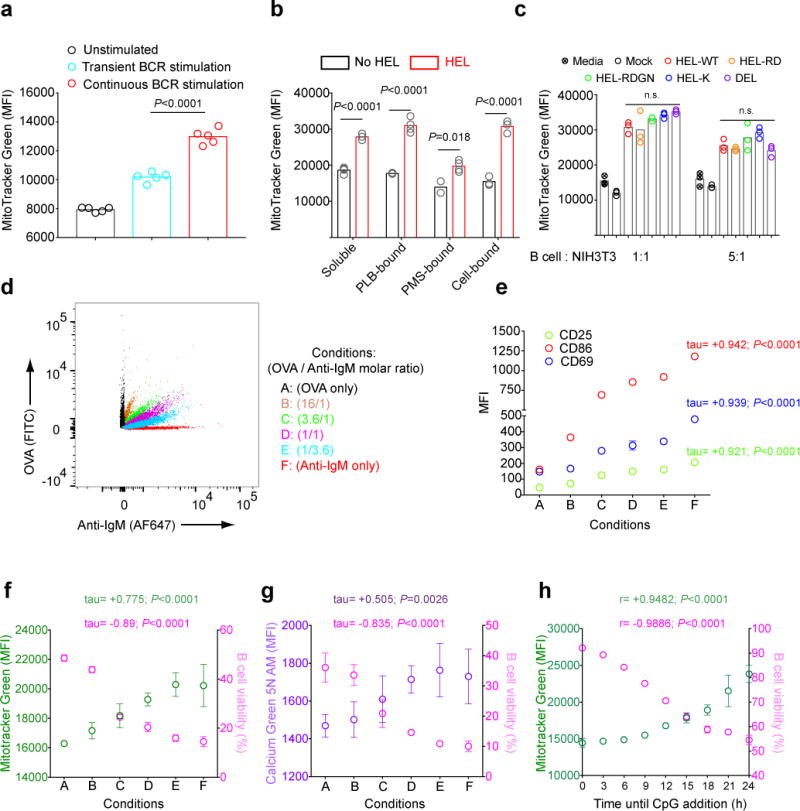
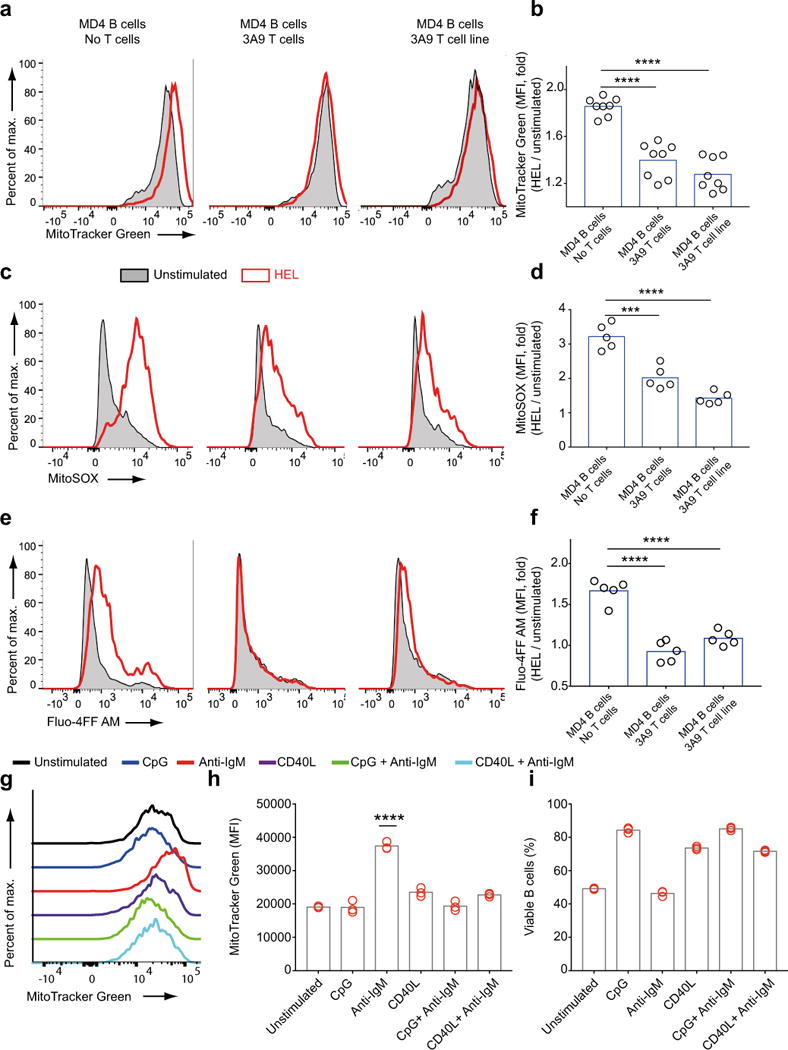
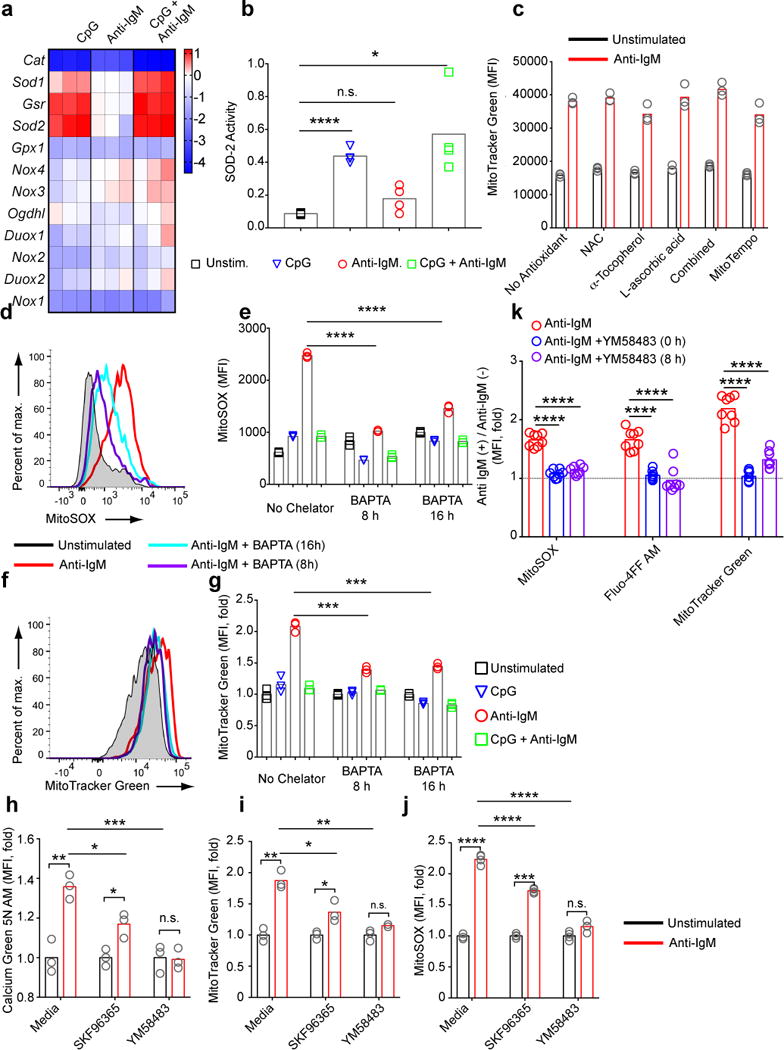
B cells are activated by two temporally distinct signals, the first provided by the binding of antigen to the B cell antigen receptor (BCR), and the second provided by helper T cells. Here we found that B cells responded to antigen by rapidly increasing their metabolic activity, including both oxidative phosphorylation and glycolysis. In the absence of a second signal, B cells progressively lost mitochondrial function and glycolytic capacity, which led to apoptosis. Mitochondrial dysfunction was a result of the gradual accumulation of intracellular calcium through calcium response-activated calcium channels that, for approximately 9 h after the binding of B cell antigens, was preventable by either helper T cells or signaling via the receptor TLR9. Thus, BCR signaling seems to activate a metabolic program that imposes a limited time frame during which B cells either receive a second signal and survive or are eliminated.


Conflict of interest statement

COMPETING INTERESTS STATEMENT.

Authors declare no competing financial interests.

Figures

Figure 1
Figure 1
Similar metabolic changes occur immediately following B cell stimulation through either BCR or TLR9. a,b) Changes in Oxygen Consumption Rates (OCR) (a) and Extra Cellular Acidification Rates (ECAR) (b) were measured in real time for B cells stimulated with CpG (1 μM) and/or anti-IgM (5 μg/ml) or unstimulated. Arrows indicate the time points stimulants, oligomycin, DNP and antimycin/rotenone (A/R) were added to the wells. The data are pooled from 10 individual samples acquired in three independent experiments. Symbols and error bars represent the mean and standard error of the mean respectively. c) Maximum OCR levels following addition of 2,4-DNP were measured in B cell cultures in which the indicated inhibitors were added immediately after the stimulants. Bars indicate mean of ten individual samples, shown by symbols, pooled from two experiments. d) Heat maps show the log2 scale fold change in expression levels of a set of genes involved in glucose or fatty acid metabolism from RNA seq data of purified mouse splenic B cells that were cultured in media alone or media containing CpG (1 μM) and/or anti-IgM (5 μg/ml) in triplicates for 4h. e) Quantification of PDH activity in B cells following 6h in culture in media alone (unstimulated) or in media containing CpG alone, anti-IgM alone or both using colorimetric assay through Wst-1 reporter dye absorbance. f) HEL-specific MD4 B cells labeled with DyLight549-Fab anti-IgM to allow imaging of the BCRs were placed on HEL-containing PLBs without metabolic inhibitors (No Treatment) or with either 2-DG (55 mM) or Oligomycin (6 μM) and live cell time-lapse TIRF images were acquired for 30 min at 37°C. Representative TIRF images are shown. (scale bar = 10 μm) g) BCR accumulation in the contact area of the B cell with the HEL-PLB presented as the fold increase in BCR MFI above background at each time point. h) The contact area of the B cell with the HEL-PLB. Statistically significant decrease from unstimulated B cells are shown with a P value in the color of the symbol. i) HEL-specific B cells from MD4 mice were incubated with pHrodo-conjugated-HEL on ice, warmed to 37 °C in the presence or absence of 2-DG (lo=11mM, hi=55 mM) or Oligomycin (6 μM). Fold changes in pHrodo MFI compared to the initial time points are shown. Symbols and error bars refer to the mean of three replicates and standard deviation respectively. Data are representative of three independent experiments. j) Purified mouse splenic B cells were incubated in media alone or in media containing CpG (1 μM) and/or anti-IgM (5 μg/ml) in the presence or absence of 2-DG (11 nM) and/or Oligomycin (6 μM). Cell viability determined by staining with Live/Dead marker by flow cytometry is given as a function of time. Symbols and error bars refer to the mean of six replicates and standard error respectively. Data are pooled from two independent experiments. For all panels data points that are significantly different from the unstimulated (Panels a,b,g) or no-inhibitor conditions (Panels c,g,h,i,j) are shown with color-coded asterisks or as adjusted p values. (Panels i,j: two way ANOVA with Dunnet’s adjustment; Panel c: one way ANOVA with Tukey’s adjustment, Panel e: linear regression, Panels g,h: cubic regression with Bonferroni’s adjustment) (P>0.05 = n.s.; 0.01 <P ≤0.05 = *;0.001 <P ≤0.01 = **; 0.0001 <P ≤0.001 = ***; P ≤0.0001= ****)
Figure 2
Figure 2
Glycolytic capacity and maximal mitochondrial respiration are correlated with B cell survival. a, b) Purified B cells were cultured in vitro in media alone or media containing CpG (1 μM) and/or anti-IgM (5 μg/ml) for 24 h. Cells were stained with a viability marker and FACS sorted for live cells. Changes in OCR by a mitochondrial stress test (a) and ECAR by a glycolytic stress test (b) are shown. Arrows indicate the time points glucose, 2-DG, Oligomycin, 2,4-DNP and Antimycin/Rotenone (A/R) were added. Data represent three independent experiments each carried out with triplicates. Symbols and error bars represent mean and standard error of the mean respectively. c-h) Purified B cells were stimulated with CpG (1 μM) and/or anti-IgM (5 μg/ml) or left unstimulated for 24h and mitochondrial membrane potentials were measured by staining with TMRM alone or in the presence of oligomycin or FCCP. Representative flow cytometry plots are shown (c) as are the average TMRM values (d) and the percent of the maximum membrane potential used by B cells under each stimulation condition, calculated from a pool of 5 independent experiments with each individual sample represented as a symbol (e). MFI of surface levels of GLUT-1 and GLUT-3 detected by flow cytometry are shown as representative FACS plots (f) and as average fold changes in MFI (g). The fold changes in GLUT-1 and GLUT-3 RNA levels detected by qPCR are given (h). i) MFI levels of GLUT-1 24h post stimulation are shown for B cells isolated from WT and TLR-9 KO mice stimulated with CpG and/or anti-IgM in vitro. j) B cells were cultured in media containing CpG and/or anti-IgM for 24h. During the last 2h of culture 2NBDG was added to the cultures and the MFI of 2NBDG taken up by the cells was measured by flow cytometry at intervals. Data represent three independent experiments each in triplicates. Bars indicate the mean of the triplicates. Data points that are significantly different from the unstimulated conditions are shown with asterisks. (Panels j: two way ANOVA with Dunnet’s adjustment; Panels d,e,g,h,i: one way ANOVA with Tukey’s adjustment) (P>0.05 = n.s.; 0.01 <P ≤0.05 = *;0.001 <P ≤0.01 = **; 0.0001 <P ≤0.001 = ***; P ≤0.0001= ****).
Figure 3
Figure 3
Increases in mitochondrial mass in response to activation through the BCR and/or TLR9. a) Purified B cells were stimulated with CpG (1 μM) and/or anti-IgM (5 μg/ml) or left unstimulated for 24h and stained with Live/Dead marker, fixed, permeabilized and stained with antibodies specific for the mitochondrial markers: TOM20; COXIV; and VDAC1. MFI levels quantified by flow cytometry are shown. Data represent three independent experiments each carried out with three replicates. Bars represent mean. b,c) B cells cultured in vitro for 24 h as in (a) were stained with Live/Dead marker and viable B cells were FACS sorted and lysates from equal number of cells were analyzed by immunoblot for: Hsp60; Sirt3, TOM20 and actin. The immunoblot was cropped guided by the appropriate molecular weight markers. Representative immunoblot (b) and quantification of the blot relative to actin (c) are given. Data represent three independent experiments. d,e) Purified mouse splenic B cells were cultured in vitro for 24 h in media containing CpG (1 μM) and/or anti-IgM (5 μg/ml), stained with Live/Dead marker and MitoTracker Red, washed and plated on poly-L-lysine coated coverslips. Cells were fixed, permeabilized and stained with TOM20-specific antibodies and DAPI and imaged by STED microscopy. Representative microscope images (d) and quantification of mitochondrial volume for each stimulation condition (e) are shown. Scale bar = 2 μm. Data represent two independent experiments. Images of at least 30 viable cells per experiment were analyzed for each condition. Dashed lines represent the mean values. f,g) Purified B cells cultured in vitro for 24 h as in (a) were harvested and total DNA and RNA were isolated. The relative levels of COI DNA to 18S DNA (f) and TFAM gene expressions compared to unstimulated condition were quantified by qPCR (g). Data represent three independent experiments each of which were carried out in triplicates. Bars represent mean. (P>0.05 = n.s.; 0.01 <P ≤0.05 = *;0.001 <P ≤0.01 = **; 0.0001 <P ≤0.001 = ***; P ≤0.0001= ****) (Panels a,f,g: One Way ANOVA with Tukey’s adjustment; Panel e: Mann-Withney test:).
Figure 4
Figure 4
B cells stimulated only through their BCRs in vitro show mitochondrial dysfunction. a,b) Purified B cells were stimulated with CpG (1 μM) and/or anti-IgM (5 μg/ml) or left unstimulated. (a) Flow cytometry plots showing MitoTracker Green staining in the live B cell gate at 24 h post stimulation and (b) quantification of the fold change in MitoTracker Green MFI compared to unstained cells over the course of 72 h culture in vitro are shown. Symbols represent the means of each triplicate and error bars indicate SD. Data represent more than three independent experiments. c) B cells purified from WT and TLR9 KO mice and cultured as in (a) were stained with MitoTracker Green and Live/Dead at 3 h and 24 h post stimulation. Fold changes in MFI are shown. Bars indicate the mean values and error bars the SD of triplicate cultures. Data are representative of three independent experiments. d) B cells were cultured in media containing anti-IgM in the presence or absence of the Btk inhibitor Ibrutinib (1 μM) or the Syk inhibitor Piceatannol (5 μM) added to cultures 8 h post stimulation. Cells were incubated for an additional 16 h, harvested and analyzed for MitoTracker Green FI at 24 h. Fold MFI levels are shown. e-h) Purified B cells were cultured in vitro in the presence of CpG (1 μM) and/or anti-IgM (5 μg/ml) for 24 h. Levels of CellROX (e,f) and MitoSOX (g-i) staining at 24 h are shown as representative flow cytometry plots (e,g) and as the mean and SD of the MFI of triplicate samples (f,h). Each experiment was carried out at least three times with three samples per condition. i) B cells were cultured as in (d) and the fold MFI of MitoSOX staining determined by flow cytometry. j) Mitochondrial calcium uptake was measured in viable B cells purified following 24 h culture in media containing CpG and/or anti-IgM. Cells were pulsed four times with CaCl2 (20 μM) (indicated with arrow heads) and changes in Calcium Green 5N were measured in real time. Data represent three independent experiments. k) B cells were stimulated for 24 h in media containing CpG and/or anti-IgM, harvested and stained with Live/Dead dye and Calcium Green 5N AM to measure intracellular calcium accumulation in viable cells. Bars represent the mean. The experiment was repeated more than three times with at least three replicates per condition. l) B cells were cultured for 24 h in media containing CpG and/or anti-IgM, harvested, fixed and imaged by TEM. Two independent sets of samples were analyzed and at least 10 viable cells per condition were imaged. Swollen mitochondria (red arrow heads), vesicular swollen mitochondria (green arrow heads) and blunted cristae (cyan arrow heads) are shown. N indicates the nucleus. Scale bar = 100 μm. (P>0.05 = n.s.; 0.001 <P ≤0.01 = **; 0.0001 <P ≤0.001 = ***; P ≤0.0001= ****) (Panel b: Two way ANOVA with Dunnet’s adjustment; Panels d,f,i,k: One way ANOVA with Tukey’s adjustment).
Figure 5
Figure 5
B cells stimulated with antigen alone in vivo show mitochondrial dysfunction. Fluorescently labelled B cells from CD45.1 WT and CD45.2 MD4 mice were mixed and adoptively transferred to WT mice as shown in Fig S6. Flow cytometry plots show the expression of CD69 (a) and MitoTracker Green (b) and quantification of the fold change in MitoTracker Green MFI for WT and MD4 B cells 24 h post i.v. injection with PBS alone, CpG alone, HEL alone or HEL plus CpG (c). Mice were injected with HEL in PBS (100 μg/mouse) or PBS alone and 24 h later splenocytes were stained for CD19, CD45.1, CD45.2 and Calcium Green 5N AM (d,e) and MitoSOX (f,g) and analyzed by flow cytometry. Shown are representative flow cytometry histograms (d,f) and the average MFI values as bar graphs (e,g). Each adoptive transfer experiment was repeated three times with three or more mice per stimulation condition. Bars represent the mean. Symbols represent individual mice. (Panel e: one way ANOVA with Tukey’s adjustment; Panels g,i: Welch’s t-test).
Figure 6
Figure 6
Antigen-induced mitochondrial dysfunction in B cells correlates with the strength and duration of the BCR stimulation a) Purified B cells were incubated on ice in media alone or in media containing anti-IgM (10 μg/ml), washed and resuspended in either media alone or in media containing anti-IgM (10 μg/ml). Cells were warmed to 37°C, cultured for 24 h in vitro. Live cells were obtained by FACS sorting and stained with MitoTracker Green. MFIs of MitoTracker Green in viable B cells are shown. Bars represent mean values and circles represent individual samples. b) HEL-specific B cells from MD4 mice were unstimulated or stimulated for 24 h with HEL in the following forms: soluble (1 μg/ml); PLB-bound; PMS-bound or expressed on the surface of NIH3T3 cells (cell-bound). The B cell MitoTracker Green MFI was measured by flow cytometry. Bars represent mean values. Data represent two independent experiments with three replicates. c) HEL-specific B cells purified from MD4 mice were co-cultured with untransfected NIH3T3 cells (mock) or NIH3T3 cells stably expressing the indicated proteins at cell ratios of 1:1 or 5:1 for 24 h and MitoTracker Green MFI of B cells measured by flow cytometry. Bars indicate mean values. Results are representative of two experiments. d-g) Biotinylated anti-IgM and OVA were mixed at different molar ratios and incubated with streptavidin coated beads (d). Beads were washed and the amounts of OVA versus anti-IgM on the bead surface was determined by flow cytometry using fluorescently labelled antibodies. B cells were incubated with the beads for 24 h in vitro and analyzed for: (e) the expression of the B cell activation markers, CD25, CD86 and CD69; (f) MitoTracker Green staining; (g) Calcium Green 5N AM staining and (f,g) cell viability using Live/Dead stain. Symbols and error bars indicate mean and SD values. Data are representative of three independent experiments each with three replicates per condition. h) B cells were incubated with anti-IgM (5μg/ml) in vitro and CpG was added to cultures at a final concentration of 1 μM at various times after the initiation of the cultures beginning at 3 h. Viability determined by Live/Dead stain and MitoTracker Green MFI were determined at 24 h. Data represent two independent experiments each with three replicates per condition. (P>0.05 = n.s.) (Panel a,c: one way ANOVA with Tukey’s adjustment; Panel b: Welch’s t-test; Panel e-g: Kendall’s tau correlation; Panel h: Pearson’s correlation)
Figure 7
Figure 7
T cell help prevents antigen-induced mitochondrial dysfunction in B cells a-f) HEL-specific B cells from MD4 mice were cultured alone or with equal numbers of HEL-specific CD4+ T cells harvested from 3A9 mice or HEL-specific 3A9 T cell line in the presence or absence of HEL (1μg/ml) for 24h. Fluorescence of Mitotracker Green (a,b), MitoSOX (c,d) and Fluo-4FF AM (e,f) were measured by flow cytometry Representative flow cytometry plots (a,c,e) and fold change in MFI (b,d,f) are shown. Data was pooled from two independent experiments. Each circle represents a sample and bars indicate the means. g-i) Purified B cells were cultured for 24 h in vitro in media alone or media containing combinations of anti-IgM (5μg/ml), CpG (1 μM) and CD40L (1μg/ml), harvested and analyzed by flow cytometry for MitoTracker Green staining shown in representative plots (g). Bar graphs show changes in MitoTracker Green MFI (h) and B cell viability (i) for each condition. MFI values that are significantly different compared to the unstimulated controls are indicated by asterisks. Data are from more than three independent experiments each carried out with at least three replicates per condition. Bars indicate mean. (0.001 <P ≤0.01 = **; P ≤0.0001= ****) (One way ANOVA with Tukey’s adjustment).
Figure 8
Figure 8
Antigen-induced mitochondrial dysfunction results from increases in intracellular calcium. a) B cells were cultured in media containing CpG (1 μM) and/or anti-IgM (5 μg/ml) for 4h, harvested and the expression levels of mRNAs encoding oxidants and anti-oxidants were measured using qPCR. The heatmap shows the log2 scale change in the expression of genes in stimulated B cells relative to unstimulated cells. Data represent two independent experiments. b) B cells were cultured in media containing CpG and/or anti-IgM for 24 h. Live cells were FACS sorted after Live/Dead staining and SOD-2 activity was measured in cell lysates using a colorimetric assay. Bars represent mean values. Data represent two independent experiments. c) B cells were cultured in media containing anti-IgM (5 μg/ml) in the presence of the compounds indicated for 24 h. Cells were harvested and analyzed in flow cytometry for MitoTracker Green staining. MFI values for each condition are shown. Bars represent mean. Representative of three independent experiments each of which contained three replicates shown with symbols per condition. d-g) B cells were incubated in vitro in media alone or in media containing CpG (1 μM) and/or anti-IgM (5 μg/ml). BAPTA AM (5 μM) was added to culture either 8 h or 16 h after the initiation of culture. Cells were harvested at 24 h and stained with MitoTracker Green (d,e) or MitoSOX (f,g) and for each, representative flow cytometry plots and bar graphs demonstrating the change in staining levels between conditions are shown. Data represent three independent experiments each carried out with three replicates. h-j) B cells were cultured in media or media containing anti-IgM (5 μg/ml) in the presence or absence of SKF96365 (20 μM) or YM58483 (20 μM) for 24h. Levels of Calcium Green 5N AM (h), MitoTracker Green (i), and MitoSOX (j) staining are shown. Bars represent means. Data are representative of more than three independent experiments each carried out with three replicates per condition. k) Purified mouse splenic B cells were cultured in the presence or absence of anti-IgM (5 μg/ml). YM58483 (20 μM) was added to samples at either 0 or 8 h post stimulation. Samples were stained for MitoSOX, Fluo-4FF AM and MitoTracker Green at 24 h post stimulation and bar graphs show the fold change in MFI of these stains. Each circle represents an individual sample and bars show the mean values. (P>0.05 = n.s.; 0.01 <P ≤0.05 = *;0.001 <P ≤0.01 = **; 0.0001 <P ≤0.001 = ***; P ≤0.0001= ****) (Panels b,e,g,k: one way Anova with Tukey’s adjustment; Panels h-j:Welch’s t-test for pair-wise comparisons and one way Anova with Tukey’s adjustment for multiple comparisons.).

Comment in

References

    1. Scharenberg AM, Humphries LA, Rawlings DJ. Calcium signalling and cell-fate choice in B cells. Nat Rev Immunol. 2007;7:778–789. doi: 10.1038/nri2172. - DOI - PMC - PubMed
    1. De Silva NS, Klein U. Dynamics of B cells in germinal centres. Nat Rev Immunol. 2015;15:137–148. doi: 10.1038/nri3804. - DOI - PMC - PubMed
    1. Yuseff MI, Pierobon P, Reversat A, Lennon-Dumenil AM. How B cells capture, process and present antigens: a crucial role for cell polarity. Nat Rev Immunol. 2013;13:475–486. doi: 10.1038/nri3469. - DOI - PubMed
    1. Roche PA, Furuta K. The ins and outs of MHC class II-mediated antigen processing and presentation. Nat Rev Immunol. 2015;15:203–216. doi: 10.1038/nri3818. - DOI - PMC - PubMed
    1. Elgueta R, et al. Molecular mechanism and function of CD40/CD40L engagement in the immune system. Immunol Rev. 2009;229:152–172. doi: 10.1111/j.1600-065X.2009.00782.x. - DOI - PMC - PubMed

Publication types

MeSH terms