. 2018 Aug;19(8):838-848.
doi: 10.1038/s41590-018-0157-4. Epub 2018 Jul 9.

Maintenance of CD4 T cell fitness through regulation of Foxo1

Affiliations

Maintenance of CD4 T cell fitness through regulation of Foxo1

Ryan H Newton et al. Nat Immunol. 2018 Aug.

Abstract

Foxo transcription factors play an essential role in regulating specialized lymphocyte functions and in maintaining T cell quiescence. Here, we used a system in which Foxo1 transcription-factor activity, which is normally terminated upon cell activation, cannot be silenced, and we show that enforcing Foxo1 activity disrupts homeostasis of CD4 conventional and regulatory T cells. Despite limiting cell metabolism, continued Foxo1 activity is associated with increased activation of the kinase Akt and a cell-intrinsic proliferative advantage; however, survival and cell division are decreased in a competitive setting or growth-factor-limiting conditions. Via control of expression of the transcription factor Myc and the IL-2 receptor β-chain, termination of Foxo1 signaling couples the increase in cellular cholesterol to biomass accumulation after activation, thereby facilitating immunological synapse formation and mTORC1 activity. These data reveal that Foxo1 regulates the integration of metabolic and mitogenic signals essential for T cell competitive fitness and the coordination of cell growth with cell division.


Conflict of interest statement

Competing interests

The authors declare no competing interests.

Figures

Fig. 1 |
Fig. 1 |. Autoimmunity in mice with T cell–specific dysregulation of Foxo1 activity.
a, Representative images of 8-week-old CD4Cre Foxo1AAA/+ (AAA) and CD4Cre Foxo1+/+ (WT) littermates, seen consistently in a large cohort (> 20 mice). Right, spleen and lymph nodes. Quantification in Supplementary Fig. 1a,b. b, Flow cytometric analysis of lymph node cells from 8-week-old WT and AAA littermates (left) and quantification of numbers of CD4+ and CD8+ T cells from lymph nodes of 4- to 8-week-old mice (n = 12 mice). c, Flow cytometric analysis of CD4+ T cells from lymph nodes from 6-week-old WT and AAA littermates (left) and quantification of frequencies and numbers of Foxp3+CD4+ Treg cells from 4- to 8-week-old mice (n = 11 mice). d, Hematoxylin and eosin staining of liver, lung and ear skin (original magnification, 10×) in bone marrow chimeras 10 weeks post-transfer. Rag1–/– recipients were sublethally irradiated before receiving bone marrow cells from WT donors (CD45.1+) and/or CD4Cre Foxo1AAA/+ (AAA) donors (CD45.2+). For mixed chimeras (WT + AAA), equal proportions of bone marrow cells were cotransferred. Results are representative of three independent experiments with similar results. e, Flow cytometric analysis of CD4+ T cells from the blood of bone marrow chimeras 10 weeks post-transfer (left) and quantification of the proportions of CD4+ naïve (CD44loCD62Lhi), central memory (CM; CD44hiCD62Lhi) and effector memory (EM; CD44hiCD62Llo) cells from the blood of bone marrow chimeras 10 weeks post-transfer (right; WT, n = 2 mice; AAA, n = 5; WT + AAA chimeras, n = 5). f, Flow cytometric analysis of CD4+ and CD8+ T cells from the blood of bone marrow chimeras 10 weeks post-transfer (left) and quantification of the proportions of CD4+ and CD8+ T cells from the spleen 12 to 15 weeks post-transfer (right; n = 4 mice). g, Flow cytometric analysis of CD4+ T cells from the blood of bone marrow chimeras 10 weeks post-transfer (left) and quantification of the proportion of Foxp3+CD4+ Treg cells from the blood 10 weeks post-transfer (right; n = 5 mice). For b, c and eh, quantification involved a two-tailed Student’s t test with no adjustments made for multiple comparisons; center value, mean; error bars, s.d.; **P < 0.005; ***P < 0.0005; ****P < 0.0001; NS, not significant. h,i, Volcano plots showing differential expression in CD4+ AAA (GFP+CD45.2+) versus WT (GFPCD45.1+) CD62LhiCD44lo (quiescent) populations from spleens of mixed bone marrow chimeras (h), and CD4+ AAA (GFP+CD45.2+) CD62LloCD44hi (activated) cells from single chimeras that received only AAA bone marrow versus CD4+ AAA (GFP+CD45.2+) CD62LhiCD44lo (quiescent) cells from mixed chimeras (i). Genes represented in blue and red have a log2 fold change of <−1, and > 1, respectively, and an adjusted P value < 0.05. One data point in h (Ctse; log2 fold change, −5.19; −log10 adjusted P value, 121.5) is outside the axis limits to depict the dataset more clearly. j,k, Gene-set enrichment analysis showing underrepresentation of genes involved in Myc signaling and ribosome biogenesis (j) and cholesterol biosynthesis (k), in activated versus quiescent AAA CD4 T cells, as in i above. The heat map on the right (in k) displays the row minimum and maximum values of expression for the entire reactome cholesterol-biosynthesis annotated gene set. The log10 Benjamini–Hochberg-adjusted P values were used, corrected for the direction of fold change, to rank genes. For any adjusted P-value cutoff, Benjamini–Hochberg correction was used. FDR, false discovery rate.
Fig. 2 |
Fig. 2 |. Foxo1 dysregulation uncouples cell growth and proliferation.
ac, Flow cytometric analysis of CellTrace Violet dilutions of GFP (WT) and GFP+ (AAA) CD4+ T cells from CD4Cre–ERT2 Foxo1AAA/+ (iAAA) mice after 3 d in culture with plate-bound anti-CD3 and soluble anti-CD28. Tamoxifen was administered to CD4Cre–ERT2 Foxo1AAA/+ mice for four to five consecutive days starting from day 0, and spleens and lymph nodes were harvested at days 7 or 8. a, CD4+ gate of whole splenocytes (n = 5 mice). No sorting was performed on cells harvested from tamoxifen-treated mice before plating. b,c, Harvested lymphocytes were sorted to obtain both GFP and GFP+ naïve cells (CD4+CD25CD44loCD62Lhi). For isolated cultures (isocultures; b, n = 8), each population was plated in separate wells for the duration of the experiment in vitro, and cocultures (c, n = 6) combined GFP and GFP+ populations at a 5:1 ratio. d, Flow cytometric analysis of 4-d cultures, activated as in b, with gating on all generations to compare differences in cell size, as measured by forward-scatter area (FSA), and quantification of FSA, depicting GFP+ mean FSA as a percentage of mean FSA in control GFP cells for each given day (day 0, n = 6; day 1, n = 4; day 2, n = 6; days 3 and 4, n = 10). e, Persistence of AAA+ cells in vivo after tamoxifen treatment. Tamoxifen was administered to both CD4Cre–ERT2 Foxo1AAA/+ (iAAA; n = 3 mice) and CD4Cre–ERT2 Rosa26YFP/+ (iYFP; n = 6 mice) control mice for five consecutive days, and the percentage of GFP+ cells (from iAAA mice) and YFP+ cells (from iYFP mice) was followed in the blood for 11 weeks. All mice were 20–22 weeks old before tamoxifen administration to minimize dilution of induced populations via strong thymic output. f, After administration of tamoxifen to mice (8–12 weeks old) as in e, bromodeoxyuridine (BrdU) was injected every 12 h for three consecutive days, beginning 2 weeks post-tamoxifen. Spleens were harvested, and CD4+ BrdU+ cells (shown in histograms) were analyzed for cell size according to FSA (n = 6). For all graphs, quantification involved a two-tailed Student’s t test with no adjustments made for multiple comparisons; center value, mean, error bars, s.d. *P < 0.05; **P < 0.005; ***P < 0.0005; ****P < 0.0001.
Fig. 3 |
Fig. 3 |. Maintained Foxo1 activity limits CD4 T cell metabolism and results in a failure to sustain Myc expression.
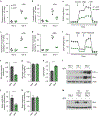
ad, Growth-medium analysis of glucose consumption (a), lactate production (b), glutamine consumption (c) and glutamate production (d) from isocultures on days 2 (n = 4) and 3 (n = 3). ek, Quantification of ECAR (e), glycolytic capacity (f,g), OCR (i) and spare respiratory capacity (j,k) under basal conditions and in response to oligomycin (oligo), fluoro-carbonyl cyanide phenylhydrazone (FCCP), rotenone (Rot)/antimycin A (AntA), glucose and 2-deoxyglucose (2-DG) on day 3 of isocultures. Data are representative of two independent experiments with similar results. ECAR/OCR ratio (h) was determined with the glycolytic stress test, for which ECAR traces alone are shown as in e. For all graphs, quantification involved a two-tailed Student’s t test with no adjustments made for multiple comparisons; center value, mean; error bars, s.d. *P < 0.05; **P < 0.005; ***P < 0.0005; ****P < 0.0001. l, Immunoblot analysis of isocultures stimulated with plate-bound anti-CD3 and soluble anti-CD28. Data are representative of three independent experiments with similar results. m, Immunoblot analysis of iso- and cocultures stimulated as in l. Data are representative of two independent sorting experiments with similar results. After sorting, a proportion of GFP and GFP+ cells were immediately lysed (Day 0). After 3 d in culture, isolated cultures were lysed and probed, and cocultures were sorted once again for GFP and GFP+ populations, lysed and probed. β-actin was used as a loading control.
Fig. 4 |
Fig. 4 |. Foxo1 mediates downregulation of IL-2Rβ and decreases STAT5 activation.
ac, Flow cytometric analysis of GFP and GFP isocultures stimulated for 0, 1 and 2 d with anti-CD3/28 (ac, n = 7). MFI, mean fluorescence intensity. d, Flow cytometric analysis of GFP and GFP+ iso- and cocultures stimulated for 1 d (representative flow plots shown, isocultures; n = 4) and 2 d (n = 5) with anti-CD3/28. Blue contours indicate isotype staining. e, Isocultures were labeled with CellTrace Violet and stimulated as in a, with the additional condition that on day 2, 30 ng/ml anti-IL-2 blocking antibody (diluted in medium) or the equivalent volume of medium alone, was added to isolated cultures, followed by 80 ng/ml anti-IL-2 on day 3. Cells were stained for 7AAD and analyzed by flow cytometry on day 4 (n = 4 cultures). Quantification for the proportion of 7AAD+ cells on day 4 is shown on the right. For all graphs, quantification involved a two-tailed Student’s t test with no adjustments made for multiple comparisons; center value, mean; error bars, s.d. *P < 0.05; **P < 0.005; ***P < 0.0005; ****P < 0.0001; NS, not significant.
Fig. 5 |
Fig. 5 |. Maintained Foxo1 activity suppresses activation-induced increases in cell size and cholesterol content.
a, Flow cytometric analysis of Filipin staining of isolated cultures stimulated with anti-CD3/28 (n = 4). b, Representative confocal images of Filipin staining on day 2 of cocultures stimulated as in a. Data are representative of three independent experiments with similar results. Scale bar, 10 μM. ce, Expression of constitutively-active STAT5b (caSTAT5b) in isolated cultures. GFP and GFP+ cells were activated for 24 h before transduction with retrovirus encoding Thy1.1 (MSCV-IRES-Thy1.1; MIT) or Thy1.1 plus caSTAT5b (MIT-caSTAT5b). Flow plots are gated on Thy1.1+ transduced cells 48 h post-transduction (c, n = 7; d, n = 9; e, n = 7). fh, Myc overexpression in isolated cultures. GFP and GFP+ cells were activated for 24 h before transduction with retrovirus encoding RFP (MSCV-IRES-RFP; MIR) or RFP plus c-Myc (MIR-Myc). Flow plots are gated on RFP+-transduced cells 48 h post-transduction. Analysis of Filipin staining was subsequent to sorting RFP+ populations (f, n = 3; g, n = 6; h, n = 4). For all graphs, quantification involved a two-tailed Student’s t test with no adjustments made for multiple comparisons; center value, mean; error bars, s.d. *P < 0.05; **P < 0.005; ***P < 0.0005; NS, not significant.
Fig. 6 |
Fig. 6 |. Cholesterol-dependent immunological synapse formation is disrupted by maintained Foxo1 activity.
a, Representative total internal reflection fluorescence microscope images of mouse CD4 T cells expressing wild-type or constitutively active Foxo1 with or without water-soluble cholesterol supplementation, interacting with SLBs containing fluorescent ICAM-1 and CD80, and anti-TCR 2C11. SLB-bound T cell surface was visualized by interference reflection microscopy (IRM). Data are representative of three independent experiments with similar results. Scale bar, 5 μM. b, Quantification of immunological synapse formation by T cells, as a percentage of all SLB-bound T cells per experiment. Successful formation was defined by the appearance of a highly dense 2C11 area excluding ICAM-1 at the site of SLB interaction (wild type, n = 6 cultures; AAA, n = 6; AAA + cholesterol (chol.), n = 3). ce, Quantification of TCR and LFA-1 recruitment, as determined by integrated density (int. dens.) of 2C11 and ICAM-1, respectively. IRM was used to determine T cell spreading, and area was used as a mask for quantification of integrated fluorescence density. K denotes thousands. f, Cellular levels of cholesterol, determined by Filipin staining. Graphs indicate percentage or mean ± s.e.m. One-way analysis of variance was performed on all datasets and indicated P < 0.0001 for each. P values were determined with the Mann–Whitney two-tailed t test to directly compare two individual groups. ****P < 0.0001; NS, not significant.
Fig. 7 |
Fig. 7 |. Foxo1 activity simultaneously increases Akt and suppresses mTORC1 activation.
a, Immunoblot analysis of isocultures stimulated for 1 or 2 d with plate-bound anti-CD3 and soluble anti-CD28. After sorting, a proportion of GFP and GFP+ cells were immediately lysed (day 0). Quantification is for expression on day 2 (normalized to β-actin; p-S6, n = 9 cultures; p-4E-BP1, n = 13, p-mTOR, n = 10). b, Flow cytometric analysis of p-Akt Ser473 staining on iso- and cocultures on days 1, 2 and 3 post-activation with plate-bound anti-CD3 and soluble anti-CD28. Open histograms are GFP and GFP+ populations as indicated; lightly shaded histograms show isotype-control staining for each population. Data are representative of three independent experiments with similar results. c, Flow cytometric analysis of splenocytes from 8-week-old CD4Cre (WT), CD4Cre Foxo1AAA/+ (AAA), CD4Cre Rictorfl/fl (Rictor KO) and CD4Cre Rictorfl/fl Foxo1AAA/+ (AAA × Rictor KO) littermates. Data are representative of similar results for n = 4 mice. d, Flow cytometric analysis of CD4+ T cells from the same mice as in c. e, Flow cytometric analysis of p-Akt Ser473 measured in CD4+ T cells directly ex vivo (fresh; n = 4 mice for all except AAA × Rictor KO, where n = 5), and after 16 h in culture with plate-bound anti-CD3 and soluble anti-CD28 (16-h stimulation (stim); n = 2, except for AAA × Rictor KO, n = 3). For all graphs, quantification involved a two-tailed Student’s t test with no adjustments made for multiple comparisons; center value, mean; error bars, s.d. *P < 0.05; **P < 0.005; ***P < 0.0005; NS, not significant.
Fig. 8 |
Fig. 8 |. Impaired lysosomal biogenesis and endocytosis of IL-2Rβ upon maintaining Foxo1 activity.
a, Immunoblot analysis of isocultures stimulated for 1 or 2 d with plate-bound anti-CD3 and soluble anti-CD28. After sorting, a proportion of GFP and GFP+ cells were immediately lysed (day 0). Data are representative of four independent experiments with similar results. β-actin was used as a loading control. b, Flow cytometric analysis and quantification of isocultures stimulated for 1 or 2 d with plate-bound anti-CD3 and soluble anti-CD28 with vehicle (Veh) or Dynasore (Dyna; 80 and 140 mM, Dyna80 and Dyna140, respectively; n = 5). Representative plots are of day 1 post-activation with 140 mM Dynasore. Quantification involved a two-tailed Student’s t-test with no adjustments made for multiple comparisons; center value, mean; error bars, s.d. *P < 0.05; ****P < 0.0005; NS, not significant. c, Representative immunofluorescence images of mTOR (n = 3 independent experiments with similar results), Lamp-1 and DAPI nuclear staining on day 2 of isocultures stimulated as in a. Scale bar, 10 μM.

References

    1. Manning BD & Toker A AKT/PKB signaling: navigating the network. Cell 169, 381–405 (2017). - PMC - PubMed
    1. Liao W, Lin JX & Leonard WJ Interleukin-2 at the crossroads of effector responses, tolerance, and immunotherapy. Immunity 38, 13–25 (2013). - PMC - PubMed
    1. Smith-Garvin JE, Koretzky GA & Jordan MS T cell activation. Annu. Rev. Immunol 27, 591–619 (2009). - PMC - PubMed
    1. Kerdiles YM et al. Foxo1 links homing and survival of naive T cells by regulating L-selectin, CCR7 and interleukin 7 receptor. Nat. Immunol 10, 176–184 (2009). - PMC - PubMed
    1. Ouyang W, Beckett O, Flavell RA & Li MO An essential role of the Forkhead-box transcription factor Foxo1 in control of T cell homeostasis and tolerance. Immunity 30, 358–371 (2009). - PMC - PubMed

Publication types

MeSH terms

Substances