. 2018 Jul;13(7):1632-1661.
doi: 10.1038/s41596-018-0006-9.

Reproducible workflow for multiplexed deep-scale proteome and phosphoproteome analysis of tumor tissues by liquid chromatography-mass spectrometry

Affiliations

Reproducible workflow for multiplexed deep-scale proteome and phosphoproteome analysis of tumor tissues by liquid chromatography-mass spectrometry

Philipp Mertins et al. Nat Protoc. 2018 Jul.

Abstract

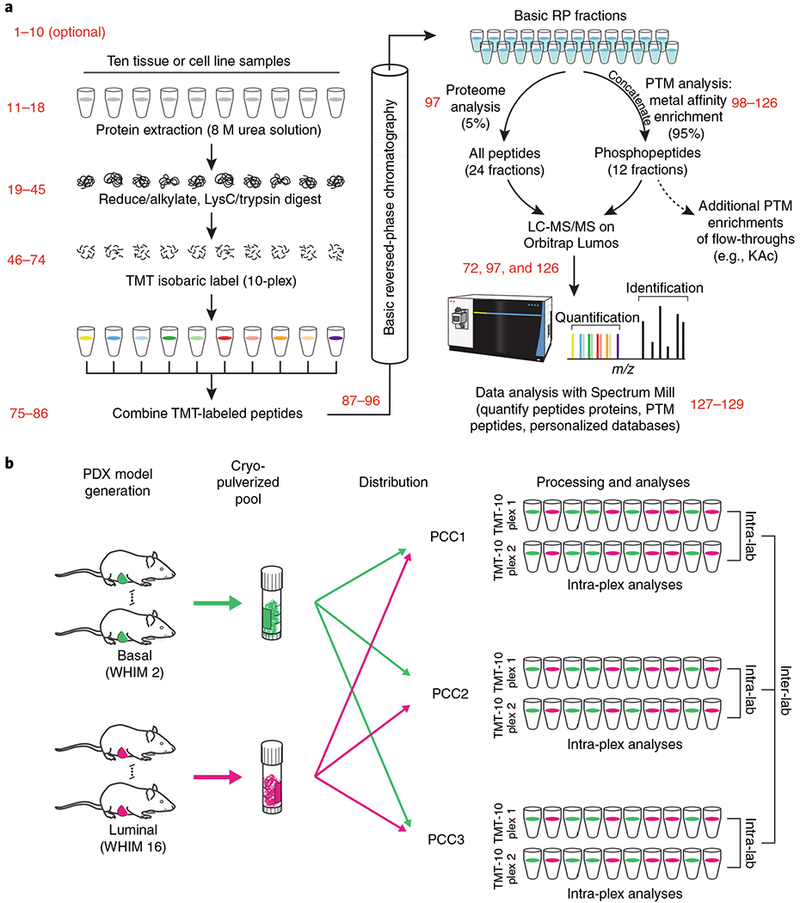
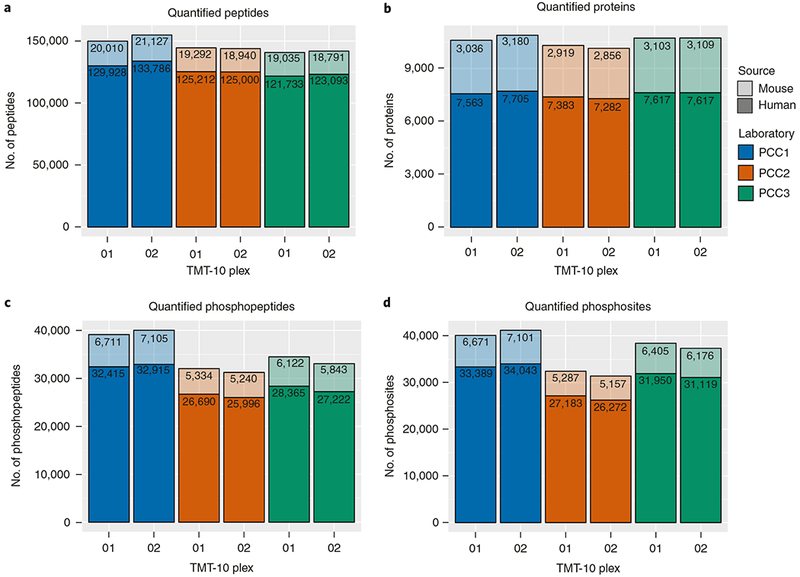
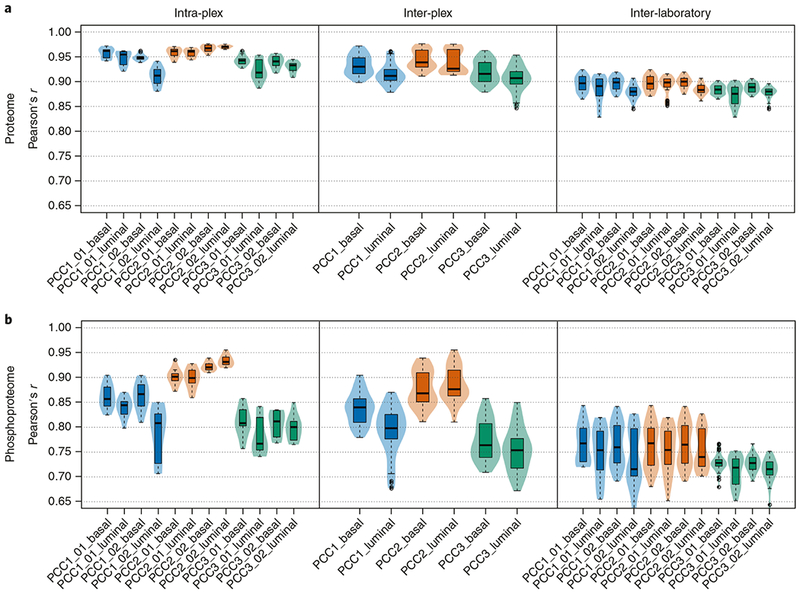
Here we present an optimized workflow for global proteome and phosphoproteome analysis of tissues or cell lines that uses isobaric tags (TMT (tandem mass tags)-10) for multiplexed analysis and relative quantification, and provides 3× higher throughput than iTRAQ (isobaric tags for absolute and relative quantification)-4-based methods with high intra- and inter-laboratory reproducibility. The workflow was systematically characterized and benchmarked across three independent laboratories using two distinct breast cancer subtypes from patient-derived xenograft models to enable assessment of proteome and phosphoproteome depth and quantitative reproducibility. Each plex consisted of ten samples, each being 300 μg of peptide derived from <50 mg of wet-weight tissue. Of the 10,000 proteins quantified per sample, we could distinguish 7,700 human proteins derived from tumor cells and 3100 mouse proteins derived from the surrounding stroma and blood. The maximum deviation across replicates and laboratories was <7%, and the inter-laboratory correlation for TMT ratio-based comparison of the two breast cancer subtypes was r > 0.88. The maximum deviation for the phosphoproteome coverage was <24% across laboratories, with an average of >37,000 quantified phosphosites per sample and differential quantification correlations of r > 0.72. The full procedure, including sample processing and data generation, can be completed within 10 d for ten tissue samples, and 100 samples can be analyzed in ~4 months using a single LC-MS/MS instrument. The high quality, depth, and reproducibility of the data obtained both within and across laboratories should enable new biological insights to be obtained from mass spectrometry-based proteomics analyses of cells and tissues together with proteogenomic data integration.


Conflict of interest statement

Competing interests

The authors declare no competing interests.

Figures

Fig. 1 |
Fig. 1 |. Optimized workflow and experimental design of global proteome and phosphoproteome analysis in tissues using TMT.
a, Multiple aspects of sample handling were optimized based on a preexisting workflow for global proteome and phosphoproteome analysis (Mertins et al.). Some of the conditions tested relative to the preexisting workflow were (i) digestion at higher protein concentrations, which effectively increases the enzyme concentration during digestion, resulting in lower missed cleavage rates; (ii) reconstitution of lysyl endopeptidase in water, instead of 50 mM acetic acid, which better maintains the activity of the enzyme; (iii) quantification of peptides by BCA before isobaric labeling, which yields more accurate input amounts than BCA at the protein level; (iv) offline basic RP fractionation using either Agilent or Waters columns, which yield equivalent results; and (v) optimization of HCD energy for each individual instrument, rather than the use of a common collision energy, which improved spectral quality. The relevant steps of the Procedure are indicated in red. b, Multiple mice of basal (WHIM 2) and luminal (WHIM16) subtypes were grown, and the tumors of each subtype were pooled together. Tumors of each subtype from multiple mice were cryofractured and aliquots of the homogenized powders were distributed to the three different laboratories for global proteome and phosphoproteome analysis. Each laboratory analyzed 2× TMT-10 plexes. Intra-plex, intra-lab, and inter-lab comparisons were conducted to test depth of coverage and reproducibility. PCC1–3 indicate Protein Characterization Centers 1 (Broad Institute), 2 (Johns Hopkins University), and 3 (Pacific Northwest National Laboratory), respectively. BCA, bicinchoninic acid; HCD, higher-energy collision dissociation. a Adapted from Extended Data Fig. 1 in ref. , Springer Nature.
Fig. 2 |
Fig. 2 |. Deep and reproducible coverage of tumor tissue proteomes and phosphoproteomes across three laboratories.
a-d, Bar charts depicting the number of quantified distinct peptide sequences (a) and proteins (b) identified in basic RP fractions of proteome measurements, and the number of distinct phosphorylated peptides (c) and individual phosphorylation sites (d) quantified in the metal-affinity enriched fractions. Solid-colored bars represent the proportion of human features and shaded bars represent the proportion of mouse-specific features. Numbers inside the bars represent the numbers of quantified human and mouse features, respectively. PDX models used in this study were approved by the institutional animal care and use committee at Washington University in St. Louis.
Fig. 3 |
Fig. 3 |. Assessment of the variability of TMT quantitation.
Our experimental design enables the assessment of intra-plex, inter-plex, and inter-laboratory variation of TMT quantitation. Pearson correlation coefficients between replicate measurements were calculated and visualized in box-and-whiskers plots. a, Correlations calculated from proteome measurements comparing intra-plex replicates (left), inter-plex replicates (middle), and inter-laboratory replicates (right). b, Correlations of quantified phosphorylation sites. PDX models used in this study were approved by the institutional animal care and use committee at Washington University in St. Louis.
Fig. 4 |
Fig. 4 |. Breast cancer subtype-specific protein and phosphorylation site expression identified by three laboratories.
Differences in the expression of proteins and phosphorylation sites between luminal and basal tumor subtypes were determined by a two-sample moderated t test at a 1% FDR. The results of the analysis are illustrated as ‘UpSet’ plots. Horizontal bars indicate total number of features detected by each laboratory; vertical bars depict the number of jointly detected features, as indicated by the layout matrix below. a,b, Comparison of proteins (a) and phosphorylation sites (b) highly expressed in the basal subtype. c,d, Comparison of proteins (c) and phosphorylation sites (d) highly expressed in the luminal subtype. Approximately two-thirds of the phosphosites that were quantified as differentially expressed by a single laboratory were also only detected by a single laboratory. PDX models used in this study were approved by the institutional animal care and use committee at Washington University in St. Louis.

References

    1. Zhang B et al. Proteogenomic characterization of human colon and rectal cancer. Nature 513, 382–387 (2014). - PMC - PubMed
    1. Mertins P et al. Proteogenomics connects somatic mutations to signaling in breast cancer. Nature 534, 55–62 (2016). - PMC - PubMed
    1. Zhang H et al. Integrated proteogenomic characterization of human high-grade serous ovarian cancer. Cell 166, 755–765 (2016). - PMC - PubMed
    1. Ntai I et al. Integrated bottom-up and top-down proteomics of patient-derived breast tumor xenografts. Mol. Cell. Proteomics 15, 45–56 (2016). - PMC - PubMed
    1. Geiger T, Wehner A, Schaab C, Cox J & Mann M Comparative proteomic analysis of eleven common cell lines reveals ubiquitous but varying expression of most proteins. Mol. Cell. Proteomics. 11, M111.014050 (2012). - PMC - PubMed

Publication types