Randomized Controlled Trial
. 2018 Aug;24(8):1108-1112.
doi: 10.1038/s41591-018-0089-4. Epub 2018 Jul 9.

Verapamil and beta cell function in adults with recent-onset type 1 diabetes

Affiliations
Randomized Controlled Trial

Verapamil and beta cell function in adults with recent-onset type 1 diabetes

Fernando Ovalle et al. Nat Med. 2018 Aug.

Abstract

Pancreatic beta cell loss is a key factor in the pathogenesis of type 1 diabetes (T1D), but therapies to halt this process are lacking. We previously reported that the approved antihypertensive calcium-channel blocker verapamil, by decreasing the expression of thioredoxin-interacting protein, promotes the survival of insulin-producing beta cells and reverses diabetes in mouse models1. To translate these findings into humans, we conducted a randomized double-blind placebo-controlled phase 2 clinical trial ( NCT02372253 ) to assess the efficacy and safety of oral verapamil added for 12 months to a standard insulin regimen in adult subjects with recent-onset T1D. Verapamil treatment, compared with placebo was well tolerated and associated with an improved mixed-meal-stimulated C-peptide area under the curve, a measure of endogenous beta cell function, at 3 and 12 months (prespecified primary endpoint), as well as with a lower increase in insulin requirements, fewer hypoglycemic events and on-target glycemic control (secondary endpoints). Thus, addition of once-daily oral verapamil may be a safe and effective novel approach to promote endogenous beta cell function and reduce insulin requirements and hypoglycemic episodes in adult individuals with recent-onset T1D.


Conflict of interest statement

COMPETING FINANCIAL INTERESTS STATEMENT

None of the authors have any interests to declare.

Figures

Figure 1
Figure 1
Screening, Randomization and Treatment. A schematic diagram illustrating the selection procedure for the enrolled individuals in the study. All participants had been diagnosed with T1D within the last 3 months and continued their standard insulin infusion therapy throughout the trial.
Figure 2
Figure 2
Verapamil Effects on Endogenous Beta cell Function. (a,b) Absolute values (a) and changes from individual baseline values (b) of the mixed meal-stimulated C-peptide area under the curve (AUC) at 0, 3 and 12 months of the trial in all subjects of the verapamil (n = 11) and placebo (n = 13) groups. Means and SE error bars of are shown. For a repeated measures ANOVA: F1,48=4.92, P = 0.0313; 3 months: two-sided Student’s t-test: t22 = −2.37, *P = 0.0270; (ANCOVA F1,23=5.19, P = 0.0334); 12 months: treatment difference 0.28 nmol/L, 95% CI 0.05 to 0.51, two-sided Student’s t-test: t22 =−2.54, *P = 0.0186; (ANCOVA F1,23=4.92, P = 0.0377). For b repeated measures ANOVA: F1,48=4.86, P = 0.0323; 3 months: two-sided Student’s t-test: t22=−2.08, *P = 0.0491; 12 months: treatment difference 35.4%, 95% CI 0.8 to 69.9, two-sided Student’s t-test: t22=−2.12, *P = 0.0451.
Figure 3
Figure 3
Verapamil Effects on Glycemic Control and Insulin Requirements. (a) Mean percent change in total daily dose of insulin (TDDI) during the trial in the verapamil (n = 10) and placebo (n = 13) groups. Error bars show SE. Repeated measures ANOVA: F1,89=4.37, P = 0.0395; 9 months: two-sided Student’s t-test: t16=2.41, *P = 0.0281; 12 months: treatment difference −43%, 95% CI −84 to −1, two-sided Student’s t -test: t17=2.34, *P = 0.0312. (b) Mean values for %HbA1c as measured at 0, 3, 6, 9, and 12 months in the verapamil (n = 11) and placebo (n = 13) groups. (c) Average number of hypoglycemic episodes of blood glucose ≤ 2.2 mmol/L per month in the verapamil (n = 11) as compared to the placebo (n = 11) group. Bars represent means, error bars show SE, dots indicate individual data points. Treatment difference −2.2 events/month, 95% CI −4.2 to −0.1, two-sided Student’s t-test: t20=−2.21, *P = 0.0387. (d) Percent time spent at the target blood glucose range of 3.9–10 mmol/L (grey), above 10 mmol/L (black) or below 3.9 mmol/L (red) as assessed by continuous glucose monitoring in the verapamil (n = 10) and the placebo (n = 11) groups.
Figure 4
Figure 4
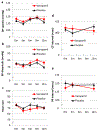
Blood Pressure and Heart Rate throughout the Trial. (a-e) Mean values for systolic (a) and diastolic (b) blood pressure (BP), heart rate (c) and EKG-measured QT (d) and PR (e) intervals observed in the verapamil (n = 11) and placebo (n = 13) groups during the 12 month trial. Error bars represent SE.

Comment in

References

    1. Xu G, Chen J, Jing G & Shalev A Preventing beta-Cell Loss and Diabetes With Calcium Channel Blockers. Diabetes 61, 848–856 (2012). - PMC - PubMed
    1. Davis AK, et al. Prevalence of detectable C-Peptide according to age at diagnosis and duration of type 1 diabetes. Diabetes Care 38, 476–481 (2015). - PubMed
    1. Liu EH, et al. Pancreatic beta cell function persists in many patients with chronic type 1 diabetes, but is not dramatically improved by prolonged immunosuppression and euglycaemia from a beta cell allograft. Diabetologia 52, 1369–1380 (2009). - PMC - PubMed
    1. Effect of intensive therapy on residual beta-cell function in patients with type 1 diabetes in the diabetes control and complications trial. A randomized, controlled trial. The Diabetes Control and Complications Trial Research Group. Ann Intern Med 128, 517–523 (1998). - PubMed
    1. Shalev A, et al. Oligonucleotide microarray analysis of intact human pancreatic islets: identification of glucose-responsive genes and a highly regulated TGFbeta signaling pathway. Endocrinology 143, 3695–3698 (2002). - PubMed

METHODS-ONLY REFERENCES

    1. Greenbaum CJ, et al. Mixed-meal tolerance test versus glucagon stimulation test for the assessment of beta-cell function in therapeutic trials in type 1 diabetes. Diabetes Care 31, 1966–1971 (2008). - PMC - PubMed
    1. Palmer JP, et al. C-peptide is the appropriate outcome measure for type 1 diabetes clinical trials to preserve beta-cell function: report of an ADA workshop, 21–22 October 2001. Diabetes 53, 250–264 (2004). - PubMed
    1. Lachin JM, et al. Sample size requirements for studies of treatment effects on beta-cell function in newly diagnosed type 1 diabetes. PLoS One 6, e26471 (2011). - PMC - PubMed
    1. Moore CG, Carter RE, Nietert PJ & Stewart PW Recommendations for planning pilot studies in clinical and translational research. Clinical and translational science 4, 332–337 (2011). - PMC - PubMed
    1. Li P, Stuart EA & Allison DB Multiple Imputation: A Flexible Tool for Handling Missing Data. JAMA 314, 1966–1967 (2015). - PMC - PubMed

Publication types

MeSH terms