Clinical Trial
. 2018 Jul;24(7):1015-1023.
doi: 10.1038/s41591-018-0081-z. Epub 2018 Jul 9.

Somatic mutations precede acute myeloid leukemia years before diagnosis

Affiliations
Clinical Trial

Somatic mutations precede acute myeloid leukemia years before diagnosis

Pinkal Desai et al. Nat Med. 2018 Jul.

Abstract

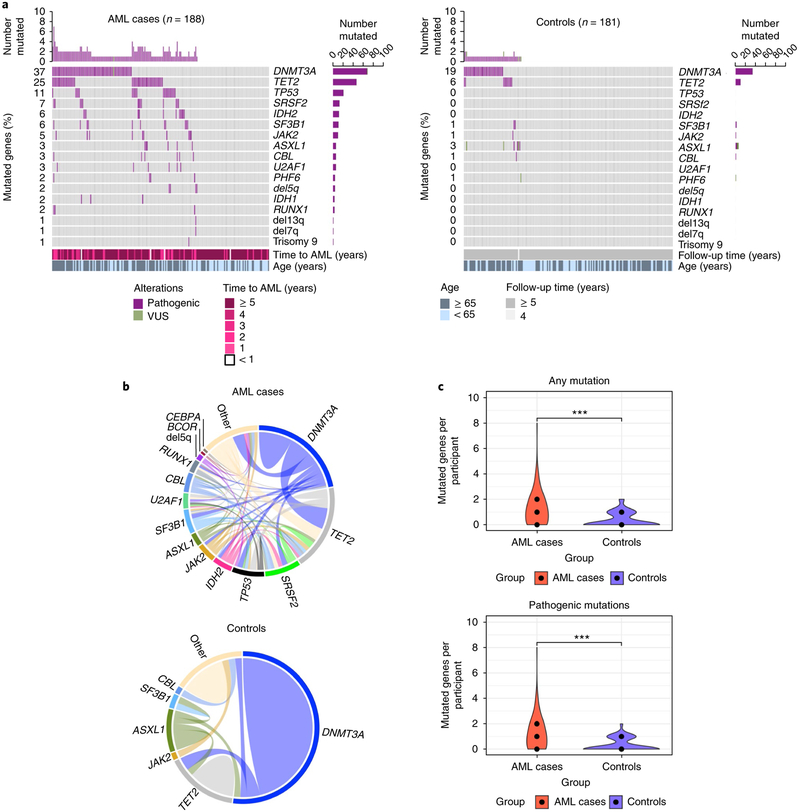
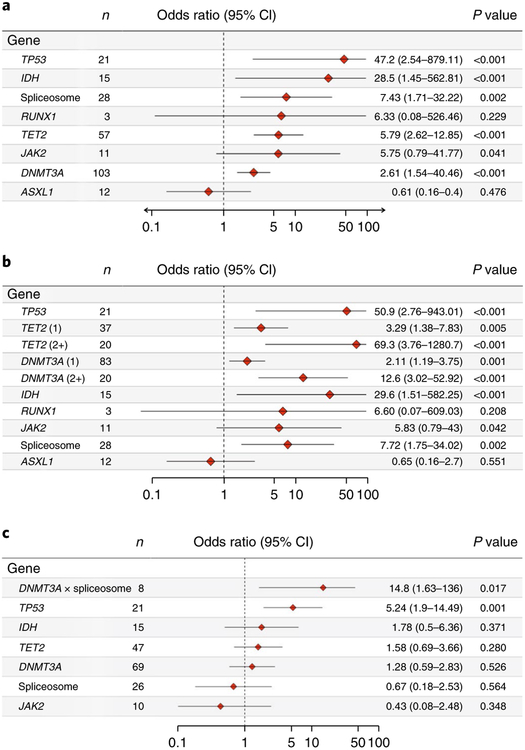
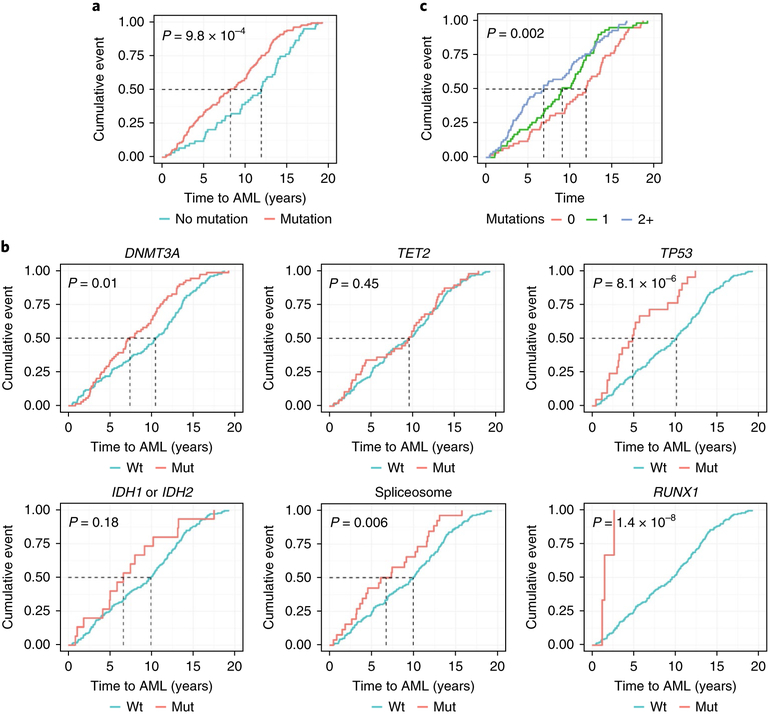
The pattern of somatic mutations observed at diagnosis of acute myeloid leukemia (AML) has been well-characterized. However, the premalignant mutational landscape of AML and its impact on risk and time to diagnosis is unknown. Here we identified 212 women from the Women's Health Initiative who were healthy at study baseline, but eventually developed AML during follow-up (median time: 9.6 years). Deep sequencing was performed on peripheral blood DNA of these cases and compared to age-matched controls that did not develop AML. We discovered that mutations in IDH1, IDH2, TP53, DNMT3A, TET2 and spliceosome genes significantly increased the odds of developing AML. All subjects with TP53 mutations (n = 21 out of 21 patients) and IDH1 and IDH2 (n = 15 out of 15 patients) mutations eventually developed AML in our study. The presence of detectable mutations years before diagnosis suggests that there is a period of latency that precedes AML during which early detection, monitoring and interventional studies should be considered.


Conflict of interest statement

Competing interests

The authors declares no competing interests.

Figures

Fig. 1 |
Fig. 1 |. Spectrum of mutations seen at baseline years prior to the diagnosis of AML alongside matched controls.
a, Mutated genes in cases with AML (n = 188; left) compared to controls (n = 181; right). For each gene (rows), pathogenic mutations (purple) and variants of unknown significance (VUS; green) are indicated. Side bar plots indicate the number of participants in whom the gene is mutated in each group. Top bar plots indicate the number of mutated genes per participant. In cases with AML, time to AML and age are shown. For controls, the time of follow-up and age are shown. b, Comutations between genes in cases with AML (n = 129) and controls (n = 56). ‘Other’ indicates other genes. c, Violin plot indicating the number of mutated genes per participant in cases with AML (red) compared to controls (blue). Median number of mutated genes, first and third quantile are shown for each group (middle, lower and upper black dots, respectively). Left plot indicates the number of mutated genes per participant in cases with AML (median, 1; range, 0–8; n = 129 out 188 mutated) versus controls (median, 0; first quantile, 0; range 0–2; n = 56 out of 181 mutated) (P < 2.2 × 10⁻¹⁶, two-tailed Mann–Whitney U test). The right plot indicates the number of pathogenic mutations in cases with AML (median, 1; range, 0–8; n = 127 out of 188 mutated) versus controls (median, 0; first quantile, 0; range, 0–2; n = 53 out of 181 mutated). P < 2.2 × 10⁻¹⁶, two-tailed Mann–Whitney U test). ***P < 0.001, Mann–Whitney U test.
Fig. 2 |
Fig. 2 |. Multivariable analysis of the risk to develop AML associated with the presence of mutated genes.
a, Forest plot indicating the odds ratio of mutations in each gene occurring in the cases with AML compared to controls. Genes or gene categories significantly associated with AML include TP53 (P = 5.5 × 10⁻⁶), IDH (P = 3.0 × 10⁻⁴), spliceosome, TET2 (P = 2.4 × 10 −6) and DNMT3A (P = 3.4 × 10⁻⁴). b, Forest plot indicating odds ratio of mutations in each gene including number of mutations in DNMT3A and TET2 occurring in the cases with AML compared to controls when one mutation in each gene is present per participant (1) compared to two or more mutations in present in each gene per participant (2+). P < 0.001: TP53 (P = 3.2 × 10⁻⁶); TET2 (2) (P = 1.8 × 10 −7); DNMT3A (2) (P = 1.9 × 10⁻⁵) and IDH (P = 2.8 × 10⁻⁴). c, Mutations in TP53 and DNMT3A are significantly associated with rapid development of AML. Odds ratios per gene were adjusted by age (years) as a continuous variable. IDH category includes IDH1 and IDH2. The spliceosome category includes SRSF2, SF3B1 and U2AF1. Interaction between DNMT3A and spliceosome is indicated (DNMT3A × spliceosome). CI, confidence interval; N, number of affected cases. P values are shown for penalized likelihood multivariable logistic regression.
Fig. 3 |
Fig. 3 |. Time to AML diagnosis is influenced by mutation status.
Cumulative incidence of AML diagnoses (cumulative event; y axis) as a function of time (years to AML diagnosis) is shown. a, Participants include cases with AML only at baseline (n = 188) with any mutated gene (n = 129 out of 188) versus no mutations (n = 59 out of 188). b, Participants with mutations in genes associated with AML versus participants with no mutations in these genes (DNMT3A, n = 69 out of 188; TET2, n = 47 out of 188; TP53, n = 21 out of 188; IDH1 or IDH2, n = 15 out of 188; spliceosome, n = 26 out of 188) in addition to RUNX1 (n = 3 out of 188). Data on RUNX1 are provided because all participants with a RUNX1 (n = 3) mutation rapidly developed AML (< 2 years) although significance was not achieved due to the few participants who had mutations in RUNX1 within the cohort. c, Cases with AML who had no mutated genes (n = 86 out of 188), one mutated gene (n = 56 out of 188), or two or more mutated genes (2+) (n = 46 out of 188) in significant high-risk genes associated with development of AML. Two-sided P values are shown for the log-rank test.
Fig. 4 |
Fig. 4 |. Mutations pose AML risk irrespective of the variant allele fraction.
a, Maximum allelic fraction for baseline mutations per gene: DNMT3A, n = 69 cases, 34 controls; TET2, n = 47 cases, 10 controls; TP53, n = 21 cases; SRSF2, n = 13 casees; IDH2, n = 12 cases; JAK2, n = 10 cases, 1 control; SF3B1, n = 11 cases, 2 controls; U2AF1, n = 6 cases; IDH1, n = 3 cases; RUNX1, n = 3 cases. Proportion of cases with AML (red) and controls (blue) is shown in each bin (width, 2.5%). b, Receiver operating characteristic curves indicating the percentage of true-positive rates compared to the percentage of false-positive rates for detecting cases with AML. Performance is shown for mutations in any gene significantly associated with cases with AML (left; DNMT3A, TET2, IDH1, IDH2, SRSF2, SF3B1, U2AF1, TP53; n = 164 (118 cases with AML, 44 controls)) or the same set of genes excluding DNMT3A; n = 94 (81 cases with AML, 12 controls) (right). c, Annual rate of VAF change per year influences kinetics of AML diagnosis for TP53 (n = 7) and IDH2 (n = 8). Time to AML (years) is plotted against fold change in VAF at year 1 or year 3 compared to baseline. Regression line is indicated. R2 and P values, linear regression. DNMT3A, n = 16; TET2, n = 13; SRSF2, n = 4; JAK2, n = 7; SF3B1, n = 5; U2AF1, n = 4.
Fig. 5 |
Fig. 5 |. Clonal evolution towards AML in selected patients.
Clonal composition and evolution are shown for four selected examples of participants who were evaluable serially (cases A, B, C and D). Peripheral blood was sampled at baseline and years 1 or 3. The x axis indicates time (years). The y axis indicates the VAF where the maximum possible VAF is 1 (100%). Mutated genes are shown at each time point as indicated on the line chart. Time of AML diagnosis (AML Dx) relative to baseline is indicated by the red vertical dotted line. a, Case A, an IDH2 mutation (8% VAF) is present at baseline at lower VAF and persists at year 1 at 13% VAF with an acquired NPM1 type-A mutation at 14% VAF. AML diagnosis occurs <30 days after the year 1 sample. b, Case B: a DNMT3A mutation remained stable from baseline to year 1 follow-up. VAFs of JAK2 and SF3B1 increased from 5% to 24% before AML diagnosis at 4.3 years after baseline. c, Case C: clonal expansion of TP53 from 3% to 21% with acquired SRSF2 and CUX1 mutations between baseline and year 3 follow-up. TET2 remains relatively stable. AML diagnosed at 4.4 years after baseline. d, Case D: low VAF mutations in IDH2 and TET1 expand by year 3 along with acquisition of SRSF2 in the presence of a relatively stable DNMT3A mutation. AML diagnosis occurs 6.6 years after baseline.

Comment in

  • Predicting progression to AML.
    Sellar RS, Jaiswal S, Ebert BL. Sellar RS, et al. Nat Med. 2018 Jul;24(7):904-906. doi: 10.1038/s41591-018-0114-7. Nat Med. 2018. PMID: 29988142 No abstract available.
  • Roots of AML Detectable Long before Symptoms.
    [No authors listed] [No authors listed] Cancer Discov. 2018 Sep;8(9):1056. doi: 10.1158/2159-8290.CD-NB2018-099. Epub 2018 Jul 23. Cancer Discov. 2018. PMID: 30037845
  • Early prediction of AML risk.
    Romero D. Romero D. Nat Rev Clin Oncol. 2018 Oct;15(10):590. doi: 10.1038/s41571-018-0078-z. Nat Rev Clin Oncol. 2018. PMID: 30050093 No abstract available.
  • How to predict the future.
    Dart A. Dart A. Nat Rev Cancer. 2018 Sep;18(9):529. doi: 10.1038/s41568-018-0046-z. Nat Rev Cancer. 2018. PMID: 30050149 No abstract available.
  • How to predict the future.
    Dart A. Dart A. Nat Rev Genet. 2018 Sep;19(9):531. doi: 10.1038/s41576-018-0041-y. Nat Rev Genet. 2018. PMID: 30054567 No abstract available.

References

    1. Mardis ER et al. Recurring mutations found by sequencing an acute myeloid leukemia genome. N. Engl. J. Med 361, 1058–1066 (2009). - PMC - PubMed
    1. Ley TJ et al. DNMT3A mutations in acute myeloid leukemia. N. Engl. J. Med 363, 2424–2433 (2010). - PMC - PubMed
    1. Ding L et al. Clonal evolution in relapsed acute myeloid leukaemia revealed by whole-genome sequencing. Nature 481, 506–510 (2012). - PMC - PubMed
    1. Genovese G et al. Clonal hematopoiesis and blood-cancer risk inferred from blood DNA sequence. N. Engl. J. Med 371, 2477–2487 (2014). - PMC - PubMed
    1. Jaiswal S et al. Age-related clonal hematopoiesis associated with adverse outcomes. N. Engl. J. Med 371, 2488–2498 (2014). - PMC - PubMed

Publication types