Needle in a haystack? A comparison of eDNA metabarcoding and targeted qPCR for detection of the great crested newt (Triturus cristatus)
- PMID: 29988445
- PMCID: PMC6024127
- DOI: 10.1002/ece3.4013
Needle in a haystack? A comparison of eDNA metabarcoding and targeted qPCR for detection of the great crested newt (Triturus cristatus)
Abstract
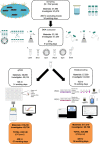
Environmental DNA (eDNA) analysis is a rapid, cost-effective, non-invasive biodiversity monitoring tool which utilises DNA left behind in the environment by organisms for species detection. The method is used as a species-specific survey tool for rare or invasive species across a broad range of ecosystems. Recently, eDNA and "metabarcoding" have been combined to describe whole communities rather than focusing on single target species. However, whether metabarcoding is as sensitive as targeted approaches for rare species detection remains to be evaluated. The great crested newt Triturus cristatus is a flagship pond species of international conservation concern and the first UK species to be routinely monitored using eDNA. We evaluate whether eDNA metabarcoding has comparable sensitivity to targeted real-time quantitative PCR (qPCR) for T. cristatus detection. Extracted eDNA samples (N = 532) were screened for T. cristatus by qPCR and analysed for all vertebrate species using high-throughput sequencing technology. With qPCR and a detection threshold of 1 of 12 positive qPCR replicates, newts were detected in 50% of ponds. Detection decreased to 32% when the threshold was increased to 4 of 12 positive qPCR replicates. With metabarcoding, newts were detected in 34% of ponds without a detection threshold, and in 28% of ponds when a threshold (0.028%) was applied. Therefore, qPCR provided greater detection than metabarcoding but metabarcoding detection with no threshold was equivalent to qPCR with a stringent detection threshold. The proportion of T. cristatus sequences in each sample was positively associated with the number of positive qPCR replicates (qPCR score) suggesting eDNA metabarcoding may be indicative of eDNA concentration. eDNA metabarcoding holds enormous potential for holistic biodiversity assessment and routine freshwater monitoring. We advocate this community approach to freshwater monitoring to guide management and conservation, whereby entire communities can be initially surveyed to best inform use of funding and time for species-specific surveys.
Keywords: Triturus cristatus; environmental DNA; great crested newt; high‐throughput sequencing; metabarcoding; ponds; real‐time quantitative PCR.
Figures


References
-
- Akaike, H. (1973). Maximum likelihood identification of Gaussian autoregressive moving average models. Biometrika, 60, 255–265. https://doi.org/10.1093/biomet/60.2.255 - DOI
-
- Andersen, K. , Bird, K. L. , Rasmussen, M. , Haile, J. , Breuning‐Madsen, H. , Kjær, K. H. , … Willerslev, E. (2012). Meta‐barcoding of “dirt” DNA from soil reflects vertebrate biodiversity. Molecular Ecology, 21, 1966–1979. https://doi.org/10.1111/j.1365-294X.2011.05261.x - DOI - PubMed
-
- Andruszkiewicz, E. A. , Starks, H. A. , Chavez, F. P. , Sassoubre, L. M. , Block, B. A. , & Boehm, A. B. (2017). Biomonitoring of marine vertebrates in Monterey Bay using eDNA metabarcoding. PLoS ONE, 12, e0176343 https://doi.org/10.1371/journal.pone.0176343 - DOI - PMC - PubMed
-
- Bálint, M. , Nowak, C. , Márton, O. , Pauls, S. , Wittwer, C. , Aramayo, J. L. , … Jansen, M. (2017). Twenty‐five species of frogs in a liter of water: eDNA survey for exploring tropical frog diversity. bioRxiv. https://doi.org/10.1101/176065 - DOI
-
- Bates, D. , Mächler, M. , Bolker, B. , & Walker, S. (2015). Fitting linear mixed‐effects models using lme4. Journal of Statistical Software, 67, 1–48.
LinkOut - more resources
Full Text Sources
Other Literature Sources

