

Modeling Hemolytic-Uremic Syndrome: In-Depth Characterization of Distinct Murine Models Reflecting Different Features of Human Disease
- PMID: 29988557
- PMCID: PMC6026657
- DOI: 10.3389/fimmu.2018.01459
Modeling Hemolytic-Uremic Syndrome: In-Depth Characterization of Distinct Murine Models Reflecting Different Features of Human Disease
Abstract
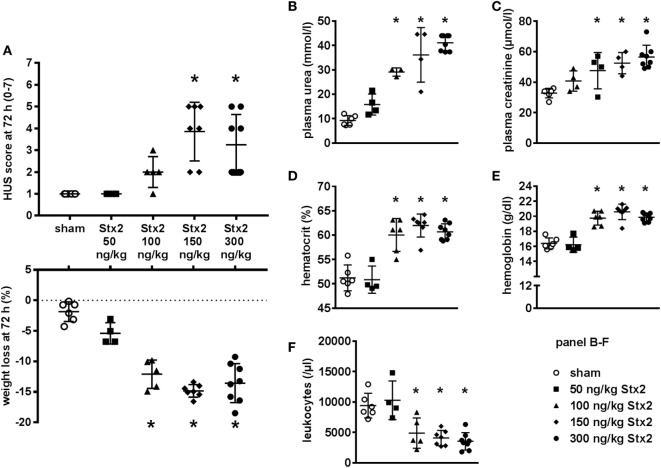
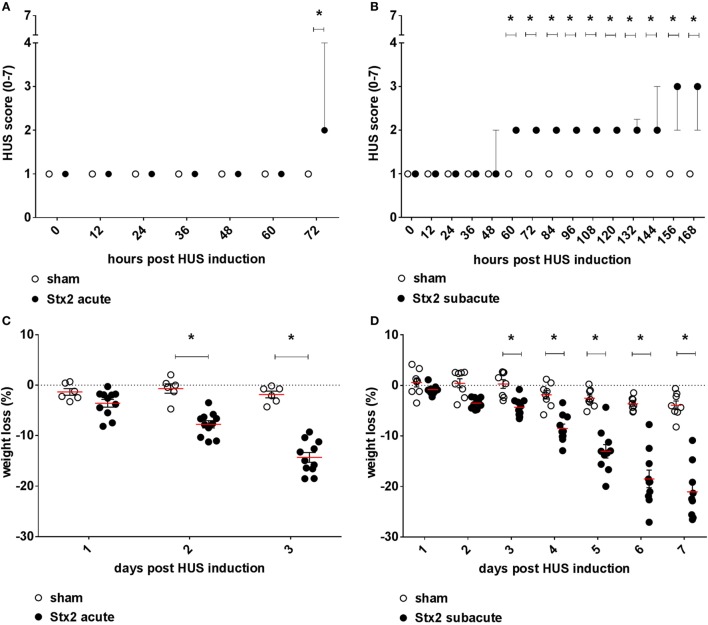
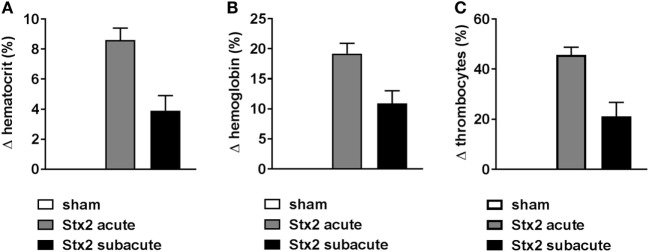
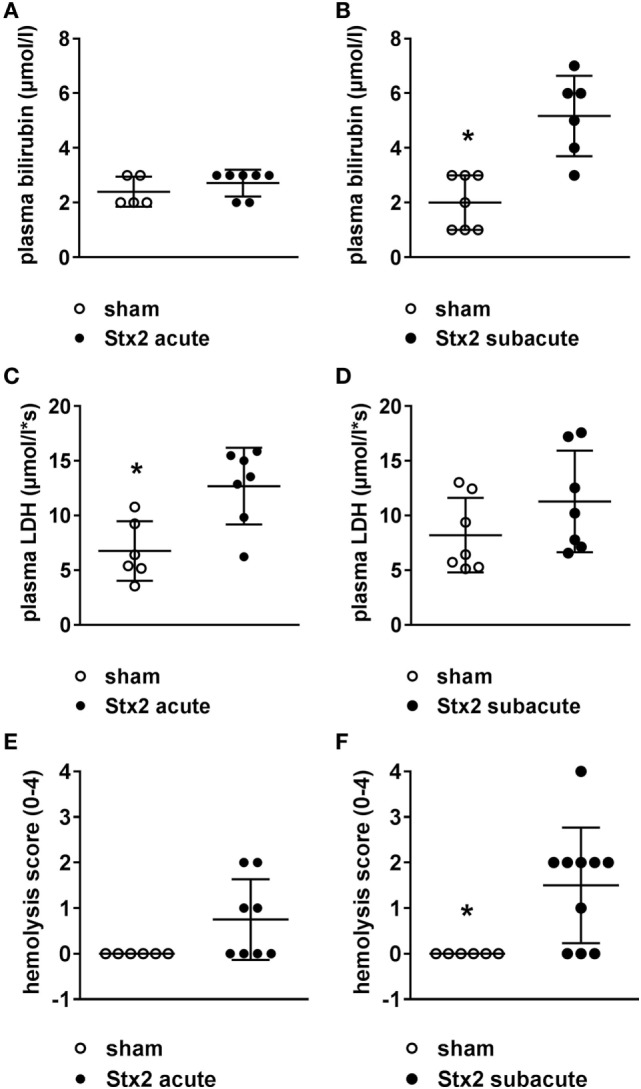
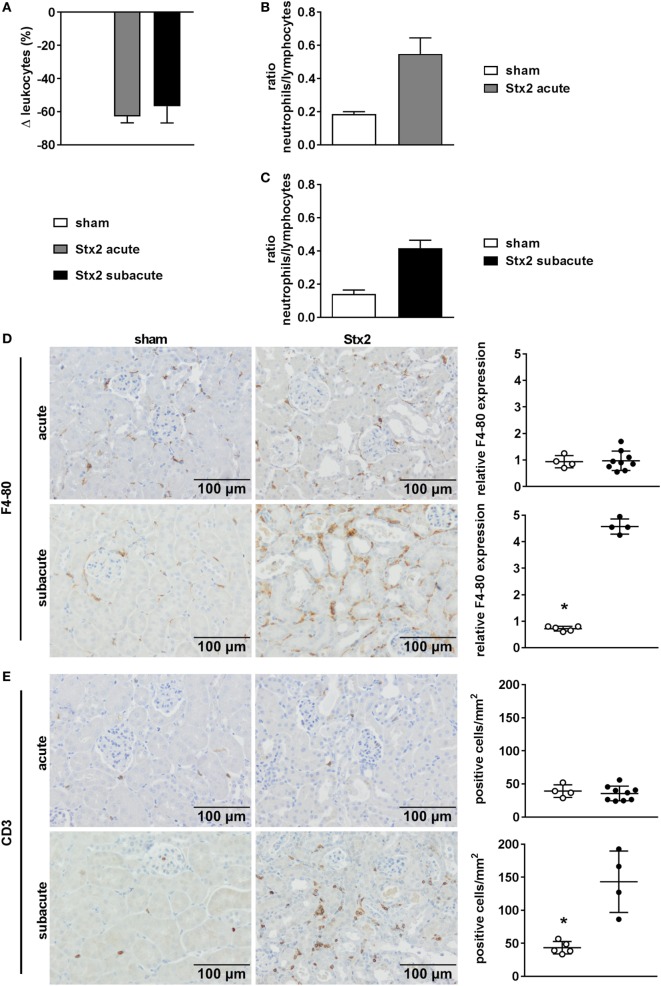
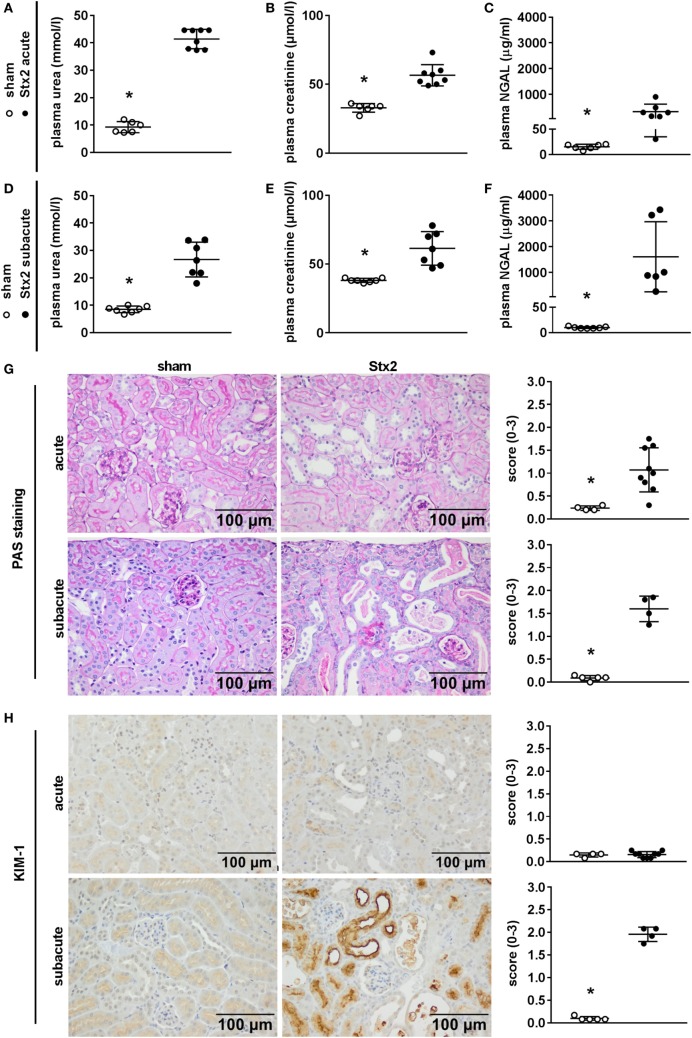
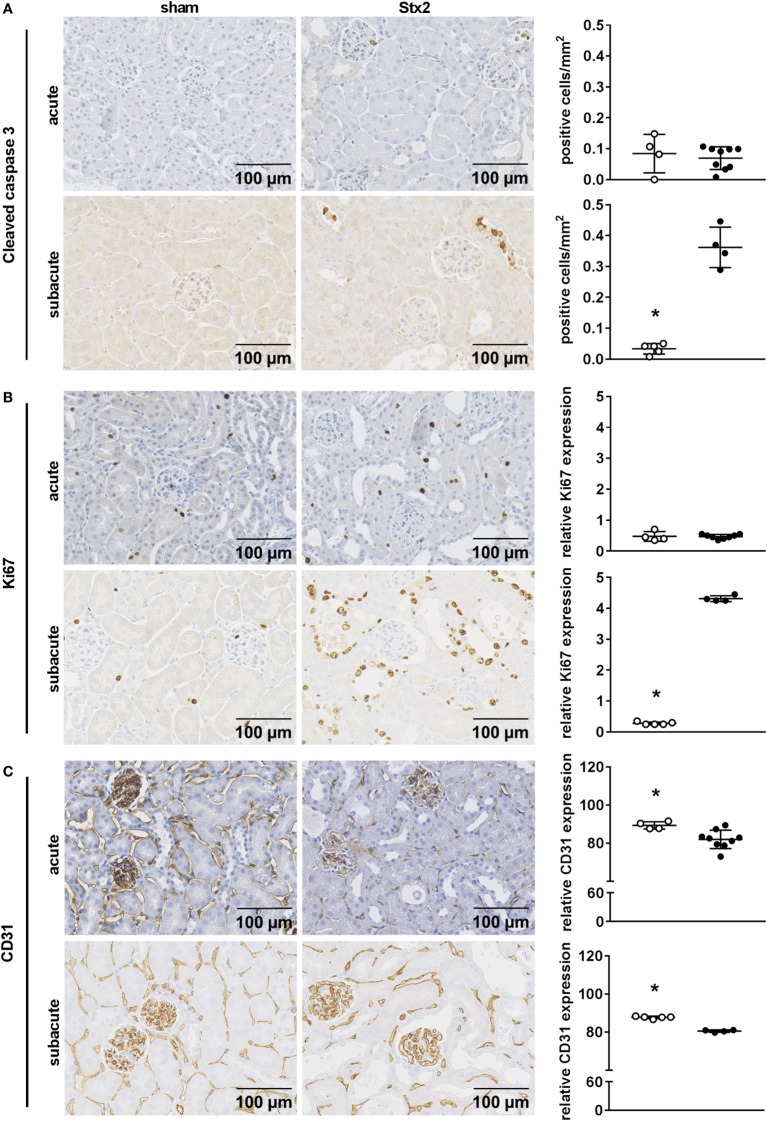
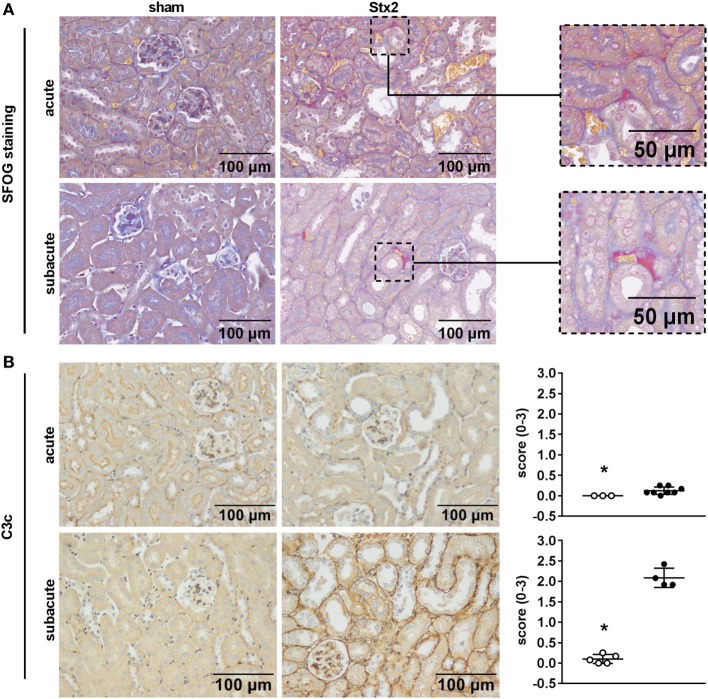
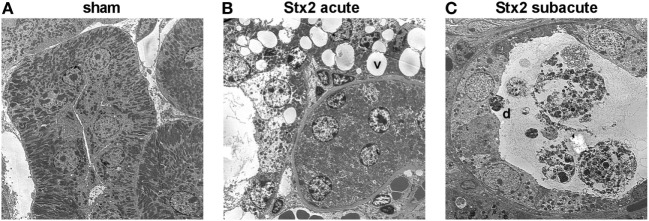
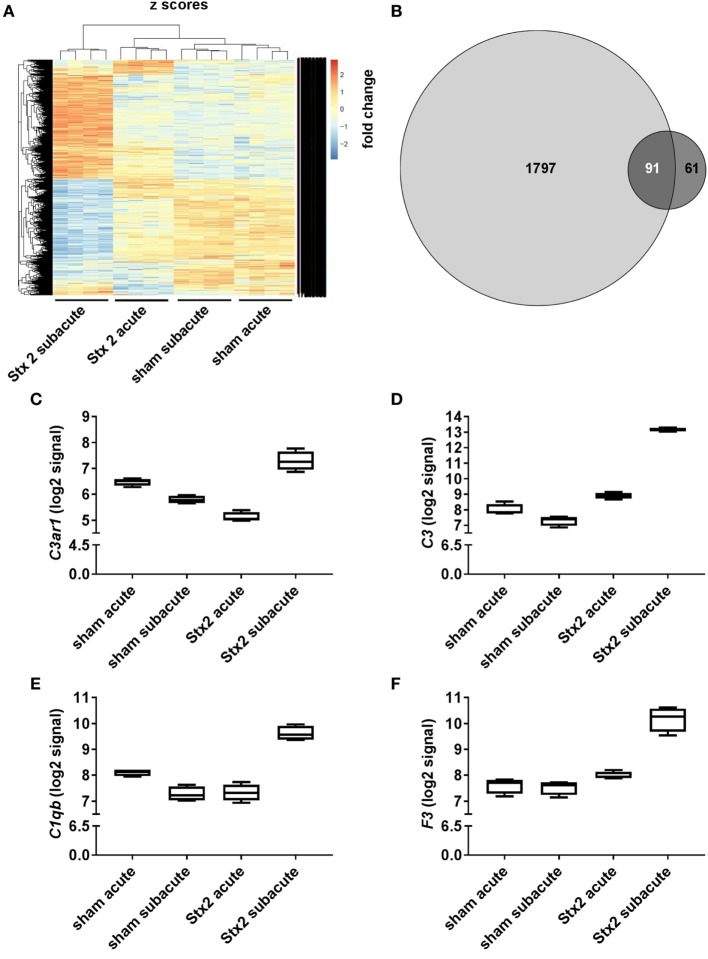
Diarrhea-positive hemolytic-uremic syndrome (HUS) is a renal disorder that results from infections with Shiga-toxin (Stx)-producing Escherichia coli. The aim of this study was to establish well-defined refined murine models of HUS that can serve as preclinical tools to elucidate molecular mechanisms of disease development. C57BL/6J mice were subjected to different doses of Stx2 purified from an E. coli O157:H7 patient isolate. Animals received 300 ng/kg Stx2 and were sacrificed on day 3 to establish an acute model with fast disease progression. Alternatively, mice received 25 ng/kg Stx2 on days 0, 3, and 6, and were sacrificed on day 7 to establish a subacute model with moderate disease progression. Indicated by a rise in hematocrit, we observed dehydration despite volume substitution in both models, which was less pronounced in mice that underwent the 7-day regime. Compared with sham-treated animals, mice subjected to Stx2 developed profound weight loss, kidney dysfunction (elevation of plasma urea, creatinine, and neutrophil gelatinase-associated lipocalin), kidney injury (tubular injury and loss of endothelial cells), thrombotic microangiopathy (arteriolar microthrombi), and hemolysis (elevation of plasma bilirubin, lactate dehydrogenase, and free hemoglobin). The degree of complement activation (C3c deposition), immune cell invasion (macrophages and T lymphocytes), apoptosis, and proliferation were significantly increased in kidneys of mice subjected to the 7-day but not in kidneys of mice subjected to the 3-day regime. However, glomerular and kidney volume remained mainly unchanged, as assessed by 3D analysis of whole mount kidneys using CD31 staining with light sheet fluorescence microscopy. Gene expression analysis of kidneys revealed a total of only 91 overlapping genes altered in both Stx2 models. In conclusion, we have developed two refined mouse models with different disease progression, both leading to hemolysis, thrombotic microangiopathy, and acute kidney dysfunction and damage as key clinical features of human HUS. While intrarenal changes (apoptosis, proliferation, complement deposition, and immune cell invasion) mainly contribute to the pathophysiology of the subacute model, prerenal pathomechanisms (hypovolemia) play a predominant role in the acute model. Both models allow the further study of the pathomechanisms of most aspects of human HUS and the testing of distinct novel treatment strategies.
Keywords: Escherichia coli; Shiga toxin; Shiga-toxin-producing Escherichia coli; acute kidney injury; enterohemorrhagic E. coli; hemolytic-uremic syndrome; mouse models.
Figures
Similar articles
-
Transition from acute kidney injury to chronic kidney disease in a long-term murine model of Shiga toxin-induced hemolytic-uremic syndrome.Front Immunol. 2024 Oct 10;15:1469353. doi: 10.3389/fimmu.2024.1469353. eCollection 2024. Front Immunol. 2024. PMID: 39450175 Free PMC article.
-
Red blood cell-derived arginase release in hemolytic uremic syndrome.J Transl Med. 2024 Jan 4;22(1):17. doi: 10.1186/s12967-023-04824-x. J Transl Med. 2024. PMID: 38178089 Free PMC article.
-
Alternative pathway activation of complement by Shiga toxin promotes exuberant C3a formation that triggers microvascular thrombosis.J Immunol. 2011 Jul 1;187(1):172-80. doi: 10.4049/jimmunol.1100491. Epub 2011 Jun 3. J Immunol. 2011. PMID: 21642543
-
Hemolytic uremic syndrome associated with Escherichia coli O157:H7 infection in older adults: a case report and review of the literature.J Med Case Rep. 2016 Jun 15;10:175. doi: 10.1186/s13256-016-0970-z. J Med Case Rep. 2016. PMID: 27301547 Free PMC article. Review.
-
Role of complement in enterohemorrhagic Escherichia coli-Induced hemolytic uremic syndrome.Semin Thromb Hemost. 2014 Jun;40(4):503-7. doi: 10.1055/s-0034-1375295. Epub 2014 May 5. Semin Thromb Hemost. 2014. PMID: 24799304 Review.
Cited by
-
Differential Outcome between BALB/c and C57BL/6 Mice after Escherichia coli O157:H7 Infection Is Associated with a Dissimilar Tolerance Mechanism.Infect Immun. 2021 Apr 16;89(5):e00031-21. doi: 10.1128/IAI.00031-21. Print 2021 Apr 16. Infect Immun. 2021. PMID: 33619029 Free PMC article.
-
Transition from acute kidney injury to chronic kidney disease in a long-term murine model of Shiga toxin-induced hemolytic-uremic syndrome.Front Immunol. 2024 Oct 10;15:1469353. doi: 10.3389/fimmu.2024.1469353. eCollection 2024. Front Immunol. 2024. PMID: 39450175 Free PMC article.
-
Targeting the innate repair receptor axis via erythropoietin or pyroglutamate helix B surface peptide attenuates hemolytic-uremic syndrome in mice.Front Immunol. 2022 Sep 23;13:1010882. doi: 10.3389/fimmu.2022.1010882. eCollection 2022. Front Immunol. 2022. PMID: 36211426 Free PMC article.
-
Serum protein coating enhances the antisepsis efficacy of silver nanoparticles against multidrug-resistant Escherichia coli infections in mice.Front Microbiol. 2023 May 24;14:1153147. doi: 10.3389/fmicb.2023.1153147. eCollection 2023. Front Microbiol. 2023. PMID: 37293234 Free PMC article.
-
Bruton's tyrosine kinase inhibition attenuates disease progression by reducing renal immune cell invasion in mice with hemolytic-uremic syndrome.Front Immunol. 2023 Feb 23;14:1105181. doi: 10.3389/fimmu.2023.1105181. eCollection 2023. Front Immunol. 2023. PMID: 36911665 Free PMC article.
References
-
- Meinel C, Sparta G, Dahse HM, Hörhold F, König R, Westermann M, et al. Streptococcus pneumoniae from patients with hemolytic uremic syndrome binds human plasminogen via the surface protein PspC and uses plasmin to damage human endothelial cells. J Infect Dis (2018) 217(3):358–70.10.1093/infdis/jix305 - DOI - PubMed
LinkOut - more resources
Full Text Sources
Other Literature Sources