Review
. 2018 May 31:10:65-73.
doi: 10.1016/j.pacs.2018.05.001. eCollection 2018 Jun.

Photoacoustic tomography of blood oxygenation: A mini review

Affiliations
Review

Photoacoustic tomography of blood oxygenation: A mini review

Mucong Li et al. Photoacoustics. .

Abstract

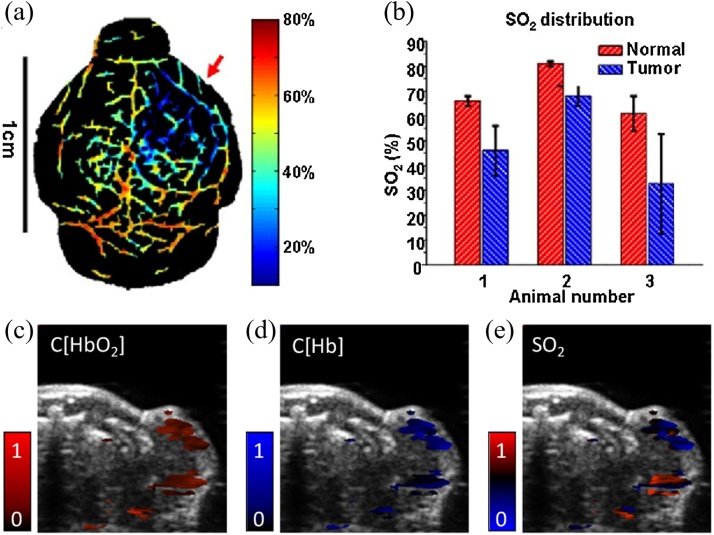
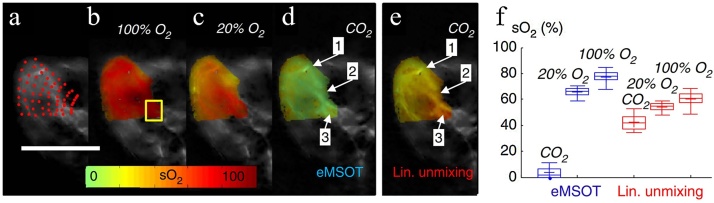
Photoacoustic tomography (PAT) is a hybrid imaging modality that combines rich contrast of optical excitation and deep penetration of ultrasound detection. With its unique optical absorption contrast mechanism, PAT is inherently sensitive to the functional and molecular information of biological tissues, and thus has been widely used in preclinical and clinical studies. Among many functional capabilities of PAT, measuring blood oxygenation is arguably one of the most important applications, and has been widely performed in photoacoustic studies of brain functions, tumor hypoxia, wound healing, and cancer therapy. Yet, the complex optical conditions of biological tissues, especially the strong wavelength-dependent optical attenuation, have long hurdled the PAT measurement of blood oxygenation at depths beyond a few millimeters. A variety of PAT methods have been developed to improve the accuracy of blood oxygenation measurement, using novel laser illumination schemes, oxygen-sensitive fluorescent dyes, comprehensive mathematic models, or prior information provided by complementary imaging modalities. These novel methods have made exciting progress, while several challenges remain. This concise review aims to introduce the recent developments in photoacoustic blood oxygenation measurement, compare each method's advantages and limitations, highlight their representative applications, and discuss the remaining challenges for future advances.

Keywords: Blood oxygenation; Inverse problem; Optical attenuation; Optical scattering; Photoacoustic tomography; Spectral unmixing.


Figures

Fig. 1
Fig. 1
Absorption coefficient spectra of endogenous tissue chromophores. HbO2 and HbR, 150 g/L in blood; Water, 80% by volume in tissue; Lipid, 20% by volume in tissue; Melanin, 14.3 g/L in medium human skin. Figure adapted with permission from [30].
Fig. 2
Fig. 2
PAT of blood oxygenation using a linear-model. (a) sO2 image of a mouse brain acquired by using LLS spectral fitting. (b) Comparison of sO2 in normal and tumor blood vessels. (c–e) HbO2, HbR and sO2 maps using a 2D skin-tissue layer model and minimum mean square error method. Figures adapted with permissions from [10,46].
Fig. 3
Fig. 3
Optical absorption coefficients calculated based on acoustic spectra. (a) Theoretical fitting (dashed line) and experimental (solid line) acoustic spectra ratio of oxygenated bovine blood at two wavelengths. (b) The fitting of acoustic spectra ratio in an artery (V1) and a vein (V2) at two wavelengths in a mouse ear. Figures adapted with permission from [39].
Fig. 4
Fig. 4
Optical fluence compensation using DOT. (a) Original PA image of a cross-section of a phantom containing three tubes. (b) Fluence-compensated PA image of the same cross-section, showing improved signal consistency. (c) Volume-integrated PA signals of the three tubes. (d) Volume-integrated absorption coefficients of the three tubes after fluence correction. (e) The fluence distribution map measured by DOT. (f) Optical fluence profile at the tube depth, showing significant inhomogeneity along the azimuth direction. Figures adapted with permission from [49].
Fig. 5
Fig. 5
PA signal amplitude as a function of pump-probe delay at four different pO2 levels. pO2 levels 0.4 mmHg (circle), 8.6 mmHg (square), 40 mmHg (triangle), and 153 mmHg (diamond). The PA signal decay rate (up right corner) is also plotted as a function of pO2 (R2 = 0.9914). Figure adapted with permission from [33].
Fig. 6
Fig. 6
Absorption saturation of HbR and HbO2. (a–b) PA signal amplitudes as a function of the energy of nanosecond (3 ns) and picosecond (3 ps) pulse excitation. (c) Saturation factors of HbR and HbO2. The saturation factor is defined as the ratio of PA signal amplitude with picosecond and nanosecond excitation. Figures adapted with permission from [57].
Fig. 7
Fig. 7
Comparison of sO2 estimation using eMSOT and linear spectral fitting method. (a) The image area that eMSOT was applied on hindlimb muscles. (b–d) sO2 estimation using eMSOT, under 100% O2 breathing air (b), 20% O2 breathing air (c), and post mortem (d). (e) sO2 estimation using linear spectral unmixing method post mortem. Scale bar, 1 cm. (f) Estimated sO2 values in a deep tissue area (yellow box in (b)) using eMSOT (blue) and linear unmixing method (red) under different breathing conditions. Figures adapted with permission from [42].

References

    1. Xia J., Yao J., Wang L.V. Photoacoustic tomography: principles and advances. Electromagn. Waves (Camb.) 2014;147:1–22. - PMC - PubMed
    1. Wu D. Contrast agents for photoacoustic and thermoacoustic imaging: a review. Int. J. Mol. Sci. 2014;15(12):23616–23639. - PMC - PubMed
    1. Strohm E.M., Moore M.J., Kolios M.C. Single cell photoacoustic microscopy: a review. IEEE J. Sel. Top. Quantum Electron. 2016;22(3):137–151.
    1. Ntziachristos V., Razansky D. Molecular Imaging in Oncology. Springer; 2013. Optical and opto-acoustic imaging; pp. 133–150. - PubMed
    1. Ntziachristos V. Going deeper than microscopy: the optical imaging frontier in biology. Nat. Methods. 2010;7(8):603. - PubMed