. 2018 Apr 22;3(4):905-915.
doi: 10.1016/j.ekir.2018.04.006. eCollection 2018 Jul.

Prevalence of CKD, Diabetes, and Hypertension in Rural Tanzania

Affiliations

Prevalence of CKD, Diabetes, and Hypertension in Rural Tanzania

David W Ploth et al. Kidney Int Rep. .

Abstract

Introduction: Chronic kidney disease (CKD), diabetes, and hypertension play a disproportionate role in the growing public health challenge posed by noncommunicable diseases (NCDs) in East Africa. The impact of these NCDs may pose the greatest challenge in rural areas with limited screening and treatment facilities, although precise prevalence estimates of these conditions in rural Tanzania are lacking.

Methods: The prevalence of CKD, diabetes, and hypertension, were estimated from a probability sample of adults (n = 739) residing in 2 communities within Kisarawe, a rural district of Tanzania. Following consent, participants were studied in their homes. Random point-of-care (POC) measures of glycosylated hemoglobin and blood pressure, were obtained. Serum creatinine, drawn at the POC and measured at Muhimbili National University, was used to calculate estimated glomerular filtration rate with the Chronic Kidney Disease Epidemiology Collaboration (CKD-EPI) equation.

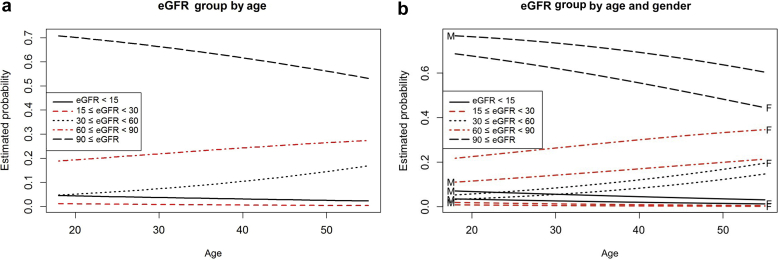
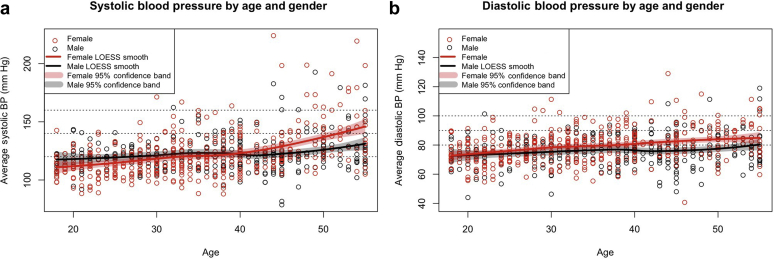
Results: The median age was 35 years (interquartile range 25-45 years). Overall the pooled prevalence for CKD stages III, IV, and V was 12.4% (95% confidence interval [CI] = 10.2-14.8). Surprisingly, the prevalence of CKD stage V (3.0%; 95% CI = 2.1-4.4) was high among the youngest age group (18-36 years). The prevalence estimates for prehypertension and hypertension were 38.0% (95% CI = 34.6-41.5) and 19.9% (95% CI = 17.1-22.9), respectively. The prevalence estimates for prediabetes and diabetes were 25.7% (95% CI = 22.6-29.1) and 14.8% (95% CI = 12.4-17.6), respectively.

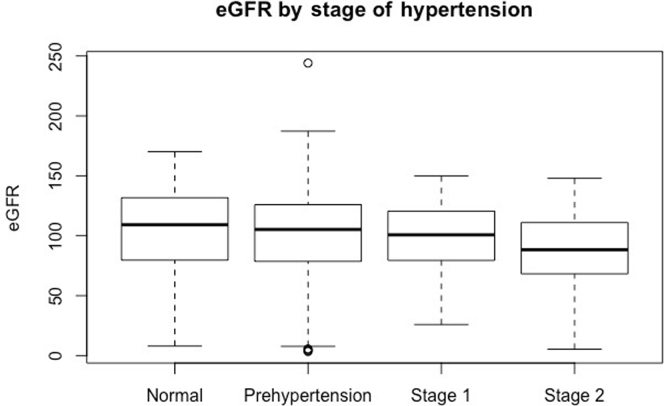
Conclusion: Although this pilot study had a relatively small sample size, the prevalence estimates for CKD, diabetes, and hypertension were higher than we expected based on previous estimates from Tanzania. CKD was not significantly associated with diabetes or hypertension, suggesting the possibility of an alternative causality.

Keywords: Tanzania; diabetes mellitus; hypertension; kidney disease; prevalence.


Figures

Figure 1
Figure 1
Flowchart displaying study sampling, participant recruitment, and nonresponse rates.
Figure 2
Figure 2
Relationship of estimated glomerular filtration rate (eGFR) to age. Scatterplot of eGFR versus age with genders identified as female (red) and male (black). Locally weighted scatterplot smoothing (LOESS) has been fitted for each gender. Analysis of covariance confirmed that eGFR decreases with age similarly for both genders. Overall age is significant (P < 0.001), with on average a 12−eGFR unit drop per decade of life. Genders differ significantly (P < 0.001), with females on average 8.7 eGFR units lower than males. There is no significant gender-by-age interaction (P = 0.9).
Figure 3
Figure 3
Relationship of (a) estimated glomerular filtration rate (eGFR) group by age and (b) eGFR group by age and gender. (a) Chronic kidney disease (CKD) stage categorized according to eGFR < 15, 15 ≤ eGFR < 30, 30 ≤ eGFR < 60, 60 ≤ eGFR < 90, and 90 ≤ eGFR. Multinomial logistic regression (unordered categories or generalized logistic regression) depicts the estimated probability of group membership for each of the 5 eGFR groupings at every age; at any given age, the estimated probabilities sum to 1. Because there are so few patients in the bottom 2 eGFR groups (those with eGFR <30), particularly for older ages, the model does not find any significant trend with age for those groups (P > 0.5 for both). Proportions between 30 and 60 and between 60 and 90 increase significantly with age, and, as a consequence, proportion >90 decreases significantly with age (P < 0.05 for all). (b) Similar to the eGFR value grouping shown in (a), the eGFR group is depicted by age and gender. Predicted estimated probability curves by gender are identified as female (red) and male (black). The gender-by-age interaction was not significant (P > 0.3), so the overall trends are similar for the genders. However, there is a significant gender effect that shows increased proportions for eGFR between 30 and 90 and decreased proportion >90 for females relative to males (that is the result of eGFR in females being slightly lower than in males).
Figure 4
Figure 4
Relationship of hypertension to age and gender. Systolic (a) and diastolic (b) blood pressure (BP) are plotted against age, separated by gender, and identified as female (red) and male (black). Locally weighted scatterplot smoothing (LOESS) has been fitted for each gender. Although systolic and diastolic BP increases for both genders with increasing age, the effect for females is more pronounced. Proportional odds logistic regression confirmed a significant gender-by-age interaction (P < 0.001).
Figure 5
Figure 5
Relationship between stage of hypertension (HTN) and estimated glomerular filtration rate (eGFR). One-way analysis of variance reveals no significant difference between individuals with normal blood pressure (BP) through stage I hypertension. However, those with stage II hypertension do exhibit significantly lower values for eGFR than individuals in the other stages (P < 0.01).
Figure 6
Figure 6
Relationship between measured HbA1c, age, and gender. (a) Scatterplot of HbA1c versus age of patient, separated by gender (red represents female, black represents male). Locally weighted scatterplot smoothing (LOESS) smooth fits are included. (b) Estimated probabilities of diabetes (DM) stage (normal, pre-DM, DM) by age of patient, separated by gender. Calculated from proportional odds logistic regression. There was no significant gender-by-age interaction, but both age (P < 0.001) and gender (P < 0.002) were significant. The probability of being in the pre-DM or DM stage increases with age, and females are more likely to be in those stages than are males at all ages.
Figure 7
Figure 7
Venn diagram displaying the co-associations of chronic kidney disease (CKD), hypertension, and HbA1c.

References

    1. GBD 2015 Mortality and Causes of Death Collaborators Global, regional, and national life expectancy, all-cause mortality, and cause-specific mortality for 249 causes of death, 1980-2015: a systematic analysis for the Global Burden of Disease Study 2015. Lancet. 2016;388:1459–1544. - PMC - PubMed
    1. Hill N.R., Fatoba S.T., Oke J.L. Global prevalence of chronic kidney disease—a systematic review and meta-analysis. PLoS One. 2016;11:e0158765. - PMC - PubMed
    1. Kearney P.M., Whelton M., Reynolds K. Global burden of hypertension: analysis of worldwide data. Lancet. 2005;365:217–223. - PubMed
    1. Whiting D.R., Guariguata L., Weil C., Shaw J. IDF Diabetes atlas: global estimates of the prevalence of diabetes for 2011 and 2030. Diabetes Res Clin Practice. 2011;94:311–321. - PubMed
    1. Stanifer J.W., Maro V., Egger J. The epidemiology of chronic kidney disease in northern Tanzania: a population-based survey. PLoS One. 2015;10:e0124506. - PMC - PubMed

LinkOut - more resources