. 2018 Jul 10;13(7):e0199888.
doi: 10.1371/journal.pone.0199888. eCollection 2018.

Caenorhabditis elegans respond to high-glucose diets through a network of stress-responsive transcription factors

Affiliations

Caenorhabditis elegans respond to high-glucose diets through a network of stress-responsive transcription factors

Jonathan Alcántar-Fernández et al. PLoS One. .

Abstract

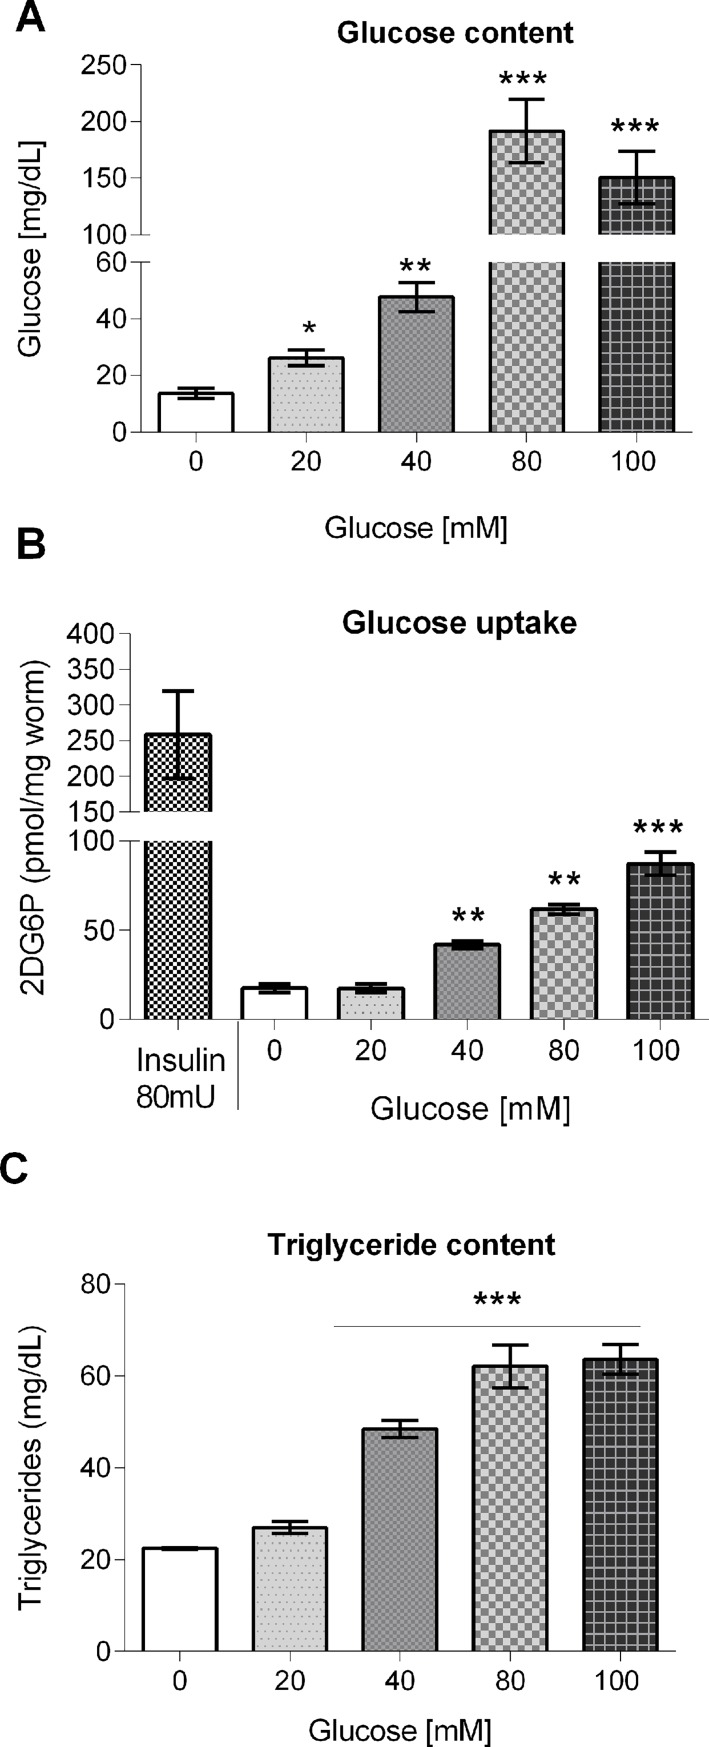
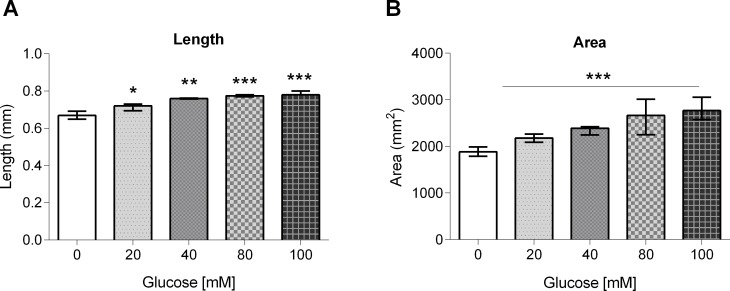
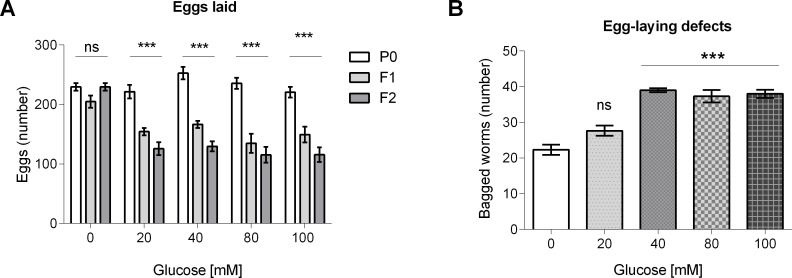
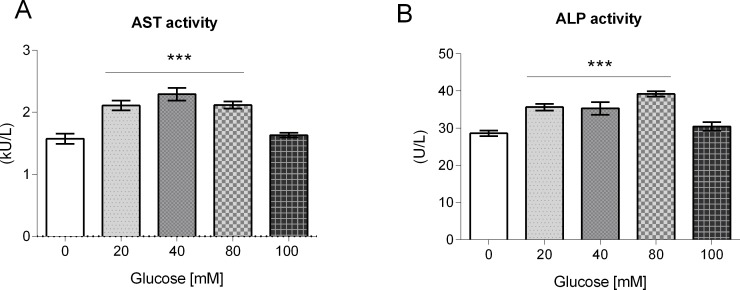
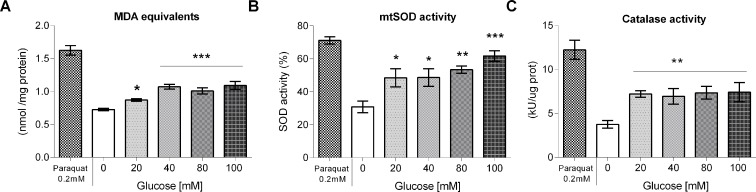
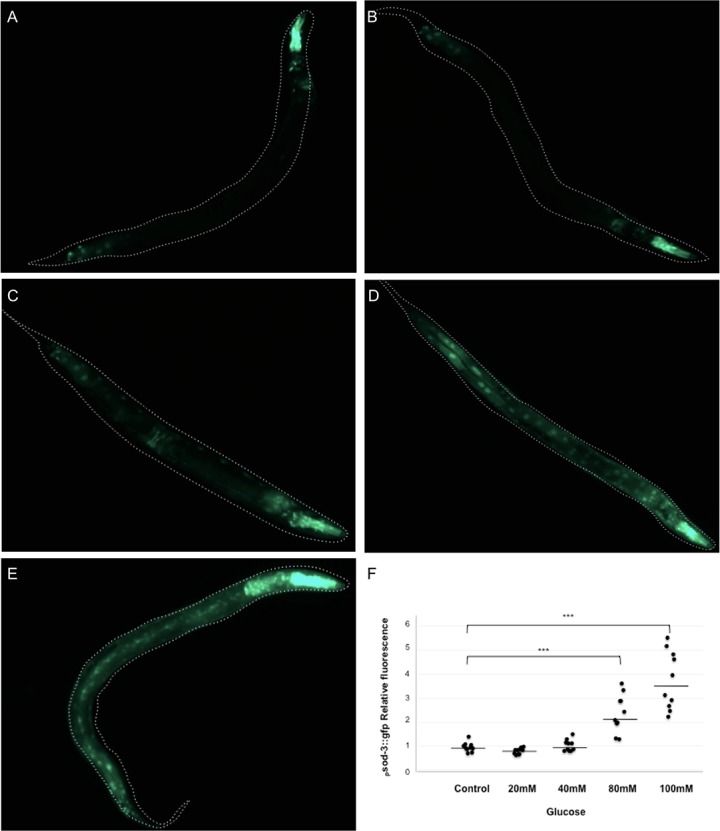
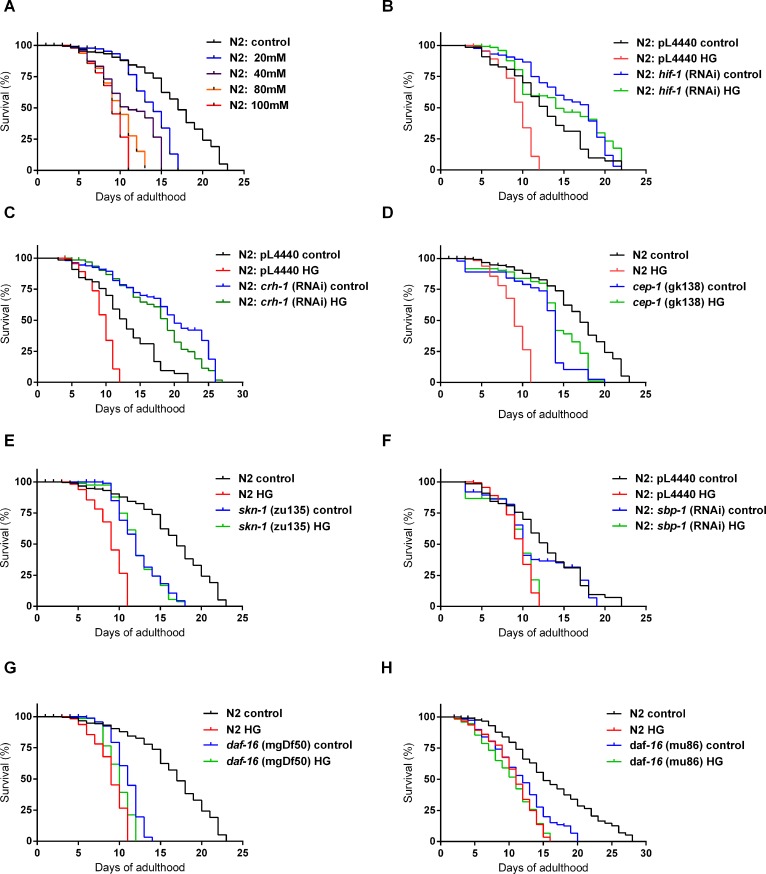
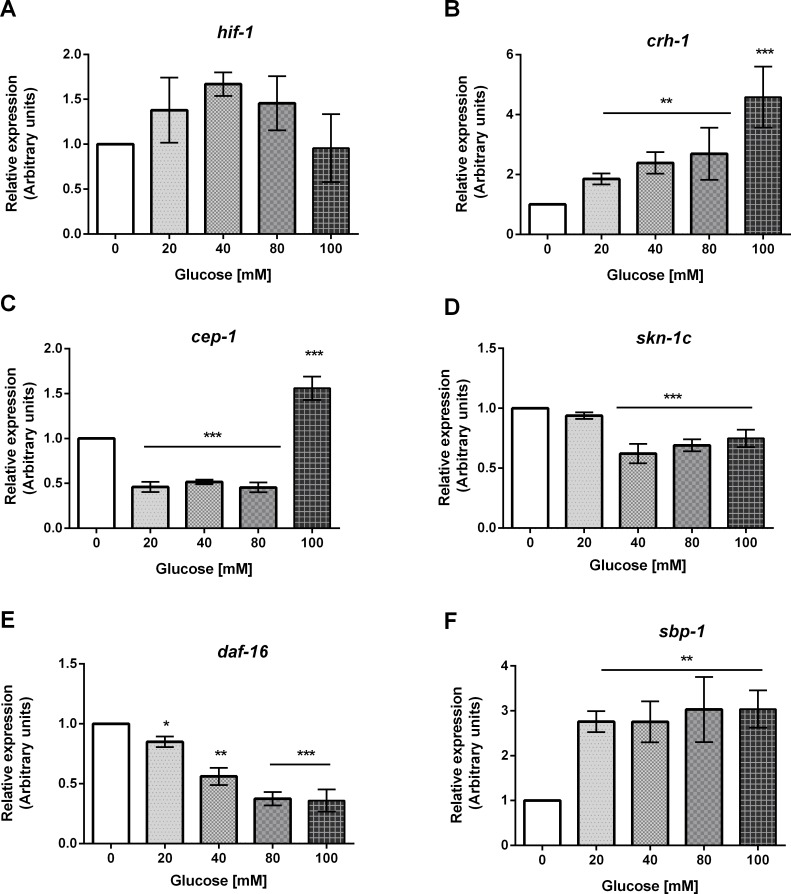
High-glycemic-index diets, as well as a sedentary lifestyle are considered as determinant factors for the development of obesity, type 2 diabetes, and cardiovascular diseases in humans. These diets have been shown to shorten the life span of C. elegans in a manner that is dependent on insulin signaling, but the participation of other signaling pathways have not been addressed. In this study, we have determined that worms fed with high-glucose diets show alterations in glucose content and uptake, triglyceride content, body size, number of eggs laid, egg-laying defects, and signs of oxidative stress and accelerated aging. Additionally, we analyzed the participation of different key regulators of carbohydrate and lipid metabolism, oxidative stress and longevity such as SKN-1/NRF2, HIF-1/HIF1α, SBP-1/SREBP, CRH-1/CREB, CEP-1/p53, and DAF-16/FOXO, in the reduction of lifespan in glucose-fed worms.


Conflict of interest statement

The authors have declared that no competing interests exist.

Figures

Fig 1
Fig 1. Glucose content, glucose uptake, and triglyceride content in glucose-fed worms.
Worms were exposed from L1 to L4 larval stage to 20, 40, 80 or 100 mM glucose, and (A) glucose content, (B) glucose uptake, or (C) triglyceride content was determined. Values are expressed as median ± interquartile range (IQR) (n = 6).*P < 0.05, **P < 0.01 or ***P < 0.001 for the indicated comparison (calculated using the Kruskal-Wallis test).
Fig 2
Fig 2. Body length and area of glucose-fed worms.
Worms were exposed from L1 to L4 larval stage to 20, 40, 80 or 100 mM glucose, and their (A) length, or (B) area, was measured. Experiments were performed in triplicate. Values are expressed as mean ± SEM (n = 50). *P < 0.05, **P < 0.01 or ***P < 0.001 for the indicated comparison (calculated using a one-way ANOVA test).
Fig 3
Fig 3. Number of eggs laid and egg retention with internal hatching frequency in glucose-fed worms.
(A) Worms were exposed to 20, 40, 80 or 100 mM glucose for three generations (P0, F1 and F2) and the number of eggs laid in each generation was determined. (B) Worms were exposed to 20, 40, 80 or 100 mM glucose for only one generation and the frequency of egg retention with internal hatching or “bagging” was determined. Values are expressed as mean ± SEM (n = 100). *P < 0.05, **P < 0.01 or ***P < 0.001 for the indicated comparison (the number of eggs laid was analyzed using a two-way ANOVA test, while egg retention with internal hatching frequency was analyzed using a one-way ANOVA test).
Fig 4
Fig 4. Aspartate Aminotransferase (AST) and Alkaline Phosphatase (ALP) enzyme activities in glucose-fed worms.
Worms were exposed from L1 to L4 larval stage to 20, 40, 80 or 100 mM glucose, then (A) AST and (B) ALP enzyme activities were measured. Values expressed as mean ± SEM (n = 12).*P < 0.05, **P < 0.01 or ***P < 0.001 for the indicated comparison (calculated using a one-way ANOVA test).
Fig 5
Fig 5. Lipid peroxidation and antioxidant enzymes in glucose-fed worms.
Worms were exposed from L1 to L4 larval stage to 20, 40, 80 or 100 mM glucose, then (A) lipid peroxidation, (B) mitochondrial superoxide dismutase (mtSOD), and (C) catalase (CAT) activities were measured. Results are presented as mean ± SEM. In the case of mtSOD, results are presented as %, with controls set to 100%. *P < 0.05, **P < 0.01 or ***P < 0.001 for the indicated comparison (calculated using a one-way ANOVA test).
Fig 6
Fig 6. Psod-3::GFP expression after heat shock is higher when animals were grown in a HGD.
(A-E) Psod-3::GFP transgen animals were exposed from L1 larvae to L4 larval stage to a diet of 0 (A), 20 (B), 40 (C), 80 (D) or 100 (E) mM glucose. To induce the expression of the reporter, animals were exposed to a heat shock of 31°C for 8 h. After heat shock, animals were mounted and observed for fluorescence. Representative pictures are shown for each case. The data of one of two independent replicates with similar results are shown. (F) Graph shows the relative expression level of each experimental condition. ***P < 0.001 (calculated using a one-way ANOVA test).
Fig 7
Fig 7. Lifespan of wild-type, mutants or RNAi knock-downs of stress-responsive transcriptional regulators worms upon feeding a HGD.
(A) Lifespan curves for adult worms that were exposed from L1 larval stage to the end of their life cycle to 20, 40, 80 or 100 mM glucose (n = 110). (B-H) Lifespan curves for mutants or RNAi knock-downs of adult worms that were exposed from L1 larval stage to the end of their life cycle to 100 mM glucose and compared to controls (n = 110 worms per condition), (B) hif-1(RNAi); (C) crh-1(RNAi); (D) cep-1(gk138); (E) skn-1(zu135); (F) sbp-1(RNAi); (G) daf-16(mgDf50); (H) daf-16(mu86). For RNAi experiments, bacteria containing empty vector pL4400 was used as a control. Differences between groups were calculated using the log-rank test. See Supplemental S2 Table for statistical analysis of lifespan data shown in this figure.
Fig 8
Fig 8. mRNA abundance of stress-responsive transcription factors of worms grown at different concentrations of glucose.
Worms were exposed from L1 to L4 larval stage to 20, 40, 80 or 100 mM glucose. Panels show quantitative RT-qPCR analysis of: (A) hif-1; (B) crh-1; (C) cep-1; (D) skn-1c; (E) daf-16; (F) sbp-1 mRNA level in wild-type worms grown at the specified glucose concentration. Values expressed as median ± IQR (n = 6).*P < 0.05, **P < 0.01 or ***P < 0.001 for the indicated comparison (calculated using the Kruskal-Wallis test).

References

    1. Lempradl A, Pospisilik JA, Penninger JM. Exploring the emerging complexity in transcriptional regulation of energy homeostasis. Nat Rev Genet. 2015;16(11):665–681. Epub 2015/10/16. doi: 10.1038/nrg3941 - DOI - PubMed
    1. Mondoux MA, Love DC, Ghosh SK, Fukushige T, Bond M, Weerasinghe GR, et al. O-linked-N-acetylglucosamine cycling and insulin signaling are required for the glucose stress response in Caenorhabditis elegans. Genetics. 2011;188(2):369–382. doi: 10.1534/genetics.111.126490 - DOI - PMC - PubMed
    1. Ray PD, Huang BW, Tsuji Y. Reactive oxygen species (ROS) homeostasis and redox regulation in cellular signaling. Cell Signal. 2012;24(5):981–990. doi: 10.1016/j.cellsig.2012.01.008 - DOI - PMC - PubMed
    1. Bonomini F, Rodella LF, Rezzani R. Metabolic syndrome, aging and involvement of oxidative stress. Aging Dis. 2015;6(2):109–120. Epub 2015/03/31. doi: 10.14336/AD.2014.0305 - DOI - PMC - PubMed
    1. Yu T, Robotham JL, Yoon Y. Increased production of reactive oxygen species in hyperglycemic conditions requires dynamic change of mitochondrial morphology. Proc Natl Acad Sci USA. 2006;103(8):2653–2658. Epub 2006/02/16. doi: 10.1073/pnas.0511154103 - DOI - PMC - PubMed

Publication types

MeSH terms