. 2018 Jul 9;34(1):56-68.e9.
doi: 10.1016/j.ccell.2018.05.014.

Bi-allelic Loss of CDKN2A Initiates Melanoma Invasion via BRN2 Activation

Affiliations

Bi-allelic Loss of CDKN2A Initiates Melanoma Invasion via BRN2 Activation

Hanlin Zeng et al. Cancer Cell. .

Abstract

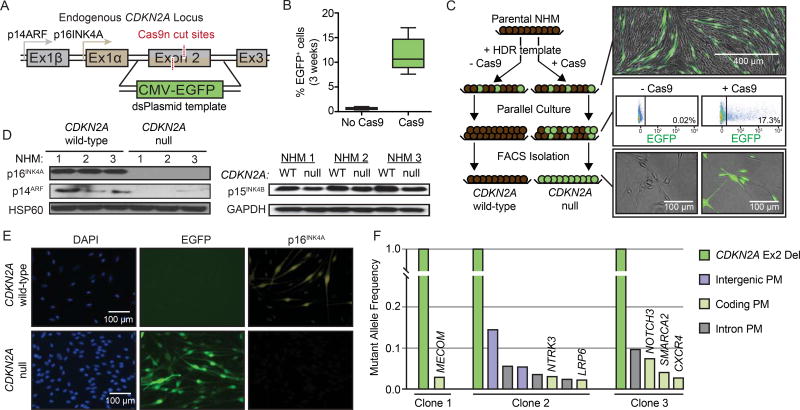
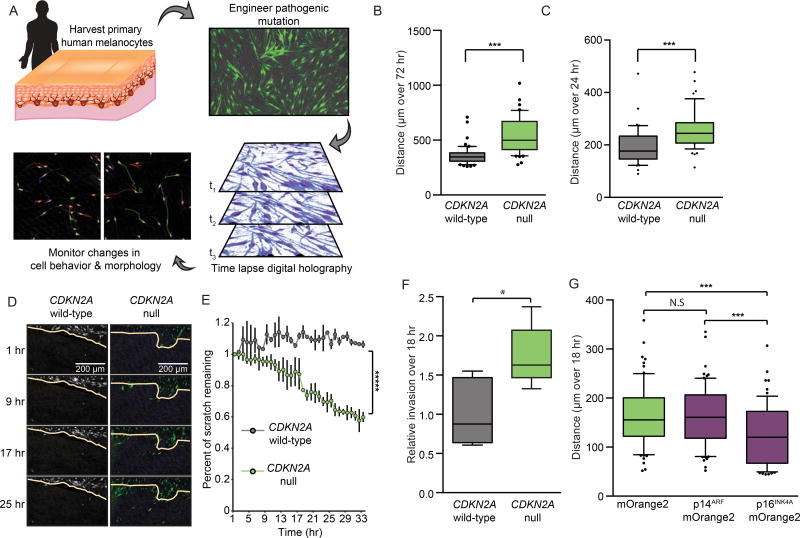
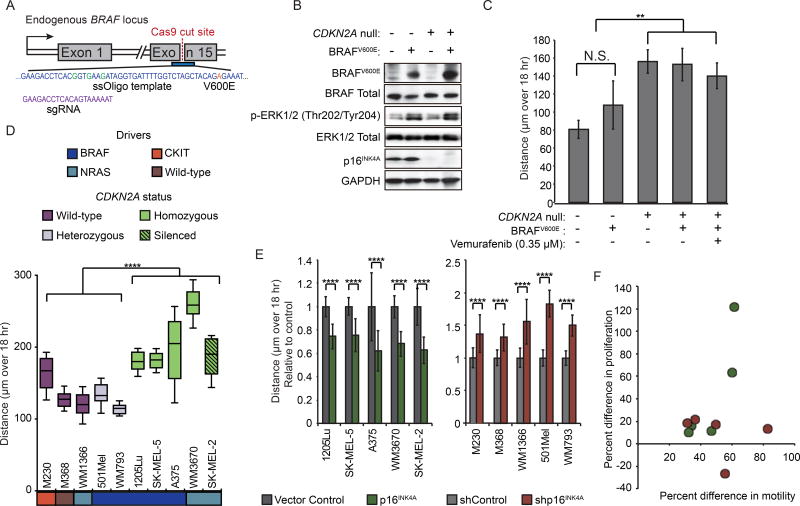
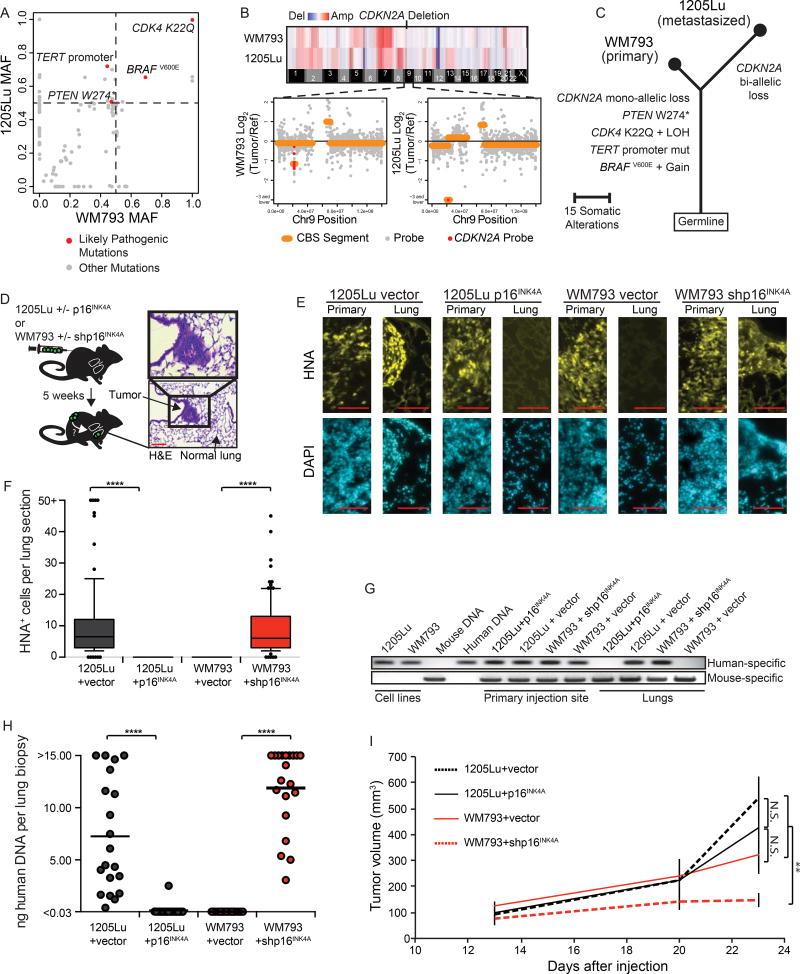
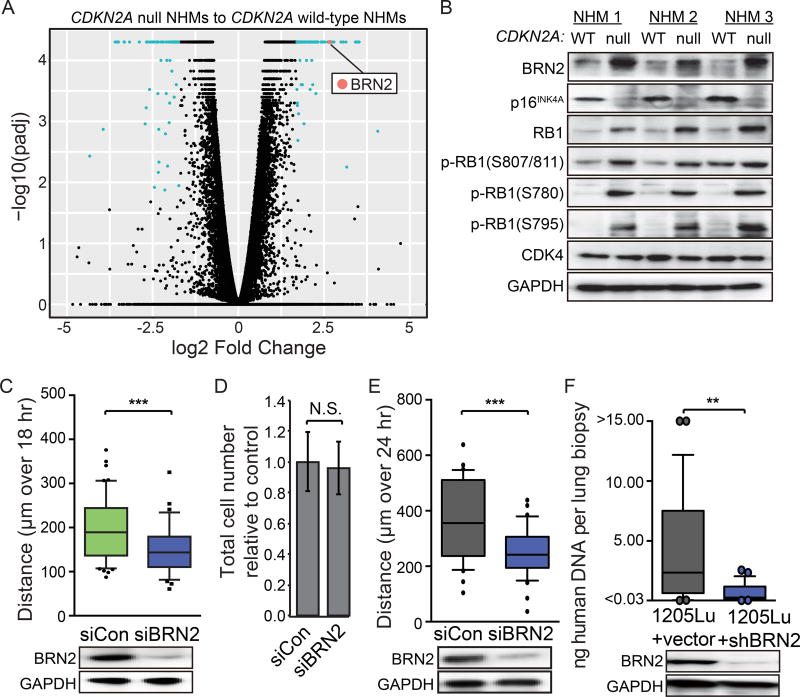
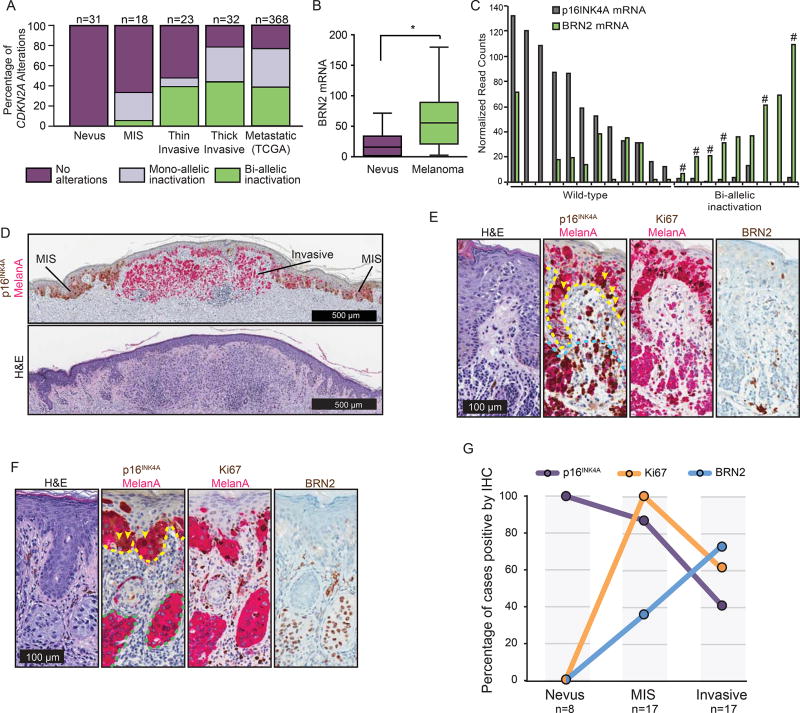
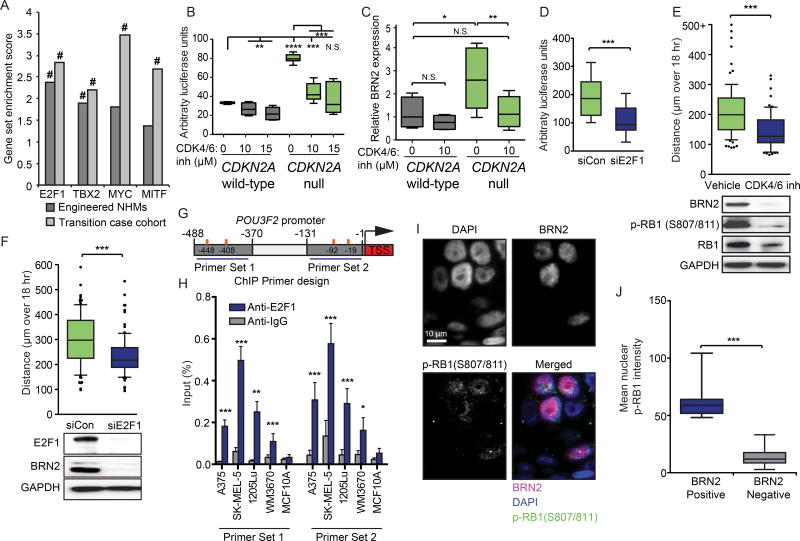
Loss of the CDKN2A tumor suppressor is associated with melanoma metastasis, but the mechanisms connecting the phenomena are unknown. Using CRISPR-Cas9 to engineer a cellular model of melanoma initiation from primary human melanocytes, we discovered that a lineage-restricted transcription factor, BRN2, is downstream of CDKN2A and directly regulated by E2F1. In a cohort of melanocytic tumors that capture distinct progression stages, we observed that CDKN2A loss coincides with both the onset of invasive behavior and increased BRN2 expression. Loss of the CDKN2A protein product p16INK4A permitted metastatic dissemination of human melanoma lines in mice, a phenotype rescued by inhibition of BRN2. These results demonstrate a mechanism by which CDKN2A suppresses the initiation of melanoma invasion through inhibition of BRN2.

Keywords: BRN2; CDKN2A; CRISPR engineering; E2F1; invasion; melanocytes; melanoma.


Conflict of interest statement

Declaration of Interests: B.C.B. has served as a consultant for Lilly Inc.

Figures

Figure 1
Figure 1. Engineering of CDKN2A null melanocytes
(A) Strategy for introducing focal knock-in of CMV-EGFP to replace exon 2 of CDKN2A. (B) Percentage of EGFP-positive NHMs three weeks after editing the CDKN2A locus. Data represent mean, 25th and 75th percentiles, minimum and maximum values of eight CRISPR reactions on three preparations of NHMs. (C) Strategy for isolating CDKN2A null NHMs for comparison to wild-type siblings cells. Directly after transfection, both Cas9 and Cas9+ conditions contain EGFP+ cells (top). Over time, Cas9 cells become uniformly EGFP, and the remaining EGFP+ cells in the Cas9+ population are isolated (middle). Isolated cells are stably EGFP+ and compared to matched EGFP- cells (bottom). (D) Western blot detection of both CDKN2A protein products (p16INK4A and p14ARF, left) and CDKN2B protein product (p15INK4B, right) in isolated EGFP+ and EGFP NHM populations. (E) Immunofluorescent visualization of p16INK4A expression in EGFP+ and matched EGFP NHMs. (F) Targeted sequencing of three clonal EGFP+ populations to monitor for off-target Cas9 cutting. Graphed are the mutant allele frequencies of deletions (Del) and point mutations (PM) in intergenic, coding and intronic regions. NHM1–3 refers to independent primary melanocyte derivations and engineering events. See also Figure S1.
Figure 2
Figure 2. CDKN2A loss promotes melanocyte motility and invasion
(A) Schematic of experimental set-up. For each experiment, NHMs are derived from donated tissue and engineered for CDKN2A loss as in Figure 1. After isolation, CDKN2A null and wild-type sibling cells are monitored via digital holographic cytometry for 72 hr. The rate of cell division, motility, morphology, growth arrest and detachment are quantified. Representative holographic phase shift images (bottom left) show colored comet tails tracking cells. (B) Single cell motility analysis of CDKN2A null NHMs compared to wild-type siblings. Box and whisker plot represents mean, 10th, 25th,75th and 90th percentiles of at least fifty cells each from three CRISPR reactions of three preparations of NHMs. (C) Quantification as in (B) but excluding cells that divided during the 72 hr time period surrounding 24 hr of analysis. (D and E) Time-lapsed holographic phase shift images (D) and quantification (E) of NHMs migrating into scratched region. Yellow line indicates scratch limit at first time point. Error bars represent standard deviation of the mean of three CRISPR reactions of three preparations of NHMs. (F) Quantification of transwell invasion assays where CDKN2A null NHMs and wild-type siblings were required to migrate through high-density basement membrane extract. Box and whisker plots represent mean, 25th and 75th percentiles, minimum and maximum values of five CRISPR reactions of three preparations of NHMs. (G) Single cell motility analysis of CDKN2A null NHMs transduced with and sorted for the indicated vectors. Box and whisker plot represents mean, 10th, 25th, 75th and 90th percentiles of at least fifty cells each from three transductions. Asterisks indicate p value of * <0.05 to ***** <0.000005 from unpaired t-test. N.S. indicates no significant difference. See also Figure S2.
Figure 3
Figure 3. p16INK4A regulates motility independent of driver mutation
(A) Strategy for introducing BRAFV600E point mutation. Center of HDR template is shown (blue) with point mutations causing intended codon change (orange) or silent mutations disrupting sgRNA binding (green) highlighted. sgRNA sequence shown in purple. (B) Western blot detection of BRAFV600E and p16INK4A expression and ERK phosphorylation in engineered NHMs. (C) Population motility analysis of NHMs engineered with BRAFV600E and/or CDKN2A deletion. Error bars represent standard deviation of the mean of three experiments. (D) Comparison of motility in ten melanoma lines with different genetic backgrounds. Lines were classified by activating driver mutation (BRAF, NRAS, CKIT or Wild-type) and CDKN2A status. CDKN2A status was designated as either wildtype and expressed (Wild-type), mono-allelic disruption and expressed (Heterozygous), bi-allelic disruption (Homozygous), or wild-type and silenced (Silenced). Box and whisker plot represents mean, 10th, 25th, 75th and 90th percentiles of forty cells per line. (E) Effect of EF1a-driven p16INK4A expression on motility in CDKN2A null or silenced melanoma lines (left). Effect of shRNA-mediated p16INK4A knockdown on motility in p16INK4A expressing melanoma lines (right). Error bars represent standard deviation of the mean of forty cells per condition. (F) Comparison of the effect of p16INK4A loss on proliferation and motility in ten melanoma lines. Red dots represent comparison of shRNA-mediated p16INK4A knock-down normalized to vector controls in p16INK4A expressing melanoma lines. Green dots represent comparison of vector controls normalized to EF1a-driven p16INK4A expression in CDKN2A null or silenced lines. No significant correlation between proliferation and motility was observed. Asterisks indicate p value of ** <0.005 to **** <0.00005 from unpaired t-test. N.S. indicates no significant difference. See also Figure S3.
Figure 4
Figure 4. p16INK4A loss induces metastasis in WM793 melanoma line
(A) A 500 gene panel, comprised of established cancer genes, was used to sequence the WM793 and 1205Lu cell lines. Point mutations are stratified by their mutant allele frequencies (MAFs) in each cell line as shown. Likely pathogenic mutations are highlighted in red. Data points along the diagonal represent mutations shared between the cell lines, and data points along either axis represent private mutations. (B) Copy number variation between WM793 and 1205Lu cell lines inferred from sequencing depth (top). A focal heterozygous (bottom left, WM793) and homozygous (bottom right, 1205Lu) deletion affecting CDKN2A is highlighted in red. (C) Phylogenic tree representation of the genetic relationship between the primary WM793 and the derivative metastatic 1205Lu cell lines. (D) Schematic of experimental setup for metastasis assay. WM793 cells transduced with either pSICOR-mCherry or pSICOR-shp16INK4A-mCherry or 1205Lu cells transduced with either pHIV-zsGreen or pHIV-p16INK4A-IRES-zsGreen were sorted for fluorescent protein expression and injected subcutaneously into NSG mice (n=5 per condition). Primary tumor volume was monitored and lung metastasis was analyzed after five weeks. Representative H&E stained lung section shows metastasized lesion (right). Red scale bars = 100 µm. (E) Representative lung sections with immunofluorescent stain for human nuclear antigen (HNA). Red scale bars = 100 µm. (F) Quantification of IF images from (E), showing the number of HNA positive cells in the lung for each condition (each group represents 100 quantified sections over 5 mice). Box and whisker plots represent mean, 10th, 25th, 75th & 90th percentiles. (G) PCR amplification of genomic DNA from mouse lungs was performed using human (top) or mouse (bottom) specific primers to detect micro-metastases. All lobes were tested and a representative experiment is shown. (H) Quantification of human specific DNA in murine lung across experiments. Values are absolute concentration of human DNA per sample measured via quantitative PCR. Data represent biopsies from 20 lung lobes over 5 mice per condition. Horizontal bars represent mean. (I) Volume of primary tumors for all mice. Error bars represent standard deviation of the mean. Asterisks indicate p value of ** <0.005 and **** <0.00005 from unpaired t-test. N.S. indicates no significant difference. See also Figure S4.
Figure 5
Figure 5. CDKN2A loss induces transcriptional activation of BRN2
(A) Volcano plot comparing transcriptomes of three independently derived pairs of CDKN2A null NHMs and matched wild-type sibling cells. Differentially expressed transcripts with q-values < 0.05 and log2 fold change > 1.7 are highlighted in aqua. The BRN2 transcript is highlighted in red. (B) Western blot comparing BRN2, RB1, phospho-RB1, CDK4 and p16INK4A expression in three independently derived sets of CDKN2A null engineered NHMs and wild-type sibling cells. (C) Motility of CDKN2A null NHMs after transfection with siBRN2 (top) and representative western blot validation of BRN2 knock-down (bottom). At least fifty cells each from three CRISPR reactions of three preparations of NHMs were quantified. (D) Total cell number of the populations analyzed in (C), three days after transfection, relative to one day after transfection. Error bars represent standard deviation of the mean. (E) Motility of 1205Lu melanoma cells after transfection with siBRN2 (top) and representative western blot validation of BRN2 knockdown (bottom). (F) Quantification of human specific DNA in murine lungs comparing 1205Lu cells expressing either pLKO.1-shControl or pLKO.1-shBRN2 (top) and representative western blot validation of BRN2 knockdown (bottom). Values are absolute concentration of human DNA per sample. Data represent biopsies from 25 lung lobes over 5 mice per condition. All box and whisker plots represent mean, 10th, 25th, 75th & 90th percentiles. Asterisks indicate p value of ** <0.005 and *** <0.0005 from unpaired t-test. N.S. indicates no significant difference.
Figure 6
Figure 6. CDKN2A / p16INK4A loss is associated with invasive melanoma and BRN2 gain
(A) Fraction of nevi or melanomas with mono- or bi-allelic CDKN2A disruption. Melanomas are sub-categorized as melanoma in situ (MIS), thin invasive melanoma (Stage T1), thick invasive melanoma (Stage T2+) and distal metastatic melanoma (obtained from the TCGA public database). (B) Comparison of BRN2 mRNA levels in regions of nevus (n=12) and melanoma (n=19). Box and whisker plots represent mean, 25th and 75th percentiles, minimum and maximum values. (C) p16INK4A and BRN2 mRNA expression from next generation sequencing of microdissected transition cases. Cases where at least one allele contained a focal deletion or point mutation that affected exclusively the CDKN2A gene are designated with a hashtag (#). (D) Representative transition lesion where precursor MIS and descendent invasive components are distinguishable. Dual p16INK4A (brown) and melanocyte marker MelanA (pink) immunohistochemistry (top) and H&E staining (bottom) are shown. (E and F) Shown are serial sections stained for H&E, MelanA/ p16INK4A, MelanA/ Ki67, and BRN2 from representative MIS from nevus (E) and melanoma from MIS (F) regions. Dotted lines indicate borders of MIS (yellow), nevus (blue) and invasive melanoma (green) regions. Yellow arrowheads highlight MelanA and p16INK4A positive cells in the MIS regions. (G) Quantification of the percentage of nevus, MIS, and melanoma cases that stained positive for indicated proteins by IHC. See also Figure S5.
Figure 7
Figure 7. p16INK4A loss transcriptionally activates BRN2 through an E2F1-mediated pathway
(A) Gene set enrichment analysis of three CDKN2A null NHM lines compared to three CDKN2A wild-type NHM lines (Engineered NHMs) or CDKN2A wild-type regions compared to CDKN2A null regions of the clinical cohort (Transition case cohort). # indicates both the NOM p value and FDR q-values for the enrichment score < 0.0005. (B) Expression of firefly luciferase under the control of the POU3F2 promoter normalized to constitutively expressed renilla luciferase in CDKN2A null NHMs (n=10) and wild-type sibling cells (n=6) treated with PBS or indicated concentrations of the CDK4/6 inhibitor PD 0332991 for 24 hr. Box and whisker plots represent mean, 25th and 75th percentiles, minimum and maximum values. (C) RT-qPCR quantification of BRN2 mRNA levels in CDKN2A null NHMs (n=9) and wild-type sibling cells (n=6) treated with PBS and CDK4/6 inhibitor for 24 hr. Box and whisker plots represent mean, 25th and 75th percentiles, minimum and maximum values. (D) Expression of firefly luciferase under the control of the POU3F2 promoter normalized to constitutively expressed renilla luciferase in CDKN2A null NHMs and wild-type sibling cells transfected with control siRNA (siCon) or E2F1 siRNA. Box and whisker plots represent mean, 25th and 75th percentiles, minimum and maximum values of eleven experiments. (E) Motility (top) and western blot validation (bottom) of CDKN2A null NHMs after treatment with PBS or 10 µM of CDK4/6 inhibitor PD 0332991 for 24 hr. At least fifty cells each from three CRISPR reactions of three preparations of NHMs were quantified. Box and whisker plots represent mean, 10th, 25th, 75th & 90th percentiles. (F) Motility (top) and western blot validation (bottom) of CDKN2A null NHMs after transfection with siE2F1. At least fifty cells each from three CRISPR reactions of three preparations of NHMs were quantified. Box and whisker plots represent mean, 10th, 25th, 75th & 90th percentiles. (G) Schematic of BRN2 transcriptional start site (TSS, red) and 0 to 500 bp upstream sequence. Design of PCR products for ChIP experiments (blue horizontal lines) and predicted E2F1 binding sites (orange vertical lines) are indicated. (H) ChIP-qPCR detection of E2F1 binding to the POU3F2 promoter region. Relative amplification of primer sets indicated in (G) precipitated by either anti-E2F1 or anti-IgG antibodies are plotted as percent of input. Error bars represent standard deviation of the mean of four experiments. (I) Representative images of co-immunofluorescent visualization of p-RB1 and BRN2 in invasive melanoma tissue. (J) Single cell quantification of nuclear p-RB1 intensity in eight cases stained as in (I). Cells are stratified as either BRN2 positive (n=103) or negative (n=3877). Box and whisker plots represent mean, 25th and 75th percentiles, minimum and maximum values. Asterisks indicate p value of * <0.05 to **** <0.00005 from unpaired t-test (panels B–H) or Mann-Whitney test (panel J) See also Figure S6.

Comment in

  • BRN 2 Invade.
    Pathria G, Ronai ZA. Pathria G, et al. Cancer Cell. 2018 Jul 9;34(1):1-3. doi: 10.1016/j.ccell.2018.06.010. Cancer Cell. 2018. PMID: 29990495 Free PMC article.

References

    1. Ackermann J, Frutschi M, Kaloulis K, McKee T, Trumpp A, Beermann F. Metastasizing melanoma formation caused by expression of activated N-RasQ61K on an INK4a-deficient background. Cancer Res. 2005;65:4005–4011. - PubMed
    1. Aguirre AJ, Bardeesy N, Sinha M, Lopez L, Tuveson DA, Horner J, Redston MS, DePinho RA. Activated Kras and Ink4a/Arf deficiency cooperate to produce metastatic pancreatic ductal adenocarcinoma. Genes Dev. 2003;17:3112–3126. - PMC - PubMed
    1. Bastian BC. The molecular pathology of melanoma: an integrated taxonomy of melanocytic neoplasia. Annu Rev Pathol. 2014;9:239–271. - PMC - PubMed
    1. Bennett DC. Genetics of melanoma progression: the rise and fall of cell senescence. Pigment Cell Melanoma Res. 2016;29:122–140. - PubMed
    1. Besch R, Berking C. POU transcription factors in melanocytes and melanoma. Eur J Cell Biol. 2014;93:55–60. - PubMed

Publication types

MeSH terms