. 2018 Jul 9;34(1):85-102.e9.
doi: 10.1016/j.ccell.2018.06.007.

PTBP1-Mediated Alternative Splicing Regulates the Inflammatory Secretome and the Pro-tumorigenic Effects of Senescent Cells

Affiliations

PTBP1-Mediated Alternative Splicing Regulates the Inflammatory Secretome and the Pro-tumorigenic Effects of Senescent Cells

Athena Georgilis et al. Cancer Cell. .

Abstract

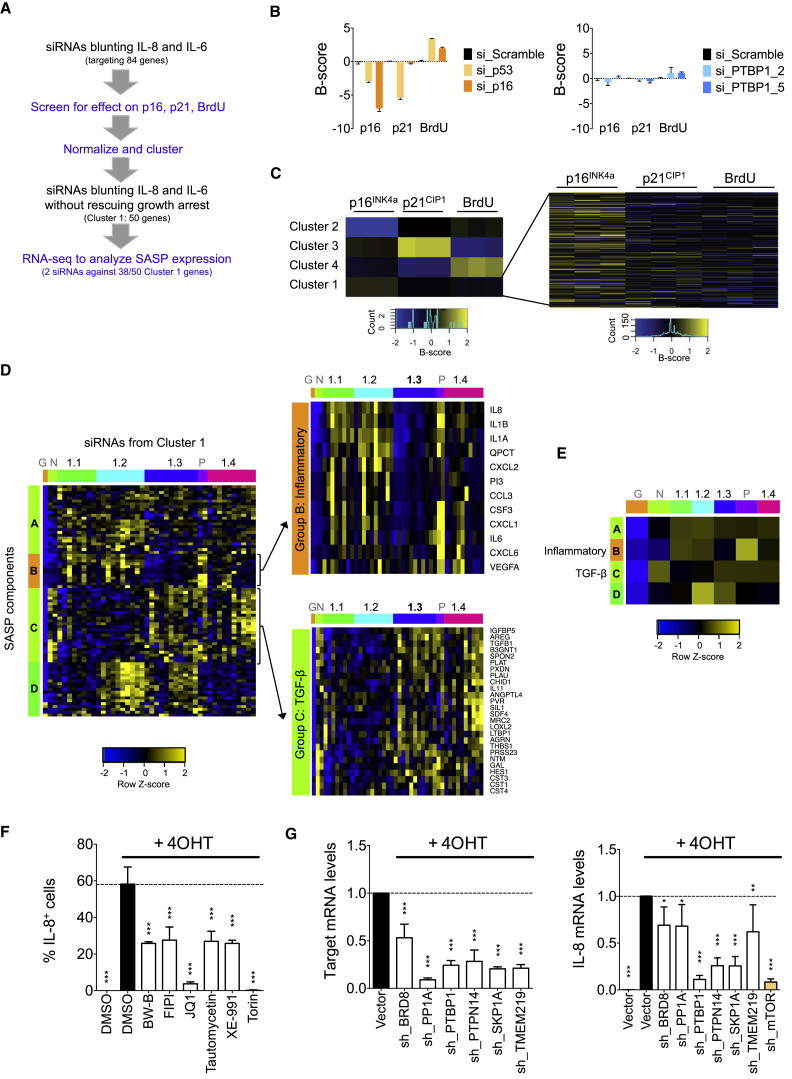
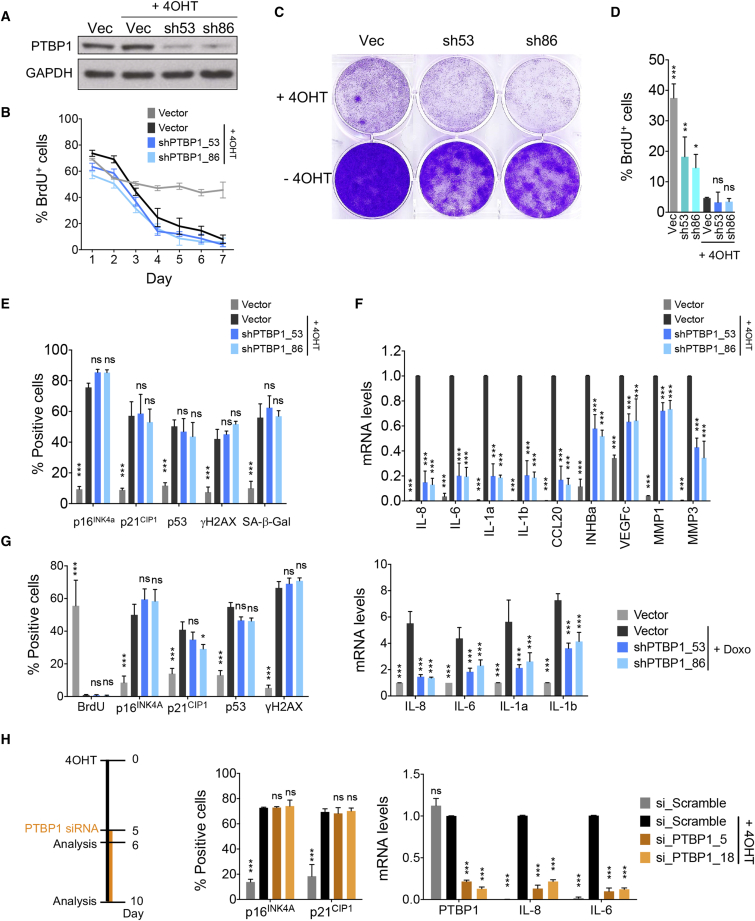
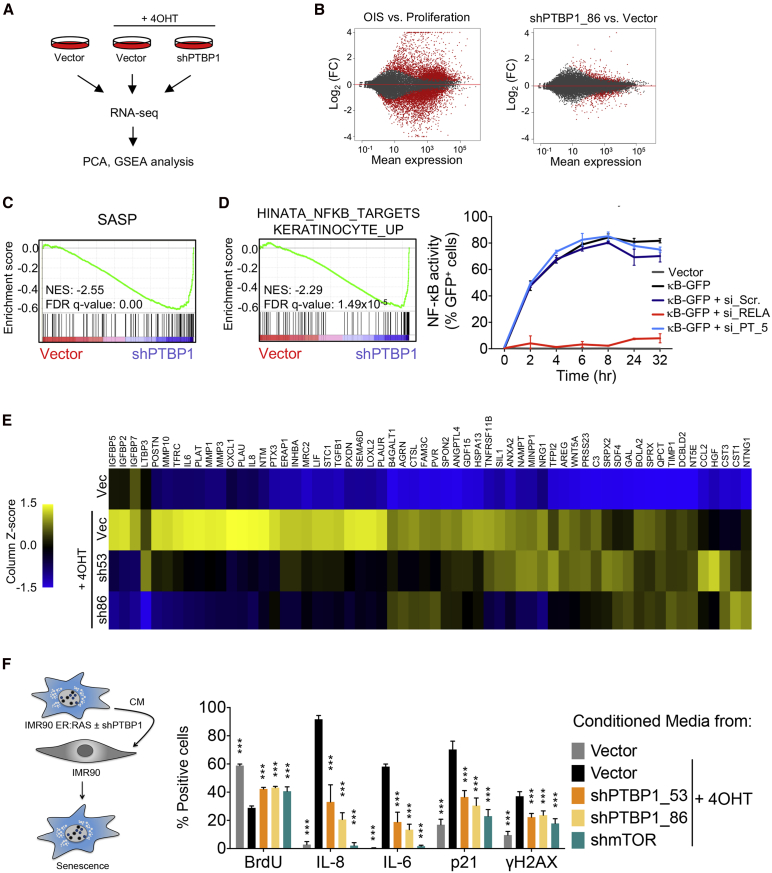
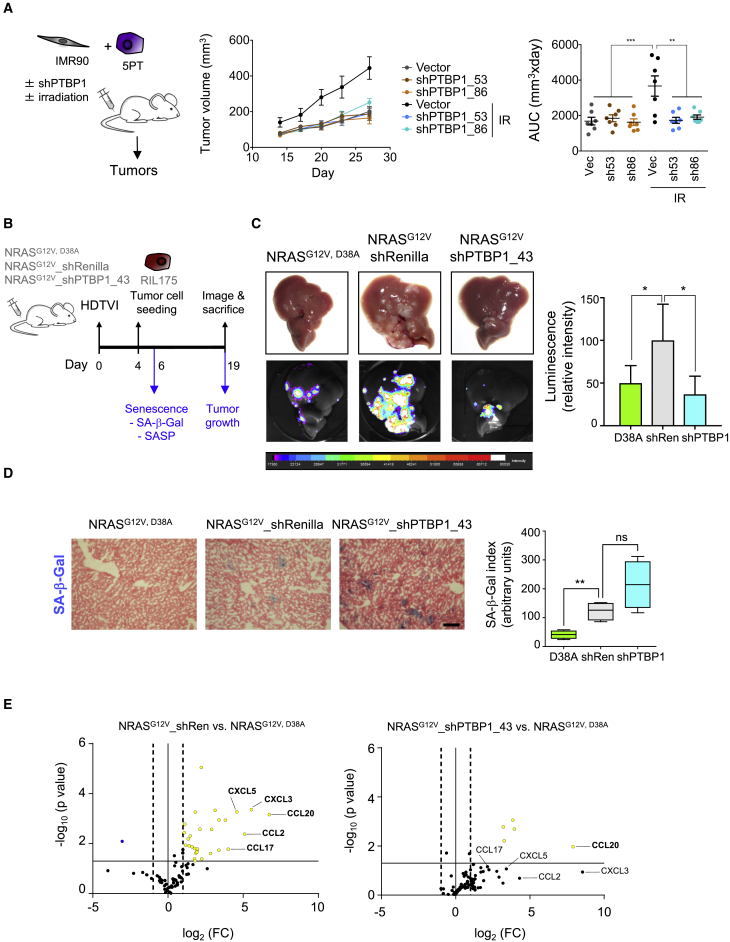
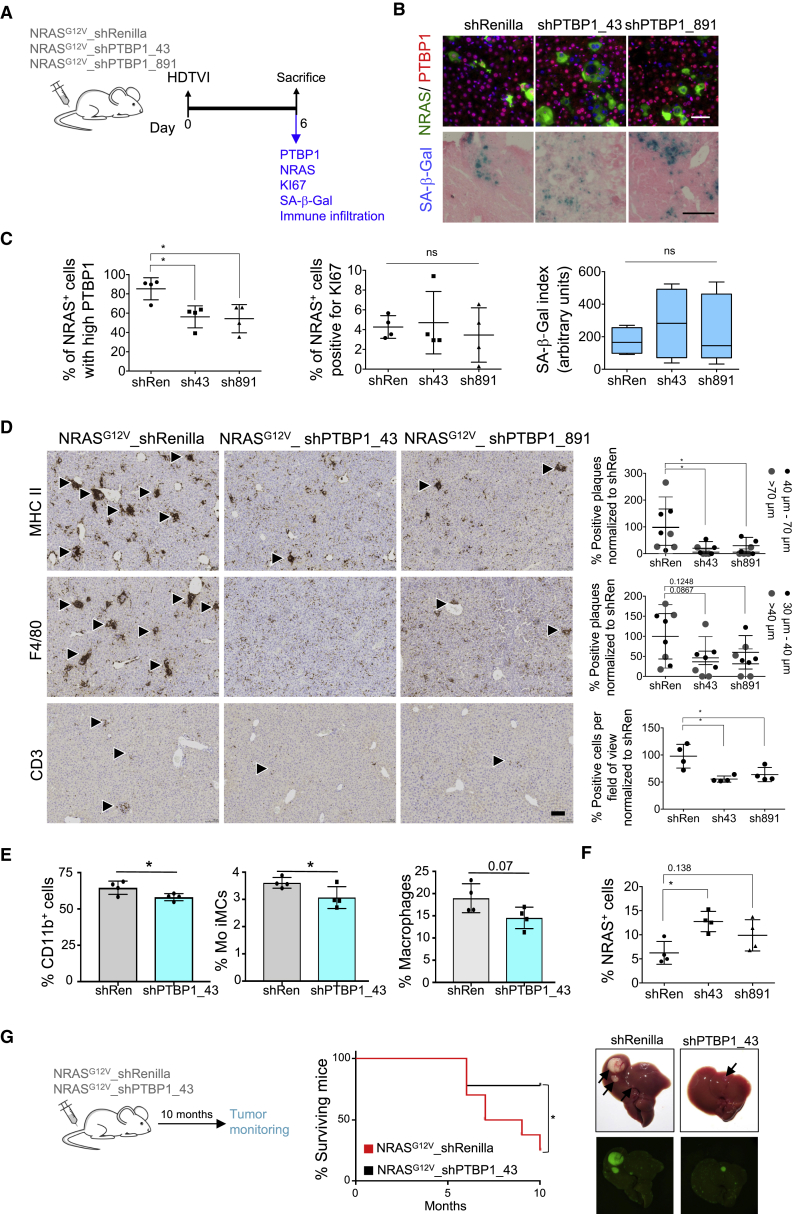
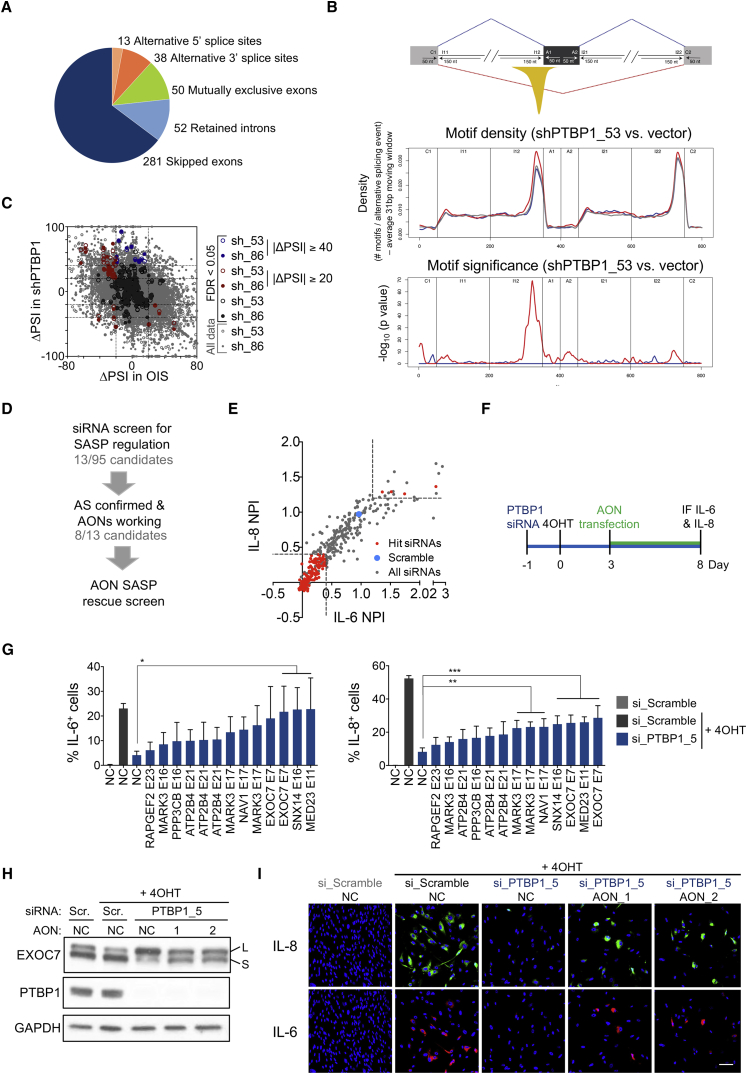
Oncogene-induced senescence is a potent tumor-suppressive response. Paradoxically, senescence also induces an inflammatory secretome that promotes carcinogenesis and age-related pathologies. Consequently, the senescence-associated secretory phenotype (SASP) is a potential therapeutic target. Here, we describe an RNAi screen for SASP regulators. We identified 50 druggable targets whose knockdown suppresses the inflammatory secretome and differentially affects other SASP components. Among the screen candidates was PTBP1. PTBP1 regulates the alternative splicing of genes involved in intracellular trafficking, such as EXOC7, to control the SASP. Inhibition of PTBP1 prevents the pro-tumorigenic effects of the SASP and impairs immune surveillance without increasing the risk of tumorigenesis. In conclusion, our study identifies SASP inhibition as a powerful and safe therapy against inflammation-driven cancer.

Keywords: EXOC7; Oncogene-induced senescence; PTBP1; RNAi screen; SASP; alternative splicing; senescence.


Figures

None
Graphical abstract
Figure 1
Figure 1
An siRNA Screen Identifies Regulators of the SASP (A) Workflow of the SASP siRNA screen. (B) Representative immunofluorescence (IF) images of IL-8 and IL-6 following transfection of indicated siRNAs. Scale bar, 100 μm. (C) IF quantification. Left panel shows single-cell intensity values of IL-8 in a representative sample well of a 96-well plate seeded with cells transfected with indicated siRNAs. Blue line denotes quantification cutoff resulting in the IL-8 percentages shown in the right panel. (D) Screen results. Normalized IL-8 versus normalized IL-6 values for each replicate sample of the screen. Dotted lines indicate cutoffs of ±2 SD of negative scramble controls. siRNA pools were considered “hits” if they showed a B score of >−2 or <3, in at least 2 out of 3 replicates for both IL-6 and IL-8. (E) Volcano plots of the secondary siRNA screen performed in IMR90 ER:RAS cells as per the workflow given in (A). Normalized percent inhibition (NPI) shown as mean of 3 replicates. Three replicate NPI values of each sample siRNA were compared with all scramble siRNA values by unpaired Student's t test. Eighty-four genes met the selection criteria depicted by lines: ≥2 siRNAs with an IL-8 and IL-6 NPI <0.8 and a p value of ≤0.05. Only siRNAs targeting the 84 genes are color coded as “Hit siRNAs”. (F) Summary of SASP screen. Venn diagrams (not to scale) show number of siRNA pools passing the filter and overlap between IL-8 and IL-6. See also Figure S1.
Figure 2
Figure 2
A Subset of Screen Candidates Differentially Regulates the SASP without Affecting the Senescent Growth Arrest (A) Workflow for the categorization of SASP-repressing siRNAs. (B) B scores showing the effects of different siRNAs on the expression of p16 and p21 and incorporation of BrdU. Left: positive controls. Right: two independent siRNAs targeting a gene representative of cluster 1. Data represent mean ± SD (n = 3). (C) K-means clustering of the SASP-repressing siRNAs. Heatmap of cluster 1 showing B-score expression for each replicate experiment (column). Each row reflects the measures from one siRNA. (D) Heatmap showing the differential regulation of SASP components by siRNAs targeting cluster 1 candidates. IMR90 ER:RAS cells were independently transfected with two siRNAs targeting 38 of the cluster 1 candidates. RNA-seq was performed and samples clustered according to the expression of SASP components. G: growing cells including cells transfected with scramble siRNA but not treated with 4OHT (no SASP induction), N: grouping senescent cells transfected with siRNAs targeting CEBPβ and RELA (preventing the induction of many SASP components), Pos: cluster grouping senescent cells transfected with scramble siRNA or a siRNA targeting p16 (showing a “maximum” SASP induction). Each column represents an average of two siRNAs per gene with three replicates each. Left: hierarchical cluster showing the siRNA subclusters (colored horizontally) and the clustering of SASP components in groups (colored vertically). Right: zoom-in showing the effect of siRNAs on indicated SASP groups. (E) Summary heatmap derived by averaging the heatmap presented in (D) showing differential regulation of SASP components. (F) IL-8 IF analysis 8 days after senescence induction of IMR90 ER:RAS cells treated with indicated drugs targeting cluster 1 genes. Torin 1 was included as control. Data represent mean ± SD (n = 3); ∗∗∗p < 0.001. Comparisons with DMSO + 4OHT. (G) Expression levels of each gene or IL-8 measured by qRT-PCR 6 days after 4OHT induction of IMR90 ER:RAS cells stably infected with an empty pGIPZ vector (Vector) or pools of four pGIPZ-based shRNAs against the indicated candidate SASP regulators. An shRNA targeting mTOR (sh_mTOR) was included as control. Data represent mean ± SD (n = 3); p < 0.05, ∗∗p < 0.01, ∗∗∗p < 0.001. Comparisons with Vector + 4OHT. One-way ANOVA (Bonferroni’s test) was used in (F) and (G) to calculate statistical significance. See also Figure S2 and Table S1.
Figure 3
Figure 3
The Splicing Factor PTBP1 Regulates the SASP without Affecting Growth Arrest (A) Immunoblot of protein extracts 6 days after 4OHT induction of IMR90 ER:RAS cells infected with indicated pGIPz shRNA vectors targeting PTBP1. Vec, empty vector. (B) Quantification of cells positive for BrdU incorporation at indicated days after 4OHT treatment. Data represent mean ± SD (n = 3). (C) Crystal violet-stained 6-well dishes of cells fixed 12 days following 4OHT treatment. (D) Quantification of BrdU incorporation 8 days after 4OHT treatment, 15 days after empty vector or PTBP1 shRNA infection. Data represent mean ± SD (n = 3); p < 0.05, ∗∗p < 0.01, ∗∗∗p < 0.001; ns, not significant. Comparisons with Vec + 4OHT. One-way ANOVA (Dunnett's test). (E) Quantification of cells positive for the senescence markers p16, p21, p53, and γH2AX 6 days after 4OHT and β-galactosidase 8 days after 4OHT by IF analysis. Data represent mean ± SD (n = 3). ∗∗∗p < 0.001; ns, not significant. Comparisons with Vector + 4OHT, two-way ANOVA (Bonferroni’s test). (F) Expression levels of the indicated SASP genes assessed by qRT-PCR 6 days after 4OHT induction normalized and compared with Vector + 4OHT. Data represent mean ± SD (n = 3); ∗∗∗p < 0.001, two-way ANOVA (Dunnett's test). (G) IMR90 WT cells were infected with indicated pGIPZ empty vector or PTBP1 shRNAs and treated with doxorubicin to induce senescence. Left: IF analysis of the indicated senescence markers 6 days after doxorubicin induction. Right: mRNA analysis of the indicated genes by qRT-PCR (right) 8 days after doxorubicin induction normalized to the Vector + doxycycline (Doxo) condition. Data represent mean ± SD (n = 3). p < 0.05, ∗∗∗p < 0.001; ns, not significant. Comparisons with Vector + Doxo, two-way ANOVA (Dunnett's test). (H) IMR90 ER:RAS cells were transfected with two independent siRNAs targeting PTBP1 at day 5 after senescence induction as indicated in the scheme (left). Senescence establishment at day 6 was monitored by IF analysis (middle). Knockdown of PTBP1 and the effect on the indicated genes was assessed by qRT-PCR 5 days after siRNA transfection, and 10 days after senescence induction (right), normalized to the si_Scramble + 4OHT condition. Data represent mean ± SD (n = 3). ∗∗∗p < 0.001; ns, not significant. Comparisons with si_Scramble + 4OHT, two-way ANOVA (Dunnett's test). See also Figure S3.
Figure 4
Figure 4
PTBP1 Regulates a Pro-inflammatory Subset of the SASP and Its Paracrine Functions (A) Experimental design for the global transcriptional profiling of IMR90 ER:RAS cells (6 days after 4OHT induction) presented in (B) to (D). (B) Subset of senescence-specific transcripts affected by PTBP1 knockdown. Mean expression (average of the normalized read counts for 3 replicates) in relation to log2 (FC) for the indicated comparison. Significantly changing genes are highlighted in red. (C) SASP GSEA signature in PTBP1 depleted cells + 4OHT compared with cells expressing empty vector + 4OHT. (D) NF-κB GSEA signatures in PTBP1 depleted cells + 4OHT compared with cells expressing empty vector + 4OHT (left). GFP analysis at indicated time points following TNFα (50 ng/mL) treatment in IMR90 cells expressing a κB reporter (κB-GFP) and transfected with indicated siRNAs (right). Data represent mean ± SD (n = 3). (E) Mass spectrometry analysis of CM collected from IMR90 ER:RAS cells (empty vector or two PTBP1-targeting shRNAs) 6 days after senescence induction with 4OHT. Differential secretion of the listed SASP factors shown as mean (n = 3). (F) Experimental design to assess the effect of PTBP1 loss on secreted factors responsible for inducing paracrine senescence (left). IF analysis of the senescence markers in IMR90 cells treated for 3–4 days with CM from the indicated IMR90 ER:RAS cells. Data represent mean ± SD (n = 3); each replicate experiment corresponds to independent generation of CM. ∗∗∗p < 0.001. Comparisons with cells treated with CM from Vector + 4OHT, two-way ANOVA (Dunnett's test). See also Figure S4.
Figure 5
Figure 5
PTBP1 Knockdown Inhibits the Tumor-Promoting Functions of the SASP (A) Tumor growth induced by senescent cells in a xenograft mouse model following PTBP1 knockdown. Left: experimental design. Middle: tumor growth monitored by measuring the volume at the indicated days. Graph symbols are mean volumes of all the mice in the indicated condition. Right: area under the curve (AUC) of the tumor growth for each mice. Data represent mean ± SD (n = 7 per group). ∗∗p < 0.01, ∗∗∗p < 0.001, one-way ANOVA (Bonferroni’s test). (B–E) Tumor growth in an orthotopic model of advanced liver cancer following PTBP1 knockdown. (B) Experimental design. (C) Representative images of livers and luciferase imaging (left) and quantification of luciferase intensity (right) shown as mean ± SD (n = 4 mice per group). p < 0.05, one-way ANOVA (Bonferroni’s test). (D) Representative images and quantification of SA-β-Galactosidase expression. Scale bar: 50 μm. Plots show median (line), upper and lower quartiles (boxes), and lines extending to highest and lowest observation (whiskers), ∗∗p < 0.01; ns, not significant; one-way ANOVA (Bonferroni’s test). (E) qRT-PCR-based quantification of SASP components shown as log2 (FC) between the conditions indicated at the top. See also Figure S5.
Figure 6
Figure 6
PTBP1 Knockdown Impairs Senescence Surveillance without Increasing Tumorigenesis (A–F) Senescence surveillance following PTBP1 knockdown. (A) Experimental design. (B) Representative IF images of NRAS, PTBP1 and SA-β-galactosidase expression in livers. Scale bars, 50 μm. (C) Quantification of high PTBP1-expressing or Ki67+ among NRAS+ cells by IF. Quantification of SA-β-gal expression is also shown (right). Plots show median (line), upper and lower quartiles (boxes), and lines extending to highest and lowest observation (whiskers). Data represent mean ± SD (n = 4). p < 0.05; ns, not significant. Comparisons with NRASG12V-shRenilla, one-way ANOVA (Dunnett's test). (D) Representative IHC images (left) and densitometric quantification (right) of indicated immune cell markers. For MHCII+ and F4/80+ areas, arrowheads indicate characteristic myeloid aggregate formation that develops as a consequence of NRASG12V-driven senescence in the liver. Smaller aggregates are separated from larger aggregates based on diameter (comparison shown in Figures S6A and S6B) and are depicted as black and gray symbols, respectively. For CD3+ staining, arrowheads indicate positive cells and are quantified as number of positive cells per counting area (10 mm2). Scale bar, 100 μm. Data represent mean ± SD (n = 4). p < 0.05. Comparisons with NRASG12V-shRenilla, one-way ANOVA (Bonferroni’s test). (E) Quantification of indicated infiltrating immune cells by flow cytometry. Gating strategy shown in Figures S6C and S6D. Data represent mean ± SD (n = 4); p < 0.05. Comparisons with NRASG12V-shRenilla, one-way ANOVA (Bonferroni’s test). (F) Quantification of NRAS+ cells. Data represent mean ± SD (n = 4); p < 0.05. Comparisons with NRASG12V-shRenilla, one-way ANOVA (Bonferroni’s test). (G) Long-term tumorigenesis in WT mice upon injection with indicated transposon-based plasmids. Left: experimental design. Middle: Kaplan-Meier survival curves. Right: NRASG12V_shRen (n = 10) and NRASG12V_shPTBP1 (n = 9). p < 0.05 by log-rank (Mantel-Cox) test. Representative images of macroscopically visible GFP+ tumor nodules (>1 mm, black arrows) at endpoint. See also Figure S6.
Figure 7
Figure 7
Regulation of Alternative Splicing by PTBP1 Controls the SASP (A) Distribution of the five types of AS events detected in senescent cells compared with proliferating cells by RNA-seq (see Figure 4A). (B) PTBP1 RNA binding motifs across alternative exons upon PTBP1 knockdown. Top: scheme. Motifs are mapped to potential regulatory sequences around the target alternatively spliced exon (dark-gray box). The yellow peak represents the area of predicted enrichment of PTBP1 binding responsible for exon splicing repression (red line), with no role known for PTBP1 in exon splicing enhancement (dashed blue line). Middle: motif density for exons with inclusion increasing (putatively repressed, red), decreasing (putatively enhanced, blue), or not altered (not regulated, gray) upon PTBP1 knockdown. Bottom: statistical significance for local motif enrichment in putatively repressed (red) and enhanced (blue) exons. (C) Exon-skipping events and ΔPSI cutoffs used for shortlisting events changing due to loss of PTBP1. A stricter cutoff was used for events changing upon PTBP1 loss but not affected upon senescence. (D) Strategy to link PTBP1-driven alternative splicing and SASP regulation. (E) Ninety-five PTBP1-spliced genes were targeted with four siRNAs and screened for IL-8 and IL-6 regulators as described in Figure 1. NPI shown as mean of three replicates and cutoffs for hit selection (dotted lines). Hit siRNAs represent siRNAs targeting genes scoring with ≥2 siRNAs in both readouts. (F) Experimental design of (G). (G) IMR90 ER:RAS cells were transfected with AONs either not targeting (NC) or targeting the indicated exons. IF analysis of IL-6 (left) and IL-8 (right). Data represent mean ± SD (n = 4). p < 0.05, ∗∗p < 0.01, ∗∗∗p < 0.001. Comparisons with NC, si_PTBP1_5 + 4OHT, one-way ANOVA (Dunnett's test). (H and I) Effect of AONs targeting EXOC7 exon 7 splicing on the SASP downregulation caused by PTBP1 knockdown. Timeline as in (F). (H) Immunoblot of protein extracts of IMR90 ER:RAS cells 5 days after 4OHT induction. (I) Representative IF images of IL-8 8 days after 4OHT induction. Scale bar, 100 μm. See also Figure S7 and Tables S2 and S3.
Figure 8
Figure 8
PTBP1 Regulates Alternative Splicing of EXOC7 to Control the SASP (A) SASP expression and EXOC7 isoform switching following PTBP1 overexpression in IMR90 cells. Immunoblot of protein extracts (left) and mRNA analysis by qRT-PCR (right) 2 days after induction of PTBP1 expression with doxycycline (Dox). Normalized and compared with Vec − Dox. Data represent mean ± SD (n = 5). ∗∗∗p < 0.001; ns, not significant; one-way ANOVA (Dunnett's test). (B) Comparison of SASP production following overexpression of EXOC7-S (S) and EXOC7-L (L) 4 days after 4OHT and doxycycline treatment of IMR90 ER:RAS cells by immunoblot analysis. v, empty vector. (C) Effect of EXOC7-S on the SASP downregulation caused by PTBP1 knockdown. Representative IF images of IL-8 of IMR90 ER:RAS cells without (−) and with doxycycline treatment (EXOC7 S) 8 days after 4OHT induction. Scale bar, 100 μm. (D and E) Effect of EXOC7 depletion on the SASP (D). Left: experimental design. Right: mean expression (average of the normalized read counts for 3 replicates) in relation to log2(FC) for the indicated comparison. Significantly changing genes are highlighted in red. (E) Correlation between the expression of SASP genes upon PTBP1 and EXOC7 siRNA-mediated knockdown. (F) Comparison of EXOC7-S and EXOC7-L phosphorylation assessed by EXOC7 immunoprecipitation followed by immunoblotting. Experimental details as in (B). (G) Comparison of EXOC7-S and EXOC7-L localization to the plasma membrane in proliferating and senescent cells. Quantification of cells showing the diffuse EXOC7 pattern. Data represent mean ± SD (n = 3). p < 0.01, comparing EXOC7-S + DMSO with either Vector + DMSO or EXOC7-L + DMSO; p < 0.05, comparing EXOC7-S + 4OHT with either Vector + 4OHT or EXOC7-L + 4OHT; two-way ANOVA (Bonferroni’s test). Experimental details as in (B). Scale bar, 100 μm. (H) PTBP1 expression versus EXOC7 exon 7 inclusion in data from the Genotype-Tissue Expression (GTEx) project. (I) Top 11 hallmarks with normalized enrichment score >2 and false discovery rate <0.05 in genes with expression positively correlating with EXOC7 exon 7 skipping in GTEx samples. (J) Effect of EXOC7 knockdown on the immune surveillance response. Top: experimental design. Bottom: quantification of NRAS+ mouse hepatocytes, CXCL5 expression in NRAS+ hepatocytes, and infiltrated MHC II+ and CD3+ cells 6 days after transposon delivery of NRASG12V_shRenilla (n = 5), NRASG12V_shPTBP1 (n = 4), or NRASG12V_EXOC7 (n = 4). Data represent mean ± SD. p < 0.05, ∗∗p < 0.01, ∗∗∗p < 0.001. Comparisons with NRASG12V_shRenilla, one-way ANOVA (Bonferroni’s test). See also Figure S8.

Comment in

References

    1. Aarts M., Georgilis A., Beniazza M., Beolchi P., Banito A., Carroll T., Kulisic M., Kaemena D.F., Dharmalingam G., Martin N. Coupling shRNA screens with single-cell RNA-seq identifies a dual role for mTOR in reprogramming-induced senescence. Genes Dev. 2017;31:2085–2098. - PMC - PubMed
    1. Acosta J.C., O'Loghlen A., Banito A., Guijarro M.V., Augert A., Raguz S., Fumagalli M., Da Costa M., Brown C., Popov N. Chemokine signaling via the CXCR2 receptor reinforces senescence. Cell. 2008;133:1006–1018. - PubMed
    1. Acosta J.C., Banito A., Wuestefeld T., Georgilis A., Janich P., Morton J.P., Athineos D., Kang T.W., Lasitschka F., Andrulis M. A complex secretory program orchestrated by the inflammasome controls paracrine senescence. Nat. Cell Biol. 2013;15:978–990. - PMC - PubMed
    1. Barbosa-Morais N.L., Irimia M., Pan Q., Xiong H.Y., Gueroussov S., Lee L.J., Slobodeniuc V., Kutter C., Watt S., Colak R. The evolutionary landscape of alternative splicing in vertebrate species. Science. 2012;338:1587–1593. - PubMed
    1. Barradas M., Anderton E., Acosta J.C., Li S., Banito A., Rodriguez-Niedenfuhr M., Maertens G., Banck M., Zhou M.M., Walsh M.J. Histone demethylase JMJD3 contributes to epigenetic control of INK4a/ARF by oncogenic RAS. Genes Dev. 2009;23:1177–1182. - PMC - PubMed

Publication types

MeSH terms

Substances

LinkOut - more resources