Review
. 2019 Jan 15:185:664-684.
doi: 10.1016/j.neuroimage.2018.07.004. Epub 2018 Jul 7.

Resting-state functional MRI studies on infant brains: A decade of gap-filling efforts

Affiliations
Review

Resting-state functional MRI studies on infant brains: A decade of gap-filling efforts

Han Zhang et al. Neuroimage. .

Abstract

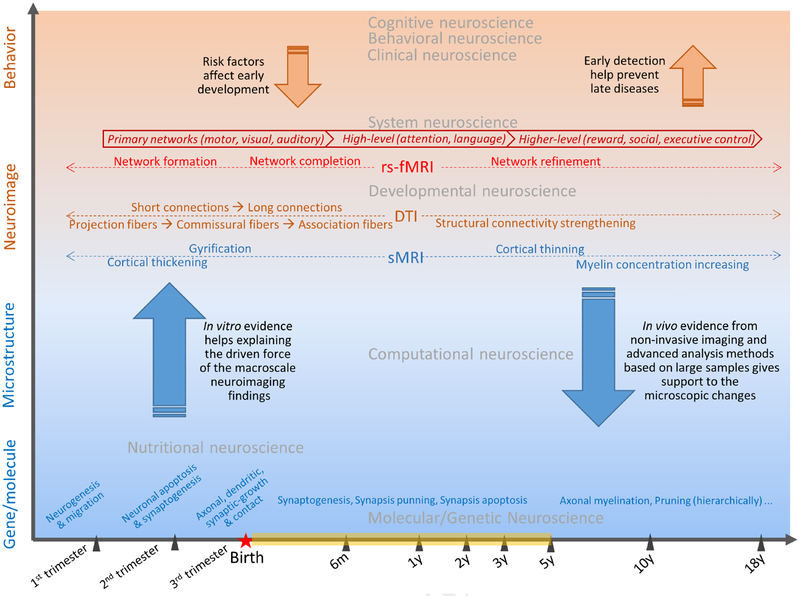
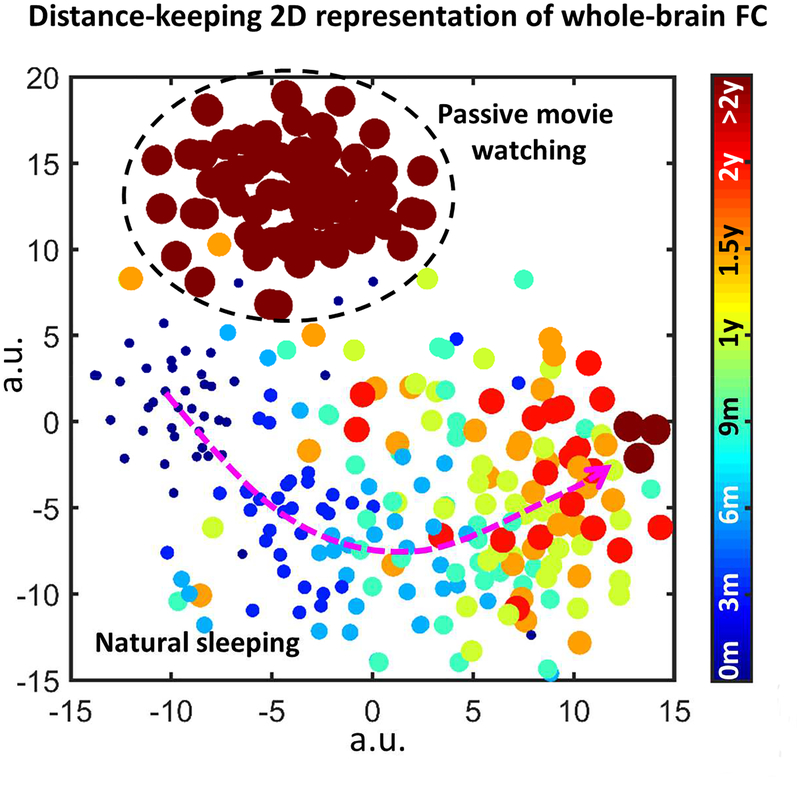
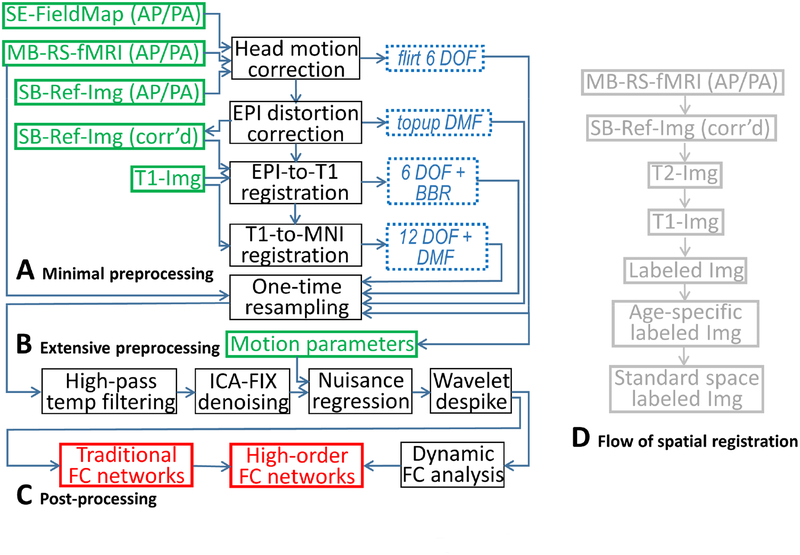
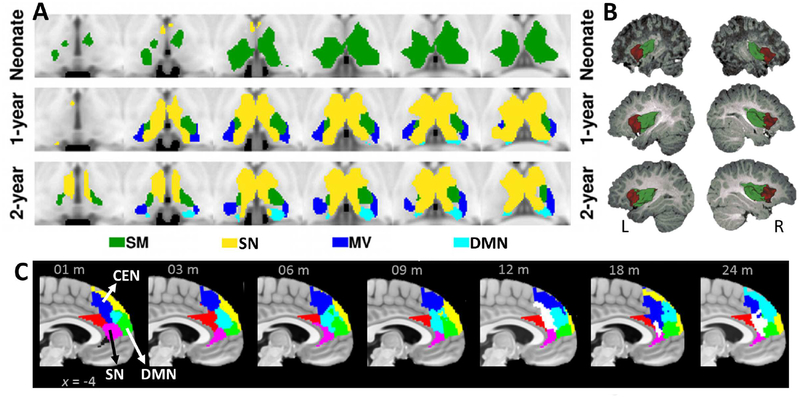
Resting-state functional MRI (rs-fMRI) is one of the most prevalent brain functional imaging modalities. Previous rs-fMRI studies have mainly focused on adults and elderly subjects. Recently, infant rs-fMRI studies have become an area of active research. After a decade of gap filling studies, many facets of the brain functional development from early infancy to toddler has been uncovered. However, infant rs-fMRI is still in its infancy. The image analysis tools for neonates and young infants can be quite different from those for adults. From data analysis to result interpretation, more questions and issues have been raised, and new hypotheses have been formed. With the anticipated availability of unprecedented high-resolution rs-fMRI and dedicated analysis pipelines from the Baby Connectome Project (BCP), it is important now to revisit previous findings and hypotheses, discuss and comment existing issues and problems, and make a "to-do-list" for the future studies. This review article aims to comprehensively review a decade of the findings, unveiling hidden jewels of the fields of developmental neuroscience and neuroimage computing. Emphases will be given to early infancy, particularly the first few years of life. In this review, an end-to-end summary, from infant rs-fMRI experimental design to data processing, and from the development of individual functional systems to large-scale brain functional networks, is provided. A comprehensive summary of the rs-fMRI findings in developmental patterns is highlighted. Furthermore, an extensive summary of the neurodevelopmental disorders and the effects of other hazardous factors is provided. Finally, future research trends focusing on emerging dynamic functional connectivity and state-of-the-art functional connectome analysis are summarized. In next decade, early infant rs-fMRI and developmental connectome study could be one of the shining research topics.

Keywords: Autism; Baby connectome project; Brain network; Children; Connectome; Development; Dynamic functional connectivity; Functional MRI; Functional connectivity; Graph-theoretical analysis; Infant; Neonate; Resting state; Toddler.


Conflict of interest statement

The authors claim no conflict of interest.

Figures

Figure 1.
Figure 1.
A big picture of rs-fMRI-based early brain developmental study in the context of temporal (horizontal axis) and spatial dimensions (vertical axis) with different scales.
Figure 2.
Figure 2.
Influence of the age and scanning status on the whole-brain functional connectivity (FC). The result is from unpublished data, where longitudinal rs-fMRI images were obtained from subjects at the ages of 2 weeks, 3 months, 6 months, 9 months, 12 months, 18 months, 24 months, 3 years, 4 years, 5 years and 6 years old, enrolled in the “Multi-visit Advanced Pediatric brain imaging study for characterizing structural and functional development (MAP Study)”. Whole-brain FC is calculated based on Pearson’s correlation between every pair of 268 brain regions (Shen et al., 2013). Rs-fMRI were obtained during natural sleep for the scans at 24 months old or earlier, and during passive movie watching for the scans at 3 years old or later. T-Distributed Stochastic Neighbor Embedding (t-SNE) was used to represent the distribution of the whole-brain FC patterns in a 2D plane, where each dot represents one subject of a certain age, and their distance in the 2D plane is proportional to the high-dimensional Euclidean distance between the 268 × 268 FC features. Different colors and dot sizes indicate different ages. Dark red indicates the FC patterns during passive movie watching, while others indicate the FC patterns during natural sleeping. Clear clustering pattern can be identified, indicating systematic differences between the functional connectome in different states and at different ages.
Figure 3.
Figure 3.
The proposed full-automated infant rs-fMRI processing pipeline. The pipeline is recommended to process BCP rs-fMRI data, which uses an HCP-style rs-fMRI protocol with high spatial and temporal resolutions. There are three modules in the pipeline: minimal preprocessing (A), extensive preprocessing (B), and post-processing (C). During minimal preprocessing, the flow of spatial registration can be combined into a single deformation field and directly used to warp raw infant rs-fMRI data (D). DOF: degree of freedom; DMF: deformation field; SE: spin echo; AP/PA: phase-encoding direction from anterior to posterior and that with the opposite direction; MB: multiband; SB: single-band (traditional EPI); Ref-Img: single-band, single volume EPI data used as a reference during the spatial registration; BBR: boundary-based registration; ICA-FIX, FLIRT, and TOPUP are all the functions in FSL; Labeled Img: segmented anatomical image with each voxel labeled as grey matter, white matter, or cerebrospinal fluid. See main text for details.
Figure 4.
Figure 4.
The functional connectivity (FC)-based parcellation of the brain regions and their developmental changes. (A) The functional parcellation result in the thalamus (different colors indicate different thalamocortical FC). Adapted from Alcauter et al. Journal of Neuroscience 2014 (Alcauter et al., 2014), modified with permission. (B) The functional parcellation result in the insular lobe. Adapted from Alcauter et al. Cerebral Cortex 2015 (Alcauter et al., 2015a), modified with permission. (C) The functional parcellation results in the medial prefrontal cortex based on independent component analysis, with different colors indicating different sub-regions (three of them are respectively connected with the CEN, SN, and DMN). Adapted from Zhang et al. Connectomics in NeuroImaging (CNI) 2017 (Zhang et al., 2017c), modified with permission. SM: sensorimotor network; SN: salience network; MV: medial visual network; DMN: default mode network; CEN: central executive network; m: month.
Figure 5.
Figure 5.
Raw resting-state fMRI data from one exemplary subject aged 18 days (at the neonate stage). Different phase encoding scans (AP and PA) are acquired for future distortion correction.
Figure 6.
Figure 6.
Multimodal imaging data from BCP. (A) Raw T1-weighted, T2-weighted and rs-fMRI data (phase encoding direction: AP) from the same neonate with a chronological age of 18 days as Figure 5. (B) Functional connectivity results from another infant with a chronological age of 190 days (~ 6 months old). Both seed-based correlation (with the seeds put at the left primary motor, left primary visual and posterior cingulate cortex for sensorimotor, visual and the default mode networks, FC maps threshold: r > 0.4) and independent component analysis (ICA, threshold: z > 2) results were shown. Red areas indicate the results from the multiband rs-fMRI data with AP phase encoding direction. Green areas represent the results from the multiband rs-fMRI data with PA phase encoding direction. Yellow areas show their overlap. Of note, ICA results in two sensorimotor networks in both hemispheres in separate components and they were merged together to form the complete sensorimotor network.
Figure 7.
Figure 7.
The diagram of traditional FC or low-order FC (LOFC, A), and different metrics of high-order FC (HOFC, B-D). Topographical profile-based HOFC (tHOFC) is illustrated in (B) and its variant, associated HOFC (aHOFC), is illustrated in (C). For simplicity, only a few regions are used to demonstrate the LOFC and the HOFCs. The LOFC profiles of each region in (B) involve five brain regions. Different line width indicates different connectivity strength. The black lines indicate LOFC, the blue curves represent tHOFC, and the red curve depicts aHOFC. The calculation of dynamic FC-based HOFC (dHOFC) is illustrated in (D). With a further correlation of dynamic FC time series, dHOFC geometrically increases the amount of information compared to the LOFC network. An n×n LOFC matrix generates a larger n×(n−1) × n×(n−1) dLOFC matrix. After calculating the dynamic FC for two pairs of brain regions (i and l, and j and k, respectively), two dynamic FC time series are further correlated to produce one dHOFC value among the four regions. The figure is adopted from Zhang et al. 2017 Front Neurosci (Zhang et al., 2017a).
Figure 8.
Figure 8.
State-of-the-art analysis methods that are promising in future brain functional development study. (A-D) Functional gradients that resemble the developmental order, adapted from Margulies et al. PNAS 2016 (Margulies et al., 2016), modified with permission. (E-F) The multi-layer network constructed based on multiple frequency-specific networks, adapted from De Domenico et al. Front Neurosci 2016 (De Domenico et al., 2016). (G-H) The typical sliding window-based dynamic FC time series and the temporal network analysis, adapted from Thompson et al. Network Neuroscience 2017 (Thompson et al., 2017). (I) Different across-layer link types: full connected and neighboring connection, adapted from Mucha et al. Science 2010 (Mucha et al., 2010). (J-K) Two different network topological organizations, adapted from Bassett et al. PLoS Comput Biol (Bassett et al., 2013), modified with permission.
Figure 9.
Figure 9.
Consistently suggested functional developmental patterns or trajectories for various FC and FC network (FCN) metrics from birth to 5 years old (see main text for more details). Subplot (A) is for developmental trajectories of intra- and inter-network FC, with that of FC network modularity. Subplot (B) depicts short- and long-range FC between primary and higher-level association regions. Subplot (C) is for FCN properties, including local and global efficiency, and both of the developmental trajectories fall in the small-world zone. Subplot (D) depicts the trajectories of inter- and intra-hemispheric FC. For inter-hemispheric FC, both FC between homotopic regions and between non-homotopic regions are plotted.

References

    1. Abrol A, Chaze C, Damaraju E, Calhoun VD, 2016. The chronnectome: Evaluating replicability of dynamic connectivity patterns in 7500 resting fMRI datasets. Conf Proc IEEE Eng Med Biol Soc 2016, 5571–5574. - PubMed
    1. Abrol A, Damaraju E, Miller RL, Stephen JM, Claus ED, Mayer AR, Calhoun VD, 2017. Replicability of time-varying connectivity patterns in large resting state fMRI samples. Neuroimage 163, 160–176. - PMC - PubMed
    1. Alcauter S, Lin W, Keith Smith J, Gilmore JH, Gao W, 2015a. Consistent anterior-posterior segregation of the insula during the first 2 years of life. Cereb Cortex 25, 1176–1187. - PMC - PubMed
    1. Alcauter S, Lin W, Smith JK, Goldman BD, Reznick JS, Gilmore JH, Gao W, 2015b. Frequency of spontaneous BOLD signal shifts during infancy and correlates with cognitive performance. Dev Cogn Neurosci 12, 40–50. - PMC - PubMed
    1. Alcauter S, Lin W, Smith JK, Short SJ, Goldman BD, Reznick JS, Gilmore JH, Gao W, 2014. Development of thalamocortical connectivity during infancy and its cognitive correlations. J Neurosci 34, 9067–9075. - PMC - PubMed

Publication types