Multicenter Study
. 2018 Jul 15;14(7):1143-1151.
doi: 10.5664/jcsm.7212.

Craniofacial Phenotyping in Chinese and Caucasian Patients With Sleep Apnea: Influence of Ethnicity and Sex

Affiliations
Multicenter Study

Craniofacial Phenotyping in Chinese and Caucasian Patients With Sleep Apnea: Influence of Ethnicity and Sex

Kate Sutherland et al. J Clin Sleep Med. .

Abstract

Study objectives: Craniofacial abnormalities are a risk factor for obstructive sleep apnea (OSA). We have previously shown that phenotypic information derived from craniofacial photographs predict OSA in sleep clinic populations. However, there are likely ethnic and sex differences in craniofacial phenotypes related to OSA. We aimed to assess the use of craniofacial photography to identify interactions between OSA, ethnicity, and sex in craniofacial phenotype.

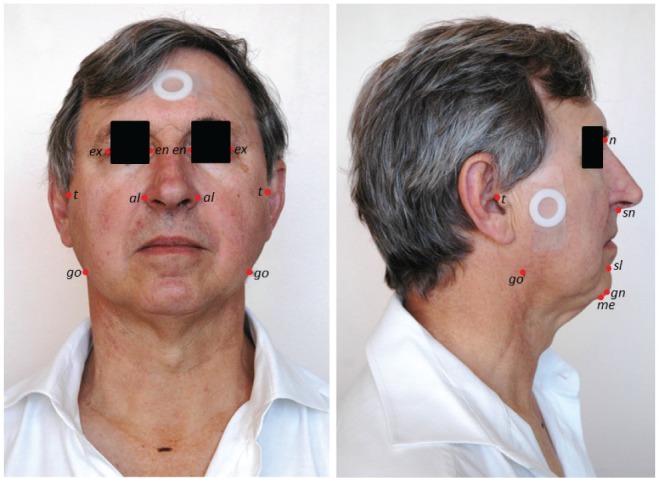
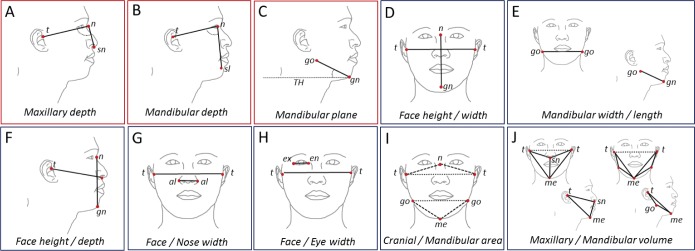
Methods: Frontal and profile craniofacial photographs were analyzed from two sleep clinic populations of different ethnicity (Hong Kong Chinese, Australian Caucasians). OSA was defined as apnea-hypopnea index (AHI) > 10 events/h. Ten craniofacial measurements (three angles relating to jaw position and seven ratios describing proportions of the face) were examined for interactions between OSA status and sex or ethnicity) using factorial analysis of variance.

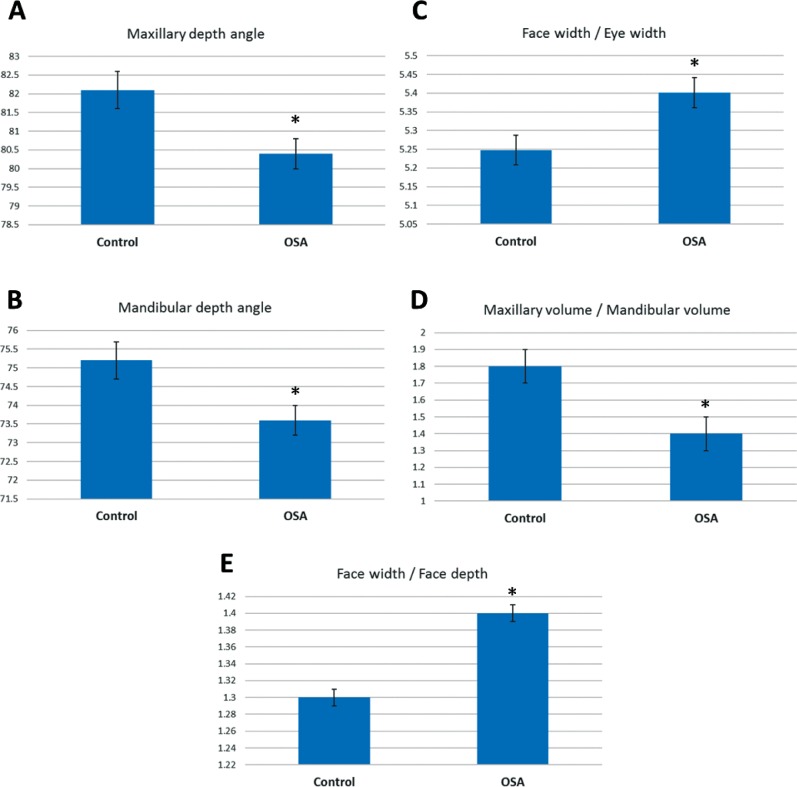
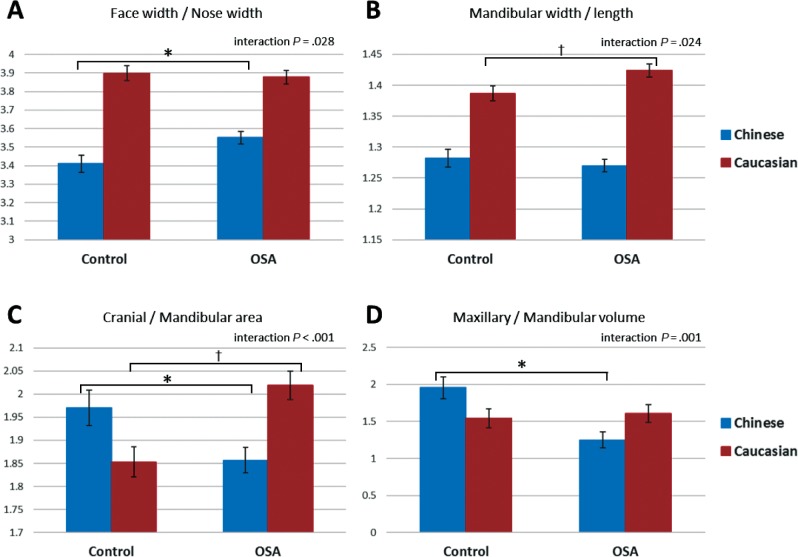
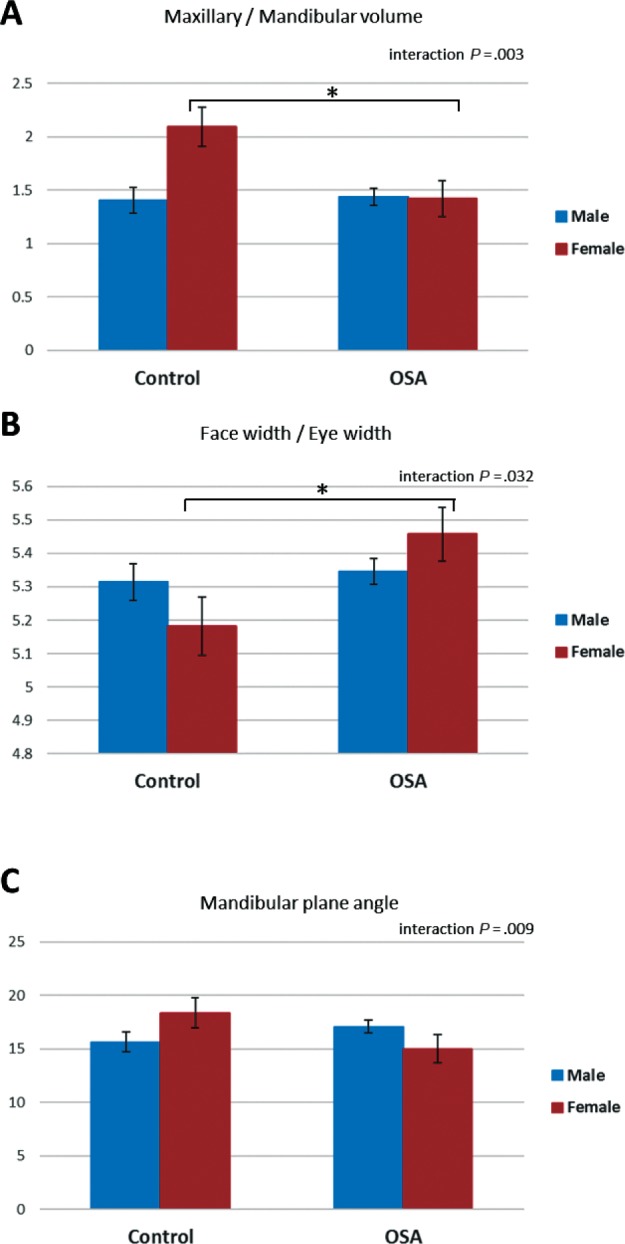
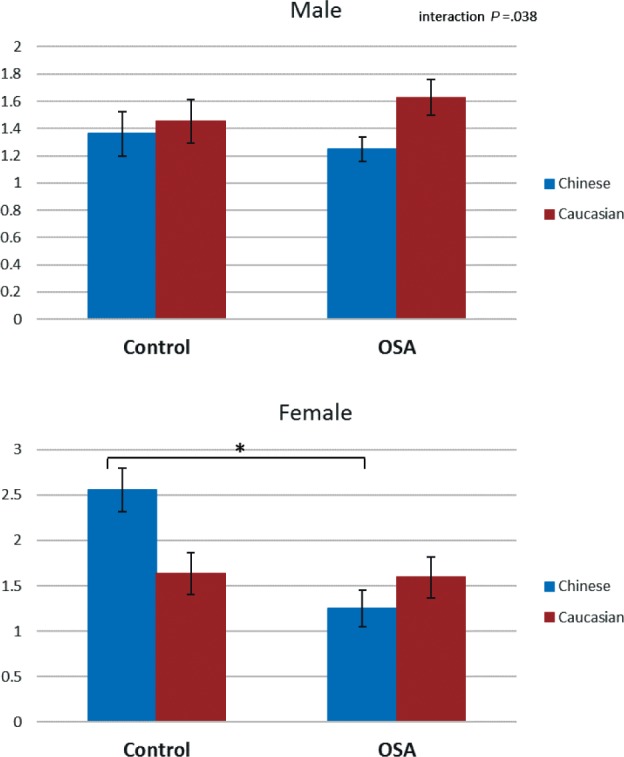
Results: A total of 363 subjects (25% female) were included (n = 200 Chinese, n = 163 Caucasian), of which 33% were controls. There were two-way interactions for OSA with both sex (mandibular plane angle [F = 7.0, P = .009], face / eye width ratio [F = 4.7, P = .032], maxillary / mandibular volume ratio [F = 9.2, P = .003]) and ethnicity (face / nose width ratio [F = 4.0, P = .045], mandibular width / length ratio [F = 5.1, P = .024], maxillary / mandibular volume ratio [F = 11.0, P = .001]).

Conclusions: We provide evidence of ethnic and sex differences in facial phenotype related to OSA. Furthermore, we demonstrate that craniofacial photography can be used as a phenotypic tool to assess these differences and allow investigation of OSA phenotypes in large samples. This has relevance to personalizing OSA recognition strategies across different populations.

Keywords: craniofacial; ethnicity; facial phenotype; obstructive sleep apnea; photogrammetry; sex.


Figures

Figure 1
Figure 1. Facial photographic technique.
Front and profile photos are taken of the subject with a circular calibration marker placed on the face. The facial surface landmarks used to construct the measurements in this analysis are illustrated. Surface landmarks: al = alare, en = endocanthion, ex = exocanthion, gn = gnation, go = gonion, me = menton, n = nasion, sl = sublabiale, sn = subnasion, t = tragion The gonion landmark was marked on the skin surface with a skin-appropriate marker before the photograph to allow visualization.
Figure 2
Figure 2. Craniofacial angles and ratios.
Craniofacial measurements are derived using digitized facial surface landmarks. The craniofacial measurements used in this analysis are graphically illustrated. Angular measurements are shown in red boxes: (A) maxillary depth angle, (B) mandibular depth angle, (C) mandibular plane angle. Facial ratios are shown in blue boxes: (D) face height/width ratio, (E) mandibular width/length ratio, (F) face height/depth ratio, (G) face width/nose width ratio, (H) face width/eye width ratio, (I) cranial base area/mandibular area ratio, (J) maxillary volume/mandibular volume ratio. Surface landmarks: al = alare, en = endocanthion, ex = exocanthion, gn = gnation, go = gonion, me = menton, n = nasion, sl = sublabiale, sn = subnasion, t = tragion. TH = true horizontal line.
Figure 3
Figure 3. Craniofacial measurements in controls and subjects with OSA.
This figure illustrates differences for the main effect of OSA in the factorial analysis of variance (P < .05). The y axis represents the estimated marginal mean (mean value adjusted for other variables in the model, particularly height, body mass index, age, and neck circumference). There were five measurements that differed between controls and subjects with OSA, 2 craniofacial angles (A,B) and 3 craniofacial ratios (C,D,E). * = P < .05 controls versus subjects with OSA. OSA = obstructive sleep apnea.
Figure 4
Figure 4. Craniofacial ratios and interaction between OSA status and ethnicity.
This figure illustrates craniofacial ratios for which there was a significant two-way interaction between OSA status and ethnicity in factorial analysis of variance (interaction P < .05). The y axis represents the estimated marginal mean (mean value adjusted for other variables in the model, particularly height, body mass index, age, and neck circumference). Post hoc group comparisons * = P < .05 controls versus subjects with OSA, Chinese ethnicity, † = P < .05 controls versus subjects with OSA, Caucasian ethnicity. OSA = obstructive sleep apnea.
Figure 5
Figure 5. Craniofacial variables and interaction between OSA status and sex.
This figure illustrates craniofacial ratios for which there was a significant two-way interaction between OSA status and sex in factorial analysis of variance (P < .05). The y axis represents the estimated marginal mean (mean value adjusted for other variables in the model, particularly height, body mass index, age, and neck circumference). Post hoc group comparisons * = P < .05 controls versus subjects with OSA, female sex. OSA = obstructive sleep apnea.
Figure 6
Figure 6. Three-way interaction of OSA status, ethnicity, and sex.
This figure illustrates the three-way interaction observed in the craniofacial ratio maxillary volume / mandibular volume in factorial analysis of variance (P < .05). The y axis represents the estimated marginal mean (mean value adjusted for other variables in the model, particularly height, body mass index, age, and neck circumference). Post hoc group comparisons * = P < .05 controls versus subjects with OSA. OSA = obstructive sleep apnea.

References

    1. Peppard PE, Young T, Barnet JH, Palta M, Hagen EW, Hla KM. Increased prevalence of sleep-disordered breathing in adults. Am J Epidemiol. 2013;177(9):1006–1014. - PMC - PubMed
    1. Jordan AS, McSharry DG, Malhotra A. Adult obstructive sleep apnoea. Lancet. 2014;383(9918):736–747. - PMC - PubMed
    1. Neelapu BC, Kharbanda OP, Sardana HK, et al. Craniofacial and upper airway morphology in adult obstructive sleep apnea patients: a systematic review and meta-analysis of cephalometric studies. Sleep Med Rev. 2017;31:79–90. - PubMed
    1. Schwab RJ, Pasirstein M, Pierson R, et al. Identification of upper airway anatomic risk factors for obstructive sleep apnea with volumetric magnetic resonance imaging. Am J Respir Crit Care Med. 2003;168(5):522–530. - PubMed
    1. Watanabe T, Isono S, Tanaka A, Tanzawa H, Nishino T. Contribution of body habitus and craniofacial characteristics to segmental closing pressures of the passive pharynx in patients with sleep-disordered breathing. Am J Respir Crit Care Med. 2002;165(2):260–265. - PubMed

Publication types