. 2018 Jul 24;115(30):E7202-E7211.
doi: 10.1073/pnas.1717075115. Epub 2018 Jul 10.

Gradual progression from sensory to task-related processing in cerebral cortex

Affiliations

Gradual progression from sensory to task-related processing in cerebral cortex

Scott L Brincat et al. Proc Natl Acad Sci U S A. .

Abstract

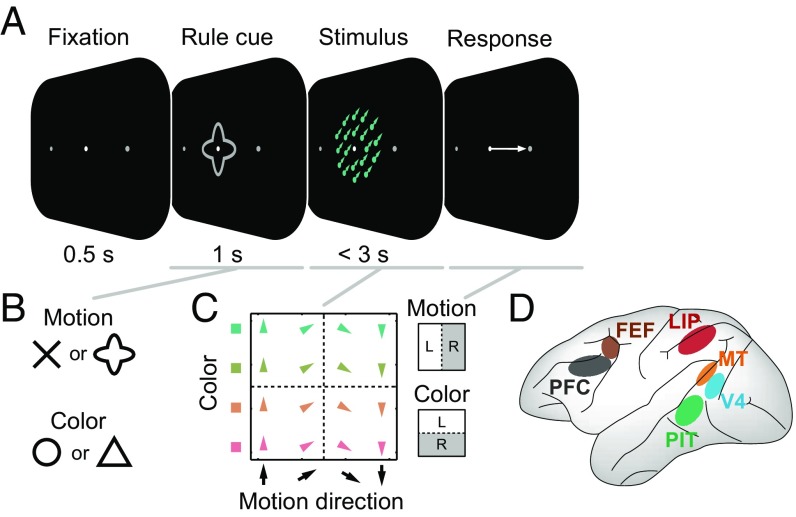
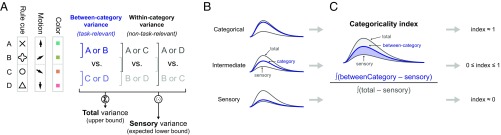
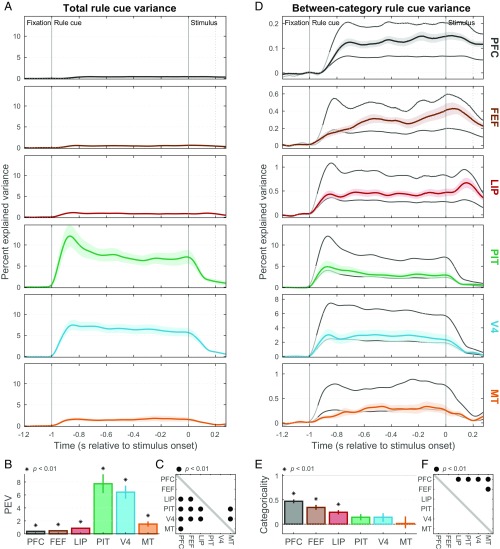
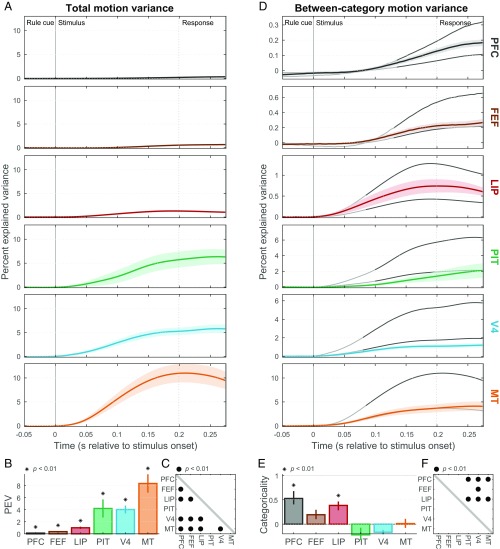
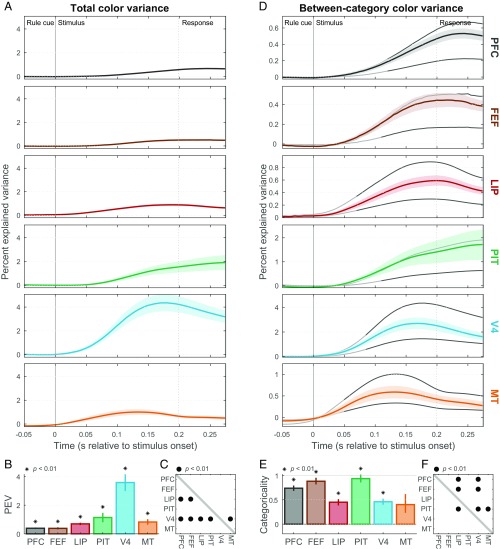
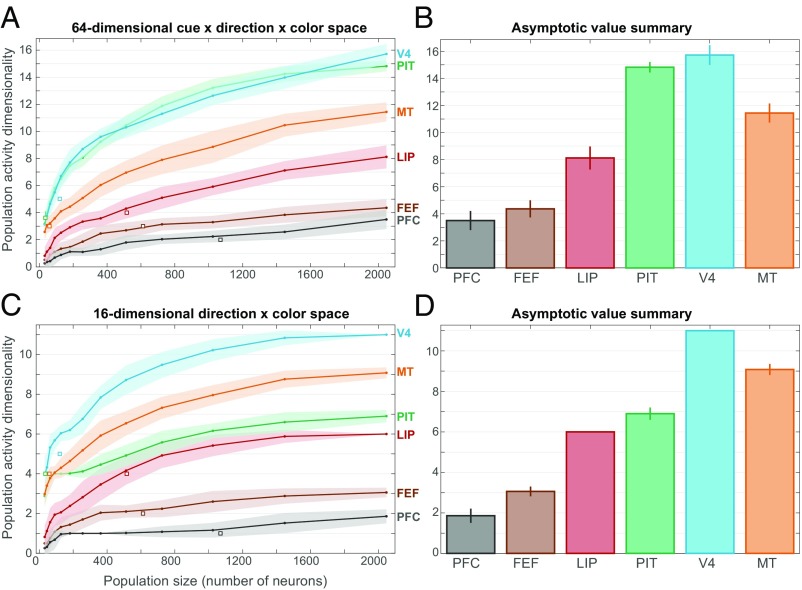
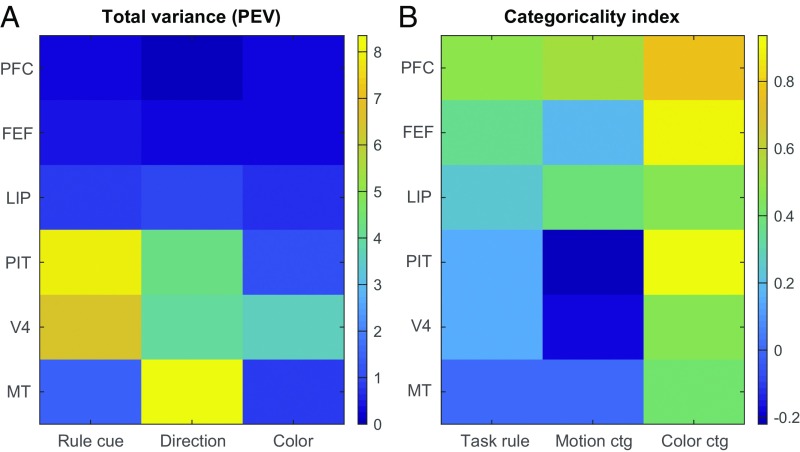
Somewhere along the cortical hierarchy, behaviorally relevant information is distilled from raw sensory inputs. We examined how this transformation progresses along multiple levels of the hierarchy by comparing neural representations in visual, temporal, parietal, and frontal cortices in monkeys categorizing across three visual domains (shape, motion direction, and color). Representations in visual areas middle temporal (MT) and V4 were tightly linked to external sensory inputs. In contrast, lateral prefrontal cortex (PFC) largely represented the abstracted behavioral relevance of stimuli (task rule, motion category, and color category). Intermediate-level areas, including posterior inferotemporal (PIT), lateral intraparietal (LIP), and frontal eye fields (FEF), exhibited mixed representations. While the distribution of sensory information across areas aligned well with classical functional divisions (MT carried stronger motion information, and V4 and PIT carried stronger color and shape information), categorical abstraction did not, suggesting these areas may participate in different networks for stimulus-driven and cognitive functions. Paralleling these representational differences, the dimensionality of neural population activity decreased progressively from sensory to intermediate to frontal cortex. This shows how raw sensory representations are transformed into behaviorally relevant abstractions and suggests that the dimensionality of neural activity in higher cortical regions may be specific to their current task.

Keywords: categorization; cognition; dimensionality; posterior parietal cortex; prefrontal cortex.


Conflict of interest statement

The authors declare no conflict of interest.

Figures

Fig. 1.
Fig. 1.
Experimental design. (A) Trial sequence for the multidimensional visual categorization task. On each trial, the monkeys categorized either the motion direction or color of a random-dot stimulus. This stimulus was immediately preceded by a symbolic visual shape cue that instructed which feature (motion or color) to categorize for that trial. The monkey responded with a leftward or rightward saccade during the 3-s stimulus. (B) Either of two different cue shapes was used to instruct each task rule so as to dissociate cue- and task-rule–related activity. (C) Stimuli systematically sampled motion direction (upward to downward) and color (green to red). Each color category comprised two distinct colors, and each motion category comprised two distinct motion directions (additional ambiguous stimuli on the category boundaries were not analyzed here due to our focus on categoricality). Dashed lines indicate category boundaries. For each task rule, the two categories had a fixed mapping to a leftward (L) or rightward (R) saccadic response. (D) Illustration of sampled brain regions: lateral PFC, FEF, LIP, PIT, V4, and MT.
Fig. 2.
Fig. 2.
Illustration of analysis methods. (A) Spike rate variance for each task variable (task cues/rules, motion directions, and colors) was partitioned into three orthogonal contrasts. One contrast (blue) reflected the actual task-relevant grouping of stimulus items (cue shapes, directions, or colors) into categories, and thus captured between-category variance. The other contrasts (gray) reflected the two other possible non–task-relevant paired groupings of items, and, together, captured all within-category variance. An additional term in the analysis (not depicted) partitions out variance related to the behavioral choice (left vs. right saccade). Details are provided in SI Appendix, SI Methods. (B, Top) The sum of variances for all three contrasts (Σ in A) bounds the between-category variance; the total and between-category variances can be equal only for a perfectly categorical neural population with zero within-category variance. (B, Bottom) Purely sensory-driven population would, instead, have equal variance for all three contrasts, and thus between-category variance would equal the average ( in A) of all three contrasts. (C) The categoricality index measured where actual neural populations fell between these extremes, in terms of the area between the between-category and sensory lower-bound time series, expressed as a fraction of the full area between the upper and lower bounds. Values of 0 and 1 correspond to purely sensory and purely categorical populations, respectively. Details are provided in SI Appendix, SI Methods.
Fig. 3.
Fig. 3.
Task-rule cue representation. (A) Population mean (±SEM) total spike rate variance explained by task-rule cues (cue information) in each studied area as a function of within-trial time [referenced to the onset of the random-dot stimulus]. (B) Summary (across-time mean ± SEM) of total rule-cue variance for each area. All areas contain significant cue information (*P < 0.01). PEV, percent explained variance. (C) Cross-area comparison matrix indicating which regions (rows) had significantly greater cue information than others (columns). Dots indicate area pairs that attained significance (•P < 0.01). PIT and V4 contain significantly greater cue information than all other areas. (D) Mean (±SEM) between-category rule-cue variance (task-rule information; colored curves). Gray curves indicate expected values of this statistic corresponding to a purely categorical representation of rules (upper line) and to a purely sensory representation of rule cues (lower line). The transitions from light to dark gray in these curves indicate the estimated onset latency of overall cue information, which was used as the start of the summary epoch for each area. Note differences in y-axis ranges from A. (E) Task-rule categoricality index (±SEM) for each area, reflecting where its mean between-category rule-cue variance falls between its expected values for pure sensory (0) and categorical (1) representations. Only PFC, FEF, and LIP are significantly different from zero (*P < 0.01). (F) Cross-area comparison matrix indicating which regions (rows) had significantly greater task-rule categoricality indices than others (columns) (•P < 0.01). PFC was significantly greater than all others, except FEF.
Fig. 4.
Fig. 4.
Motion direction representation. (A) Mean (±SEM) total rate variance explained by random-dot stimulus motion directions (motion information) in each area as a function of time (note different time axis from Fig. 3). (B) Summary (across-time mean ± SEM) of total motion variance for each area. All areas contain significant motion information (*P < 0.01), but it was strongest in MT. PEV, percent explained variance. (C) Cross-area comparison matrix indicating which regions (rows) had significantly greater motion information than others (columns). (D) Mean (±SEM) between-category motion variance (motion category information). Gray curves indicate expected values for purely categorical (upper line) and purely sensory (lower line) representations of motion direction. (E) Motion categoricality index (±SEM) for each area, reflecting where its average between-category motion variance falls between expected values for pure sensory (0) and categorical (1) representations. Only PFC and LIP are significantly different from zero (*P < 0.01). (F) Cross-area comparison matrix indicating which regions (rows) had significantly greater motion categoricality indices than others (columns) (•P < 0.01).
Fig. 5.
Fig. 5.
Color representation. (A) Mean (±SEM) total rate variance explained by random-dot stimulus colors (color information) in each area. (B) Summary (across-time mean ± SEM) of color information for each area. All areas contain significant information (*P < 0.01), but V4 carried the strongest color information. (C) Cross-area comparison matrix indicating which regions (rows) had significantly greater color information than others (columns) (•P < 0.01). (D) Mean (±SEM) between-category color variance (color category information). Gray curves indicate expected values for purely categorical (upper line) and purely sensory (lower line) representations of color. (E) Color categoricality index (±SEM) for each area. All areas except MT had indices significantly greater than zero (*P < 0.01). (F) Cross-area comparison matrix indicating which regions (rows) had significantly greater color categoricality indices than others (columns) (•P < 0.01).
Fig. 6.
Fig. 6.
Population activity dimensionality. (A) Dimensionality (mean ± SEM) of neural population activity as a function of extrapolated population size for each studied area. Dimensionality was estimated by noise-thresholded principal components analysis within a 64D rule cue × motion direction × color space (details are provided in SI Appendix, SI Methods). Values for the actual recorded neural populations (white squares ± SEM) were largely consistent with those from the extrapolated populations. (B) Summary of asymptotic dimensionality values (±SEM) in 64D space. (C) Dimensionality (mean ± SEM) of population activity as a function of population size for each studied area. Dimensionality was estimated within a reduced 16D motion direction × color space. (D) Summary of asymptotic dimensionality values (±SEM) in 16D space. V4 and MT have the highest dimensionality, followed by PIT and LIP and then by FEF and PFC.
Fig. 7.
Fig. 7.
Summary of results. (A) Mean total variance in each studied area explained by rule cues, motion directions, and colors. PEV, percent explained variance. (B) Categoricality indices for each studied area for task rules, motion categories, and color categories.

References

    1. Klinger LG, Dawson G. Learning and Cognition in Autism. Springer; New York: 1995. A fresh look at categorization abilities in persons with autism; pp. 119–136.
    1. Kéri S, et al. Category learning and perceptual categorization in schizophrenia. Schizophr Bull. 1999;25:593–600. - PubMed
    1. Freedman DJ, Riesenhuber M, Poggio T, Miller EK. Categorical representation of visual stimuli in the primate prefrontal cortex. Science. 2001;291:312–316. - PubMed
    1. Wallis JD, Anderson KC, Miller EK. Single neurons in prefrontal cortex encode abstract rules. Nature. 2001;411:953–956. - PubMed
    1. Roy JE, Riesenhuber M, Poggio T, Miller EK. Prefrontal cortex activity during flexible categorization. J Neurosci. 2010;30:8519–8528. - PMC - PubMed

Publication types