. 2019 Jun;68(6):985-995.
doi: 10.1136/gutjnl-2018-316191. Epub 2018 Jul 10.

Evolutionary history of human colitis-associated colorectal cancer

Affiliations

Evolutionary history of human colitis-associated colorectal cancer

Ann-Marie Baker et al. Gut. 2019 Jun.

Abstract

Objective: IBD confers an increased lifetime risk of developing colorectal cancer (CRC), and colitis-associated CRC (CA-CRC) is molecularly distinct from sporadic CRC (S-CRC). Here we have dissected the evolutionary history of CA-CRC using multiregion sequencing.

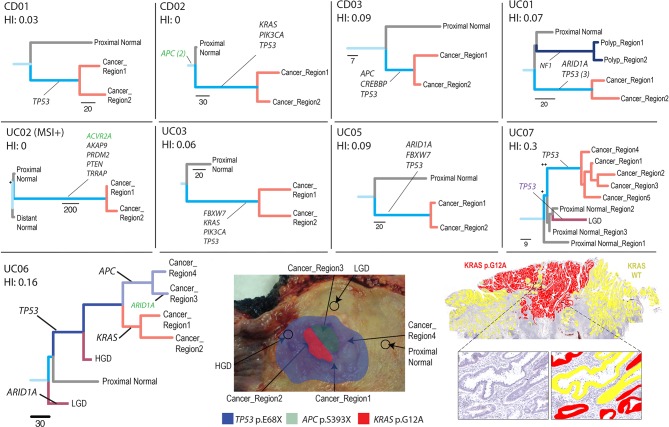
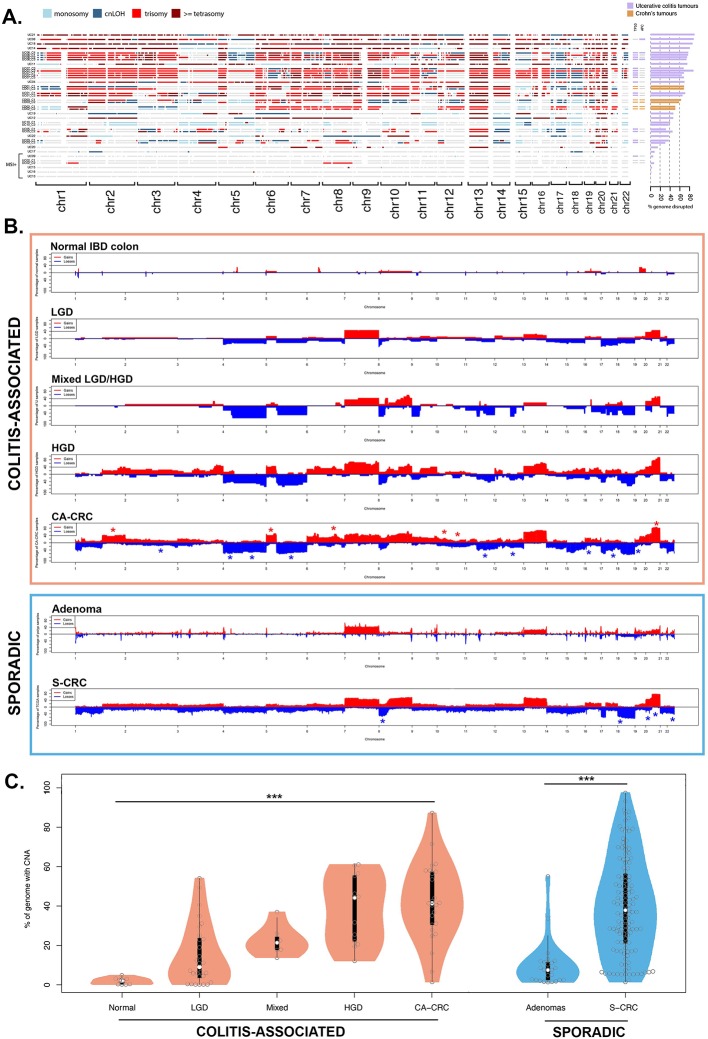
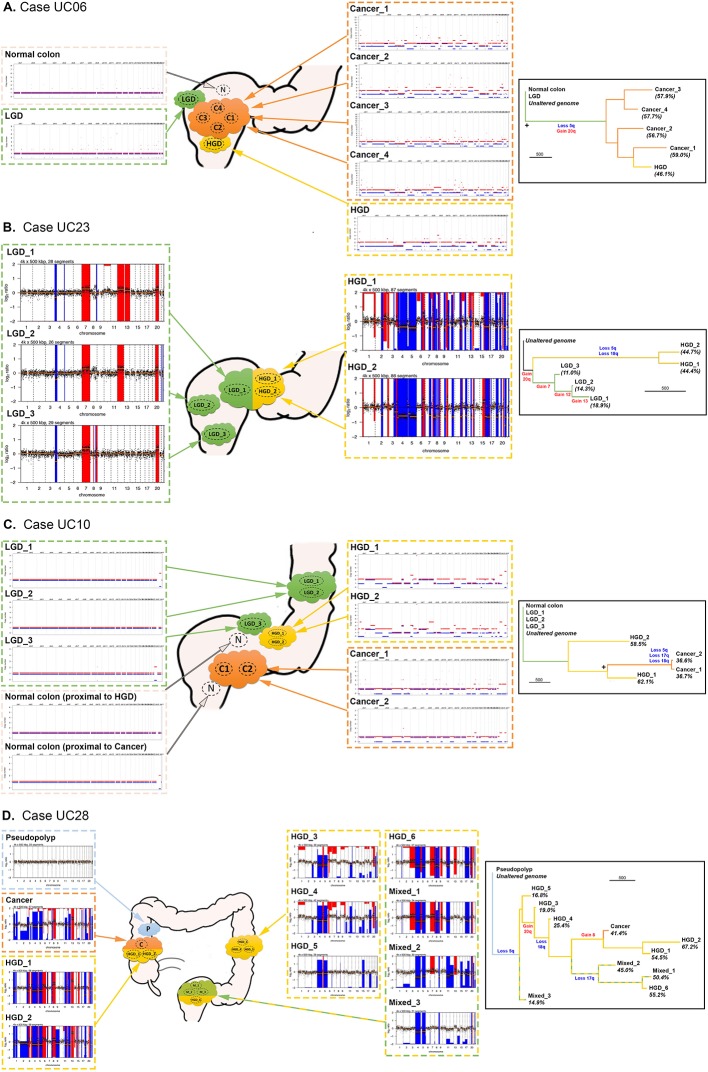
Design: Exome sequencing was performed on fresh-frozen multiple regions of carcinoma, adjacent non-cancerous mucosa and blood from 12 patients with CA-CRC (n=55 exomes), and key variants were validated with orthogonal methods. Genome-wide copy number profiling was performed using single nucleotide polymorphism arrays and low-pass whole genome sequencing on archival non-dysplastic mucosa (n=9), low-grade dysplasia (LGD; n=30), high-grade dysplasia (HGD; n=13), mixed LGD/HGD (n=7) and CA-CRC (n=19). Phylogenetic trees were reconstructed, and evolutionary analysis used to reveal the temporal sequence of events leading to CA-CRC.

Results: 10/12 tumours were microsatellite stable with a median mutation burden of 3.0 single nucleotide alterations (SNA) per Mb, ~20% higher than S-CRC (2.5 SNAs/Mb), and consistent with elevated ageing-associated mutational processes. Non-dysplastic mucosa had considerable mutation burden (median 47 SNAs), including mutations shared with the neighbouring CA-CRC, indicating a precancer mutational field. CA-CRCs were often near triploid (40%) or near tetraploid (20%) and phylogenetic analysis revealed that copy number alterations (CNAs) began to accrue in non-dysplastic bowel, but the LGD/HGD transition often involved a punctuated 'catastrophic' CNA increase.

Conclusions: Evolutionary genomic analysis revealed precancer clones bearing extensive SNAs and CNAs, with progression to cancer involving a dramatic accrual of CNAs at HGD. Detection of the cancerised field is an encouraging prospect for surveillance, but punctuated evolution may limit the window for early detection.

Keywords: IBD - genetics; colorectal cancer; dysplasia; inflammatory bowel disease.


Conflict of interest statement

Competing interests: None declared.

Figures

Figure 1
Figure 1
Analysis of single nucleotide alteration (SNA) burden in CA-CRC. (A) Analysis of mutation frequency in CA-CRC versus S-CRC (MSS=left panel, CA-CRC n=10, S-CRC n=191; MSI=right panel, CA-CRC n=2, S-CRC n=35). (B) Analysis of mutation burden and heterogeneity in UC versus Crohn’s colitis cases. Data are shown per biopsy (left panel) and per patient (right panel). (C) Frequency of CA-CRC (n=10) and S-CRC (n=191) MSS cases with non-synonymous SNAs in genes mutated in >20% of CA-CRCs or >5% of S-CRCs. *p<0.05; ***p<0.001 by Fisher’s exact test. (D) Meta-analysis displaying the frequency of recurrently mutated genes in CA-CRC (n=40 or n=87) and S-CRCs (n=189), incorporating data from the current study and two previous studies. *p<0.05; **p<0.01; ***p<0.001 by Fisher’s exact test. CA-CRC, colitis-associated CRC; CRC, colorectal cancer; MSI, microsatellite instability; MSS, microsatellite stable; NS, not significant by the Mann-Whitney test; S-CRC, sporadic CRC; SNV, single nucleotide variant.
Figure 2
Figure 2
Analysis of single nucleotide alteration (SNA) phylogeny in colitis-associated CRC (CA-CRC). Phylogenetic trees were produced using maximum parsimony and multiregion whole exome sequencing (WXS) of CA-CRCs. Branches are labelled with SNA drivers (black), indel drivers (green) and splice site variants (purple). The lower panel shows case UC06 in further detail, with an annotated image of the surgical specimen (middle) and an annotated digitised image of the KRAS G12A (red) and KRAS WT (yellow) subclones visualised by BaseScope in situ hybridisation (right). +, bootstrap value of 65–95; ++, bootstrap value <65; HGD, high-grade dysplasia; HI, homoplasy index; LGD, low-grade dysplasia; MSI, microsatellite instability; WT, wild type.
Figure 3
Figure 3
Analysis of genome-wide CNAs in CA-CRC. (A) Per sample analysis of CNAs (copy gain, copy loss or copy-neutral loss of heterozygosity (LOH), derived from whole exome sequencing (WXS) or single nucleotide polymorphism (SNP) array) in microsatellite stable (MSS) and microsatellite instable (MSI) CA-CRCs, represented as a genome-wide plot (left panel) and as a proportion of the genome disrupted (right panel). Also shown is the mutational status of the TP53 and APC genes in each case (coloured box=mutant, grey box=wild type). (B) Genome-wide frequency of losses and gains in normal IBD colon, dysplasia (LGD, mixed LGD/HGD, HGD), MSS CA-CRC, sporadic adenomas and MSS S-CRC. Red or blue crosses indicate statistically significant arm-level amplification or loss, respectively. Normal IBD colon: n=9, LGD: n=28, mixed LGD/HGD: n=7, HGD: n=13, CA-CRC: n=25, sporadic adenoma: n=25, S-CRC: n=127. (C) Analysis of the proportion of the genome showing loss or gain in normal IBD colon, dysplasia, CA-CRC, sporadic adenoma and S-CRC (for colitis-associated samples p=3.14×10⁻⁸ by the Kruskal-Wallis test; for sporadic samples p=3.43×10⁻⁹ by the Mann-Whitney test). Sample numbers were as described in (B). CA-CRC, colitis-associated CRC; CNA, copy number alteration; cnLOH, copy-neutral LOH; HGD, high-grade dysplasia; LGD, low-grade dysplasia; S-CRC, sporadic CRC.
Figure 4
Figure 4
Analysis of copy number alteration (CNA) phylogeny in colitis-associated CRC (CA-CRC). Left panels show representative schematics of the location of biopsies, annotated with genome-wide copy number (CN) plots derived from whole exome sequencing (WXS) (A, C) or low-pass whole genome sequencing (LP-WGS) (B, D). Right panels show phylogenetic trees produced using the corresponding CN data, with key CN gains and losses annotated. + indicates bootstrap value of 65–95. The scale bar for branch length represents 500 evolutionary changes of bin size 500 kbp (see the Methods section). HGD, high-grade dysplasia; LGD, low-grade dysplasia.
Figure 5
Figure 5
Summary of SNA and CNA burden during colitis-associated CRC (CA-CRC) tumorigenesis. Schematic diagram showing the stepwise progression to CA-CRC, annotated with the observed SNA burden (proportional to the size of dark blue circles) and CNA burden (shaded area of pink circles). CNA, copy number alteration; SNA, single nucleotide alteration.

References

    1. Eaden JA, Abrams KR, Mayberry JF. The risk of colorectal cancer in ulcerative colitis: a meta-analysis. Gut 2001;48:526–35. 10.1136/gut.48.4.526 - DOI - PMC - PubMed
    1. Ekbom A, Helmick C, Zack M, et al. . Ulcerative colitis and colorectal cancer. A population-based study. N Engl J Med 1990;323:1228–33. 10.1056/NEJM199011013231802 - DOI - PubMed
    1. Gyde SN, Prior P, Allan RN, et al. . Colorectal cancer in ulcerative colitis: a cohort study of primary referrals from three centres. Gut 1988;29:206–17. 10.1136/gut.29.2.206 - DOI - PMC - PubMed
    1. Rutter MD, Saunders BP, Wilkinson KH, et al. . Thirty-year analysis of a colonoscopic surveillance program for neoplasia in ulcerative colitis. Gastroenterology 2006;130:1030–8. 10.1053/j.gastro.2005.12.035 - DOI - PubMed
    1. Jess T, Simonsen J, Jørgensen KT, et al. . Decreasing risk of colorectal cancer in patients with inflammatory bowel disease over 30 years. Gastroenterology 2012;143:375–81. 10.1053/j.gastro.2012.04.016 - DOI - PubMed

Publication types

LinkOut - more resources