. 2018 Jul 10;9(1):2665.
doi: 10.1038/s41467-018-05063-1.

Patterns of genomic evolution in advanced melanoma

Affiliations

Patterns of genomic evolution in advanced melanoma

E Birkeland et al. Nat Commun. .

Abstract

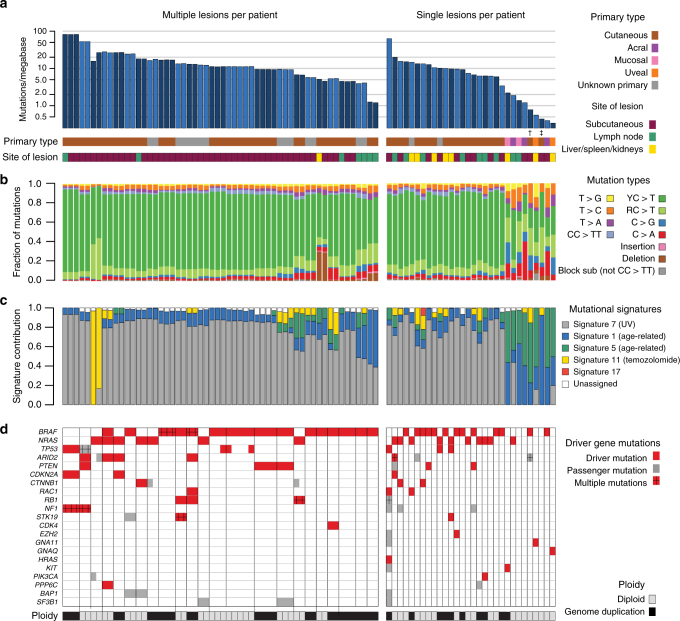
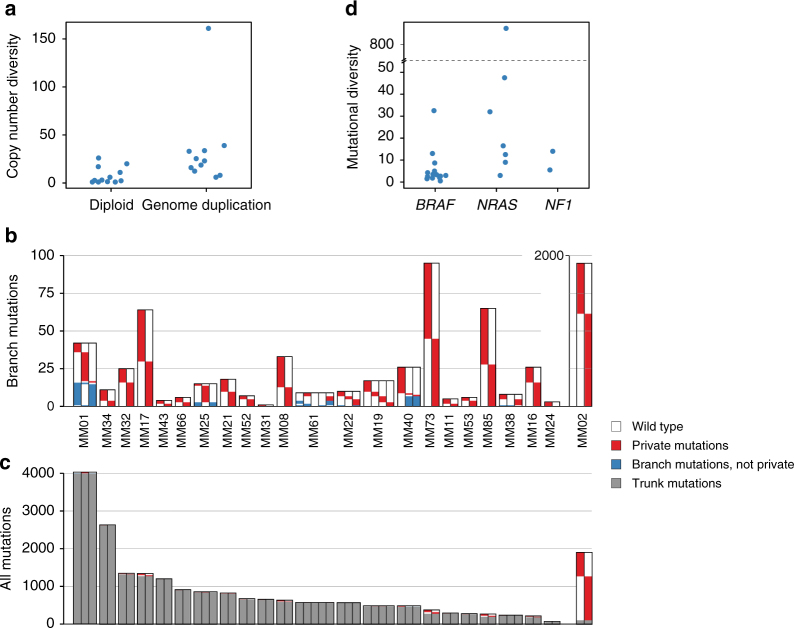
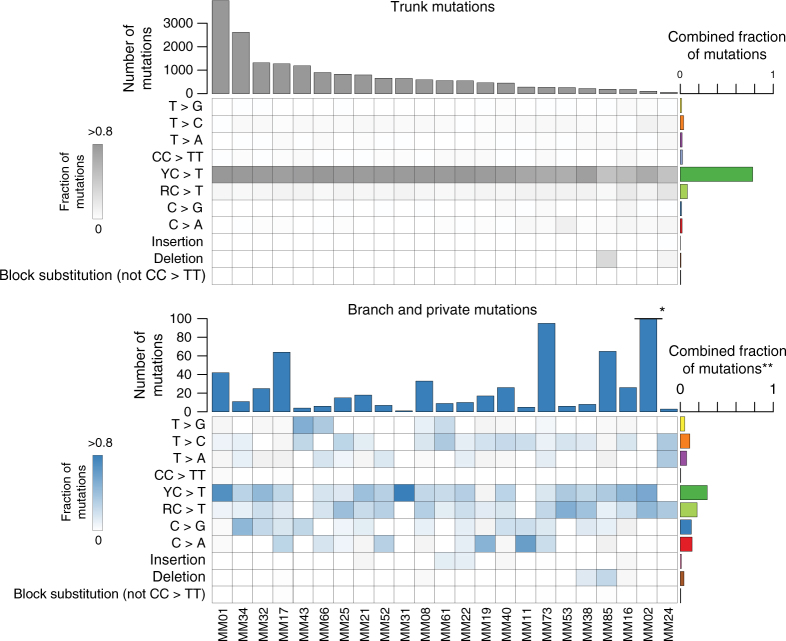
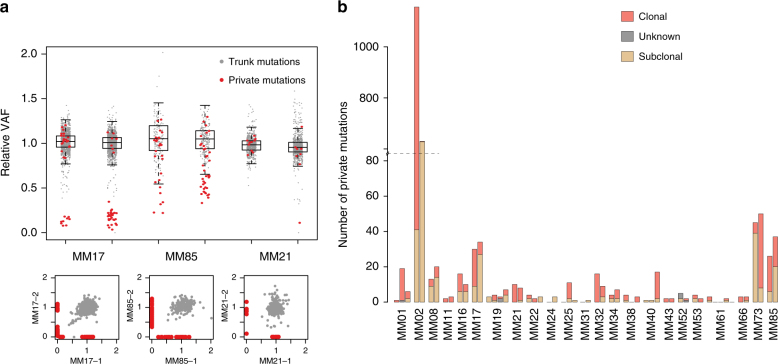
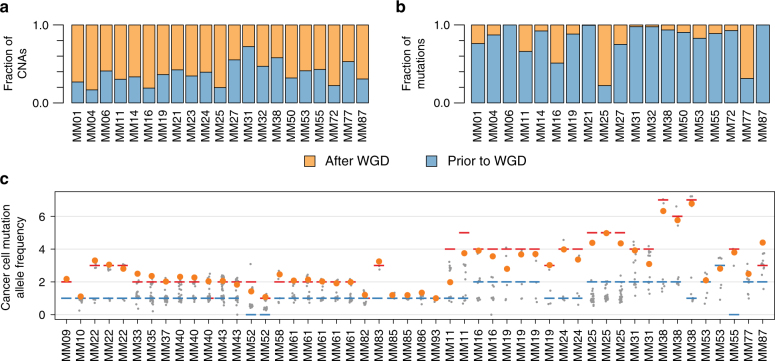
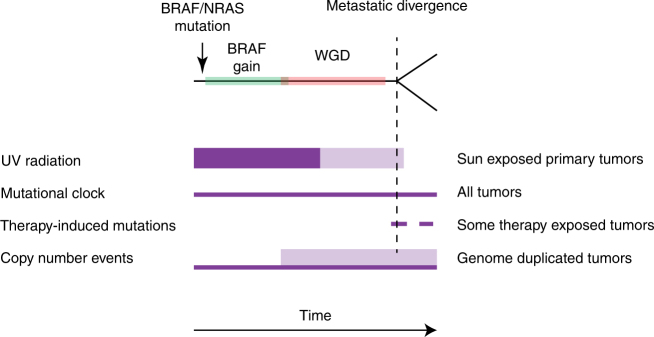
Genomic alterations occurring during melanoma progression and the resulting genomic heterogeneity between metastatic deposits remain incompletely understood. Analyzing 86 metastatic melanoma deposits from 53 patients with whole-exome sequencing (WES), we show a low branch to trunk mutation ratio and little intermetastatic heterogeneity, with driver mutations almost completely shared between lesions. Branch mutations consistent with UV damage indicate that metastases may arise from different subclones in the primary tumor. Selective gain of mutated BRAF alleles occurs as an early event, contrasting whole-genome duplication (WGD) occurring as a late truncal event in about 40% of cases. One patient revealed elevated mutational diversity, probably related to previous chemotherapy and DNA repair defects. In another patient having received radiotherapy toward a lymph node metastasis, we detected a radiotherapy-related mutational signature in two subsequent distant relapses, consistent with secondary metastatic seeding. Our findings add to the understanding of genomic evolution in metastatic melanomas.


Conflict of interest statement

The authors declare no competing interests.

Figures

Fig. 1
Fig. 1
Overview of mutations. ad Left: patients from whom multiple lesions were analyzed. Right: patients from whom single lesions were sampled. Patients are ordered by the number of mutations identified per patient, and lesions are further ordered according to time of sampling. a Number of mutations per megabase in each individual sample. Samples from different patients are indicated by alternating shades of blue. † One patient had a borderline acral primary tumor situated at a toe. ‡ One patient had a perianal cutaneous primary tumor, likely not exposed to UV radiation. b Fraction of mutation types per lesion. c Estimated contribution of mutational processes by fraction of mutations explained by each mutational signature, according to the classification of Alexandrov et al.. Only signatures explaining >5% of mutations are shown, and only signatures 7, 1, 5, 11, and 17 were assessed. d Mutations identified per lesion in established melanoma driver genes are color-coded: red boxes indicate driver mutations and gray boxes indicate passenger mutations. Multiple mutations per gene are indicated with ”+”. Genome duplication events are shown per sample in gray (diploid) or black (genome duplication) for each sample
Fig. 2
Fig. 2
Mutational heterogeneity. a Copy number diversity according to whether genome duplication was identified in samples from each patient. b Branch mutations (found in more than one, but not all samples) and private mutations (found exclusively in one sample) per lesion. For MM02, a separate axis is used to capture the large number of private mutations. c All mutations (private, branch, and trunk mutations) presented together for each lesion. d Mutational diversity (average number of branch mutations per sample) in patients according to driver mutation status of BRAF and NRAS. The Y-axis is broken for clarity due to the high mutational diversity in MM02
Fig. 3
Fig. 3
Comparison of trunk and branch mutations. Heatmaps show the relative frequency of mutations among branch mutations (top panel; gray) and branch mutations (bottom panel; blue) for each patient. C>T transitions are categorized as occurring downstream of pyrimidines (Y) or purines (R). The combined fractions of mutations represent the sum of mutations for each type relative to the total number of mutations for either trunk or branch mutations. * Due to the high number of branch mutations in MM02 (n = 1786), the bar is truncated for this patient. ** In the summary of branch mutation types, mutations in MM02 are omitted for clarity (branch mutations in MM02 displayed a particular mutational signature; see Supplementary Fig. 7 and 11 for details)
Fig. 4
Fig. 4
Cellular prevalence of mutations. a Relative variant allele frequency (rVAF); that is observed variant allele frequency corrected by tumor purity, local total copy number and estimated number of mutated alleles, for mutations in six representative samples from three patients. In theory, relative VAF is equivalent to cellular prevalence of the mutations. Mutations are colored according to presence in other lesions; gray, trunk mutations; red, private mutations. Boxes with whiskers are based solely on the trunk mutation relative VAFs and span the interquartile range (IQR), with whiskers extending to 1.5 times the IQR of the trunk relative VAF from the upper and lower bounds of the boxes. The three lower panels show examples of pairwise comparisons. b Private mutations were classified according to status as clonal or subclonal, where subclonal mutations are those whose relative VAF is below the whiskers in a. Mutations below half the median relative VAF and above the subclonality threshold are defined as unknown
Fig. 5
Fig. 5
Timing of genome duplication and gain of mutated BRAF. a, b Estimated fraction of copy number events (a) and mutations (b) in assessable regions of the genome that occurred prior to and after genome duplication. c The relative allelic frequency (corrected to show allelic status of mutation) for mutations in the genomic segment harboring the BRAF gene in samples with a BRAF mutation. Allelic states are shown as red (major allele) and blue (minor allele) lines; mutations are shown as points, where the BRAF mutation is colored orange and all others are colored gray
Fig. 6
Fig. 6
Model of progression for metastatic melanoma. Purple fields portray the timing of mutational processes, with increased thickness indicating higher mutational activity. Lower opacity indicates variability in timing of processes in relation to each other; e.g., timing of UV radiation in relation to the timing of genome duplication events

Similar articles

Cited by

References

    1. Whiteman DC, Green AC, Olsen CM. The growing burden of invasive melanoma: projections of incidence rates and numbers of new cases in six susceptible populations through 2031. J. Invest. Dermatol. 2016;136:1161–1171. doi: 10.1016/j.jid.2016.01.035. - DOI - PubMed
    1. Whiteman DC, et al. Anatomic site, sun exposure, and risk of cutaneous melanoma. J. Clin. Oncol. 2006;24:3172–3177. doi: 10.1200/JCO.2006.06.1325. - DOI - PubMed
    1. Hodis E, et al. A landscape of driver mutations in melanoma. Cell. 2012;150:251–263. doi: 10.1016/j.cell.2012.06.024. - DOI - PMC - PubMed
    1. Pleasance ED, et al. A comprehensive catalogue of somatic mutations from a human cancer genome. Nature. 2010;463:191–196. doi: 10.1038/nature08658. - DOI - PMC - PubMed
    1. Hayward NK, et al. Whole-genome landscapes of major melanoma subtypes. Nature. 2017;545:175–180. doi: 10.1038/nature22071. - DOI - PubMed

Publication types

Substances