. 2018 Jul 10;9(1):2670.
doi: 10.1038/s41467-018-04924-z.

Integrative genomic analysis of adult mixed phenotype acute leukemia delineates lineage associated molecular subtypes

Affiliations

Integrative genomic analysis of adult mixed phenotype acute leukemia delineates lineage associated molecular subtypes

Koichi Takahashi et al. Nat Commun. .

Abstract

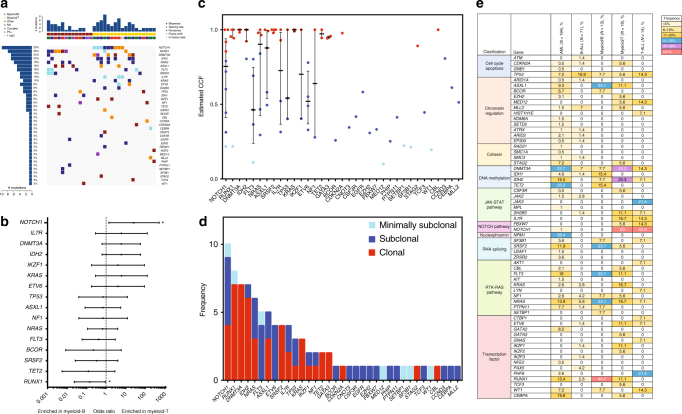
Mixed phenotype acute leukemia (MPAL) is a rare subtype of acute leukemia characterized by leukemic blasts presenting myeloid and lymphoid markers. Here we report data from integrated genomic analysis on 31 MPAL samples and compare molecular profiling with that from acute myeloid leukemia (AML), B cell acute lymphoblastic leukemia (B-ALL), and T cell acute lymphoblastic leukemia (T-ALL). Consistent with the mixed immunophenotype, both AML-type and ALL-type mutations are detected in MPAL. Myeloid-B and myeloid-T MPAL show distinct mutation and methylation signatures that are associated with differences in lineage-commitment gene expressions. Genome-wide methylation comparison among MPAL, AML, B-ALL, and T-ALL sub-classifies MPAL into AML-type and ALL-type MPAL, which is associated with better clinical response when lineage-matched therapy is given. These results elucidate the genetic and epigenetic heterogeneity of MPAL and its genetic distinction from AML, B-ALL, and T-ALL and further provide proof of concept for a molecularly guided precision therapy approach in MPAL.


Conflict of interest statement

The authors declare no competing interests.

Figures

Fig. 1
Fig. 1
Landscape of somatic mutations in MPAL. a Landscape of high-confidence somatic mutations detected in 31 MPAL cases by sequencing with a 295-gene panel. Each column represents a case and each raw represents a gene. The top bar graph shows the number of mutations detected in each sample. The two rows directly underneath that graph show the (upper) immunophenotypes (myeloid-B in dark red and myeloid-T in yellow) and (lower) the cytogenetic classification. The bar graph at left shows the number of mutations detected overall in that gene. b Forrest plot showing enrichment of the mutations against the immunophenotypes by logarithmic odds ratio. *P < 0.05. The error bars represent 95% confidence interval of odds ratio. c Dot plot showing the estimated cancer cell fraction (CCF) of each mutation. Mutations with a CCF <0.2 are considered minimally subclonal (light blue), those with CCF ≥0.2 and <0.85 are considered subclonal (blue) and those with a CCF ≥0.85 are considered clonal (red). The error bars represent interquartile range and the center line represents the median. d Bar graph showing the number of detected mutations in each gene with degrees of clonality based on the estimated CCF. e Table summarizing the distribution of high-confidence somatic mutations detected by the 295-gene panel sequencing in patients with AML (N = 194), B-ALL (N = 71), myeloid-B MPAL (N = 13), myeloid-T MPAL (N = 18), or T-ALL (N = 14). The patients were classified by their diagnosis, and the mutations are grouped by the consensus molecular pathways. The frequency of the mutations is represented by different colors (key at upper right)
Fig. 2
Fig. 2
Fusion transcripts in MPAL. Fusion genes detected in MPAL samples by RNA sequencing. In addition to fusions already known (detected by karyotyping), a total five in-frame fusion candidates were detected in three patient samples
Fig. 3
Fig. 3
Methylation heterogeneity in MPAL. a Unsupervised consensus k-means clustering of the methylation data from 31 MPAL samples by the top 10,000 variably methylated probes. The consensus is the strongest at k= 2 with the highest cophenetic coefficient. b Silhouette analysis of individual k distrubution also supported that k = 2 has the highest average silhouette value. j: nj| aveicj Si represents cluster number: number of samples grouped in the cluster| average silhouette width of the cluster. Silouette distribution for other k values are also shown in Supplementary Fig. 9. c Principal component analysis (PCA) of MPAL samples based on 10,000 variably methylated probes supports 2 distinct clusters. d Unsupervised hierarchical clustering of the top 10,000 variably methylated probes with data on consensus clusters, genetic mutations, and immunosubtypes. Myeloid-B and myeloid-T phenotypes are significantly enriched in cluster 1 and cluster 2, respectively (P < 0.01)
Fig. 4
Fig. 4
Methylation difference between myeloid-T and myeloid-B MPAL. a Scatter plot with mean beta value of each CpG probe among all 31 MPAL samples compared between myeloid-B (y axis) and myeloid-T (x axis) phenotypes. Red-colored dots represent probes that were significantly differentially methylated (DMP: FDR <0.1 and difference in mean delta value >0.15) between the two phenotypes. The myeloid-T phenotype has more DMPs with higher methylation beta values than the myeloid-B phenotype. b Density distribution of all CpG probes with methylation beta values comparing myeloid-B and myeloid-T phenotypes. c Box plot comparing mean methylation beta value of all CpG probes in each MPAL sample based on immunophenotypes. d Density distribution of top 1% variably methylated probes with methylation beta values comparing myeloid-B and myeloid-T phenotypes. e Box plot comparing mean methylation beta values of top 1% variably methylated probes in each MPAL sample based on immunophenotypes. For box plots, center line represents the meidan, box edges represent the 25th and 75th percentiles, upper whisker represent 75th percentile + 1.5 times interquartile range, lower whisker represent 25th percentile − 1.5 times interquartile range and the dots represent actual data point
Fig. 5
Fig. 5
Transcriptomic changes between myeloid-T and myeloid-B. a Pathway analysis of differentially methylated promoter CpG probes (FDR <0.1 and delta beta value >0.15) between myeloid-B and myeloid-T phenotypes showing significant enrichment of T cell receptor pathways. P value was calculated by Fisher’s exact test and FDR was calculated by Benjamini–Hochsberg method. b Starburst plot integrating analysis of gene expression and promoter methylation. Red dots represent promoter CpG probes with significantly differential methylation that are also associated with significant differences in expression between myeloid-B and myeloid-T. c Log2 fold differences of transcription levels of genes that were significantly different between myeloid-B and myeloid-T phenotypes and were associated with significant promoter methylation differences. P value was calculated by Wald test and adjusted for multiple testing by Benjramini–Hochberg method. d Motif enrichment analysis of promoter CpG probes differentially methylated between the two phenotypes showing significant enrichment of IRF8 and IRF4 recognition motifs. P value was calculated by Wilcoxon rank-sam test. e Log2 fold differences of transcription levels of key downstream target genes of IRF8 and IRF4 between myeloid-B (My-B) and myeloid-T (My-T) phenotypes. P value was calculated by Wald test and adjusted for multiple testing by Benjramini–Hochberg method. f Gene set enrichment analysis (GSEA) comparing gene expression data from RNA sequencing between myeloid-B and myeloid-T phenotypes showing significant enrichment of B cell receptor (BCR) and NFκB pathways in myeloid-B MPAL. The method of estimating nominal P value and FDR adjustment is described elsewhere
Fig. 6
Fig. 6
Methylation comparison among all leukemias. a Unsupervised hierarchical clustering of the top 10,000 variably methylated probes among AML (N = 194), B-ALL (N = 505), T-ALL (N = 101), and MPAL (N = 31) cases. MPAL cases are indicated by arrows (red arrow, myeloid-T: blue arrow, myeloid-B). MPAL cases that were clustered within AML cases and B-ALL/T-ALL cases were classified as “AML-like MPAL” and “ALL-like MPAL,” respectively. b Distribution of AML-like MPAL and ALL-like MPAL defined by methylation cluster in myeloid-T and myeloid-B MPAL. c Forest plot showing enrichment of mutations against AML-like MPAL and ALL-like MPAL by logarithmic odds ratio. The error bars represent 95% confidence interval of odds ratio. d, e Box plots showing frequency of CD19-positive and CD7-positive cells in myeloid-B and myeloid-T MPAL, respectively, stratified by ALL-like and AML-like MPAL. For box plots, center line represents the meidan, box edges represent the 25th and 75th percentiles, upper whisker represent 75th percentile + 1.5 times interquartile range, lower whisker represent 25th percentile − 1.5 times interquartile range and the dots represent outliers. Difference between the two groups was tested by Mann–Whitney U test
Fig. 7
Fig. 7
Clinical correlation. Comparison of a complete remission (CR) and b composite CR (CR + CR with insufficient count recovery [CRi]) rate in MPAL patients after 1 cycle of induction chemotherapy based on whether the therapy was matched with the patient’s MPAL methylation status. Difference between two groups was tested by Fisher’s exact test. c Comparison of overall survival in patients who received a therapy matched to their methylation status and in patients who received an un-matched therapy. Difference between two grous was tested by log-rank test

References

    1. Weinberg OK, Arber DA. Mixed-phenotype acute leukemia: historical overview and a new definition. Leukemia. 2010;24:1844–1851. doi: 10.1038/leu.2010.202. - DOI - PubMed
    1. Arber DA, et al. The 2016 revision to the World Health Organization classification of myeloid neoplasms and acute leukemia. Blood. 2016;127:2391–2405. doi: 10.1182/blood-2016-03-643544. - DOI - PubMed
    1. Matutes E, et al. Mixed-phenotype acute leukemia: clinical and laboratory features and outcome in 100 patients defined according to the WHO 2008 classification. Blood. 2011;117:3163–3171. doi: 10.1182/blood-2010-10-314682. - DOI - PubMed
    1. Wolach O, Stone RM. How I treat mixed-phenotype acute leukemia. Blood. 2015;125:2477–2485. doi: 10.1182/blood-2014-10-551465. - DOI - PubMed
    1. Rubnitz JE, et al. Acute mixed lineage leukemia in children: the experience of St Jude Children’s Research Hospital. Blood. 2009;113:5083–5089. doi: 10.1182/blood-2008-10-187351. - DOI - PMC - PubMed

Publication types

MeSH terms