. 2018 Jul 10;8(1):10416.
doi: 10.1038/s41598-018-28835-7.

Toxicological evaluation of convulsant and anticonvulsant drugs in human induced pluripotent stem cell-derived cortical neuronal networks using an MEA system

Affiliations

Toxicological evaluation of convulsant and anticonvulsant drugs in human induced pluripotent stem cell-derived cortical neuronal networks using an MEA system

A Odawara et al. Sci Rep. .

Abstract

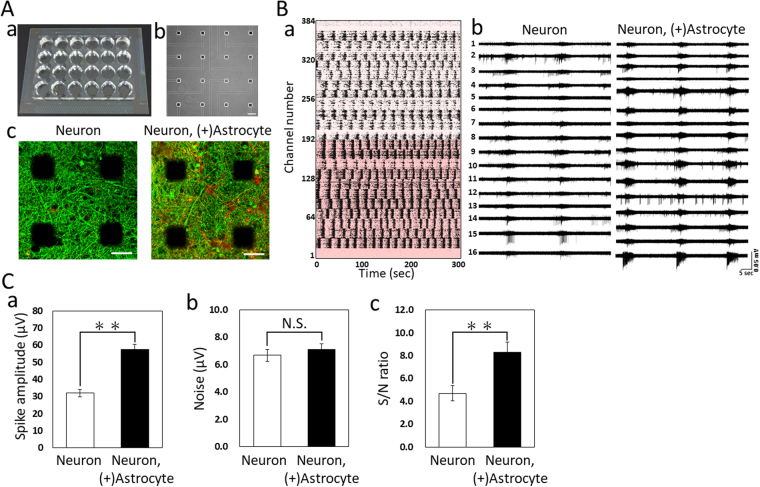
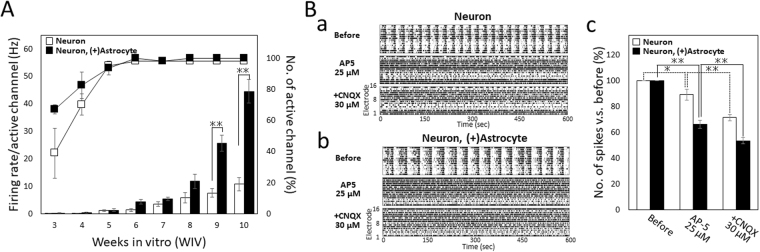
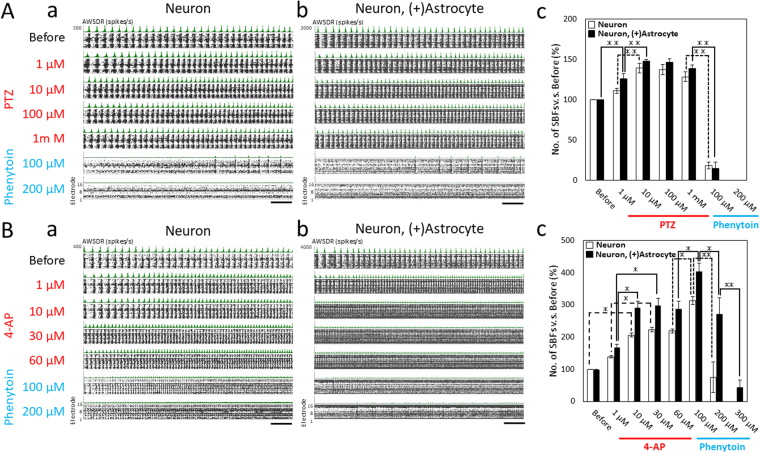
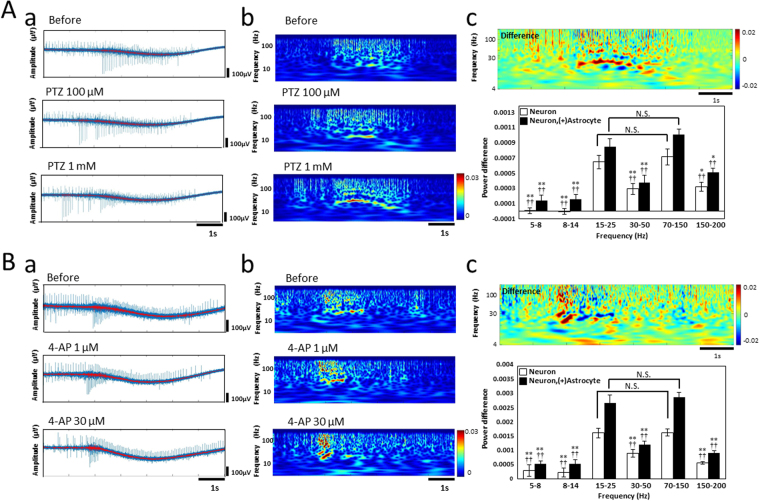
Functional evaluation assays using human induced pluripotent stem cell (hiPSC)-derived neurons can predict the convulsion toxicity of new drugs and the neurological effects of antiepileptic drugs. However, differences in responsiveness depending on convulsant type and antiepileptic drugs, and an evaluation index capable of comparing in vitro responses with in vivo responses are not well known. We observed the difference in synchronized burst patterns in the epileptiform activities induced by pentylentetrazole (PTZ) and 4-aminopryridine (4-AP) with different action mechanisms using multi-electrode arrays (MEAs); we also observed that 100 µM of the antiepileptic drug phenytoin suppressed epileptiform activities induced by PTZ, but increased those induced by 4-AP. To compare in vitro results with in vivo convulsive responses, frequency analysis of below 250 Hz, excluding the spike component, was performed. The in vivo convulsive firing enhancement of the high γ wave and β wave component were observed remarkably in in vitro hiPSC-derived neurons with astrocytes in co-culture. MEA measurement of hiPSC-derived neurons in co-culture with astrocytes and our analysis methods, including frequency analysis, appear effective for predicting convulsion toxicity, side effects, and their mechanism of action as well as the comparison of convulsions induced in vivo.


Conflict of interest statement

The authors declare no competing interests.

Figures

Figure 1
Figure 1
Extracellular recordings of spontaneous firing in hiPSC-derived cortical neurons and co-culture with hiPSC-derived astrocytes using a 24-well MEA system. (A) 24-well MEA plate. (a) Overview of an MEA plate. (b) Phase contrast image of 16 electrodes per well. Scale bars = 100 μm. (c) Immunofluorescent image of neurons and co-culture with astrocytes on an MEA chip at 11 weeks in vitro (WIV). Images show the neurons using β-tubulin III (green) and astrocytes using GFAP (red) immunostaining. Scale bars = 50 μm. (B) Typical spontaneous firing patterns at 8 WIV. (a) Raster plots of spontaneous firing for 5 min at 384 electrodes of 24 wells. Co-culture with astrocyte samples show below 192 electrodes. Raster plots above 192 electrodes is the data of neuron samples. (b) Typical waveform of synchronized burst firings (SBFs) for 1 min at 16 electrodes per wells in neurons (left) and co-culture with astrocytes (right). (C) Signal to noise ratio in the neurons only culture sample and co-culture sample. (n = 5 wells, two-tailed paired Student’s t-test, **p < 0.01) (a) Spike amplitude in neurons and co-culture sample. Spikes with negative voltage were detected in spontaneous firings for 10 min. The spike amplitude was calculated as an absolute value. (b) Noise in neurons and co-culture samples. Noise was calculated as the |average + S.D.| + |average − S.D.| of the voltage without spikes for 1 second. (c) The signal to noise ratio was calculated by dividing the average of spike amplitude by noise for each well.
Figure 2
Figure 2
Development of spontaneous firings and functional maturation. (A) Firing rate per active electrodes of neurons and co-culture with astrocytes (average for 10 min) from 3 to 10 WIV. White bar and black are neurons and co-culture, respectively. Differences in the firing rate between the neurons and co-culture samples were analyzed using two-way ANOVA followed by the Holm–Bonferroni Method. (**p < 0.001). Line graph shows the percentage of the number of active electrodes per 16 electrodes. n = 4 wells. (B) Electrophysiological function of glutamatergic receptors. (a) Raster plots of spontaneous firings in neuron samples for 5 min before, 25 µM AP-5, and cumulative 30 µM CNQX administration. (b) Raster plots in co-culture sample. (c) Change in total number of spikes before (100%, baseline) and after AP-5, and CNQX administration in neurons (white) and co-culture (black). (neurons, n = 4 wells, co-culture, n = 10 wells, one-way ANOVA and post hoc Dunnett’s test, *p < 0.05, **p < 0.01).
Figure 3
Figure 3
Induction of epileptiform activity by pentylentetrazole (PTZ) and 4-Aminopyridine (4-AP) administration, and the anticonvulsant effects of phenytoin at 9 WIV. Experiments of PTZ and 4-AP were performed in different wells of a 24-well MEA plate. (A) Induction of epileptiform activity using PTZ and the suppressive effect of phenytoin. (a) Raster plots for 1 min at PTZ and phenytoin administration in the neuron sample. PTZ was added to the culture medium at increasing concentrations (1 µM, 10 µM, 100 µM, and 1 mM). Phenytoin was then added (100 µM and 200 µM). (b) Responses of PTZ and phenytoin in co-culture with astrocytes. Scale bars = 1 min. (c) Changes in the number of SBFs versus before (%) during drug treatment in neurons and co-culture with astrocytes (n = 5 wells, **p < 0.01). Data were analyzed using one-way ANOVA followed by the Holm–Bonferroni method. (B) Induction of epileptiform activity using 4-AP, and the effects of phenytoin. (a) Raster plots for 1 min at 4-AP and phenytoin administration in neuron samples. 4-AP was added to the culture medium at increasing concentrations (1 µM, 10 µM, 30 µM, and 60 µM). Phenytoin was then added (100 µM, 200 µM, and 300 µM). (b) Responses of 4-AP and phenytoin in co-culture with astrocytes. Scale bars = 1 min. (c) Changes in the number of SBFs versus before (%) and during drug treatment in neurons and co-culture with astrocytes (n = 6 wells, *p < 0.05, **p < 0.01).
Figure 4
Figure 4
Peak time during an SBF with PTZ and 4-AP administration. (A) Representative peak of an SBF at PTZ 1 mM administration. (a) Upper graph shows the histogram of spikes during an SBF obtained at 16 electrodes (orange circle; start time of SBFs, yellow circle; peak time of SBFs, blue circle; end time of SBFs). Under graph shows raster plots of spontaneous firing at 16 electrodes. (b) Dose dependency in neurons and co-culture samples (n ≧ 5, N.S. is not significant). Data were analyzed using one-way ANOVA followed by post hoc Dunnett test. (B) Representative peak of an SBF at 4-AP 60 µM administration. (a) The peak time of spikes during an SBF shifted to the beginning of the SBF. (b) Dose dependency in neurons and co-culture samples (n ≧ 5, **p < 0.01).
Figure 5
Figure 5
Frequency analysis of SBFs with PTZ and 4-AP administration. (A) Wavelet analysis of the SBF induced by PTZ. (a) The local field potential (LFP) of an SBF before, 100 µM, and 1 mM PTZ obtained by the same electrode. LFP, high-pass filtered at 1 Hz was recorded. Red line shows frequency components below 250 Hz using a FIR high cut filter. (b) Corresponding scalograms of temporal scales during the application of PTZ are shown as left traces. The scalograms are computed from the raw trace, not the high-pass filtered data. Wavelet phase coherence with its own color bar shown to the right of it. (c) Scalograms of the difference between 1 mM PTZ and before administration. The graph below the scalograms shows the positive and negative changes in each band quantified by average wavelet transform coefficient per pixel in the neurons and co-culture samples, respectively. N is the analysis data of 6 electrodes. Five SBFs per electrode were analyzed and average values were used. Electrodes with a high S/N ratio were selected, and five typical SBFs with many active electrodes were selected. Statistical analysis used the the Holm–Bonferroni method. *indicates a significant difference with respect to β wave band (15–25 Hz), and indicates a significant difference with respect to high-γwave band (70–150 Hz; (*p < 0.05, **p < 0.01, p < 0.05, ††p < 0.01). (B) Wavelet analysis of the SBF induced by 4-AP. (a) The local field potential (LFP) of an SBF before, 1 µM, and 30 µM 4-AP obtained by the same electrode. (b) Corresponding spectrograms of temporal scales during the application of 4-AP are shown as left traces. (c) Spectrograms of the difference between 30 µM 4-AP and before administration. The graph below the scalograms shows the positive and negative changes in each band quantified by average wavelet transform coefficient per pixel in neurons and co-culture samples, respectively. (n = 6 electrodes, 5 SBFs were analyzed per electrode. *is versus 15–25 Hz. is versus 70–150 Hz. *p < 0.05, **p < 0.01, p < 0.05, ††p < 0.01).

Similar articles

Cited by

References

    1. Anson BD, Kolaja KL, Kamp TJ. Opportunities for use of human iPS cells in predictive toxicology. Clinical pharmacology and therapeutics. 2011;89:754–758. doi: 10.1038/clpt.2011.9. - DOI - PMC - PubMed
    1. Ohara R, et al. Modeling Drug-Induced Neuropathy Using Human iPSCs for Predictive Toxicology. Clinical pharmacology and therapeutics. 2017;101:754–762. doi: 10.1002/cpt.562. - DOI - PubMed
    1. Aschner M, et al. Reference compounds for alternative test methods to indicate developmental neurotoxicity (DNT) potential of chemicals: example lists and criteria for their selection and use. Altex. 2017;34:49–74. - PMC - PubMed
    1. Pamies D, et al. A human brain microphysiological system derived from induced pluripotent stem cells to study neurological diseases and toxicity. Altex. 2017;34:362–376. doi: 10.14573/altex.1609122. - DOI - PMC - PubMed
    1. Cook D, et al. Lessons learned from the fate of AstraZeneca’s drug pipeline: a five-dimensional framework. Nature reviews. Drug discovery. 2014;13:419–431. doi: 10.1038/nrd4309. - DOI - PubMed

Publication types

MeSH terms