. 2018 Jul 10;9(7):773.
doi: 10.1038/s41419-018-0806-4.

Oncogenic addiction to high 26S proteasome level

Affiliations

Oncogenic addiction to high 26S proteasome level

Peter Tsvetkov et al. Cell Death Dis. .

Abstract

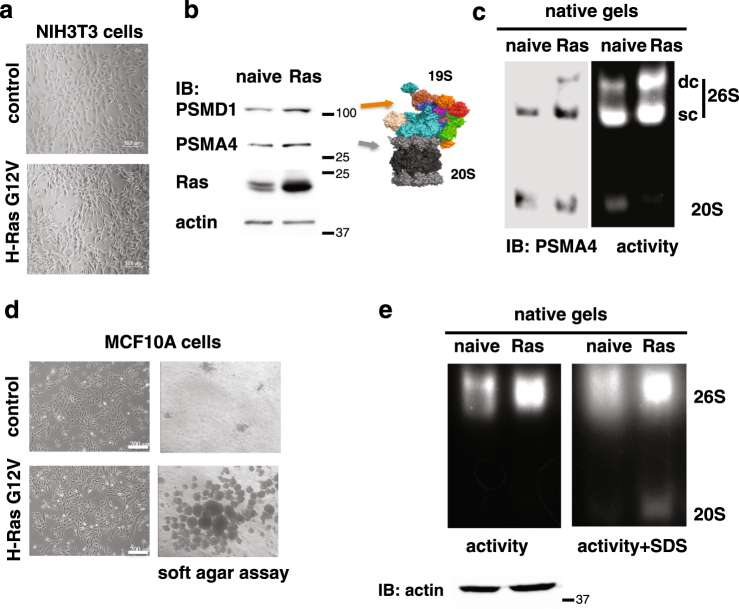
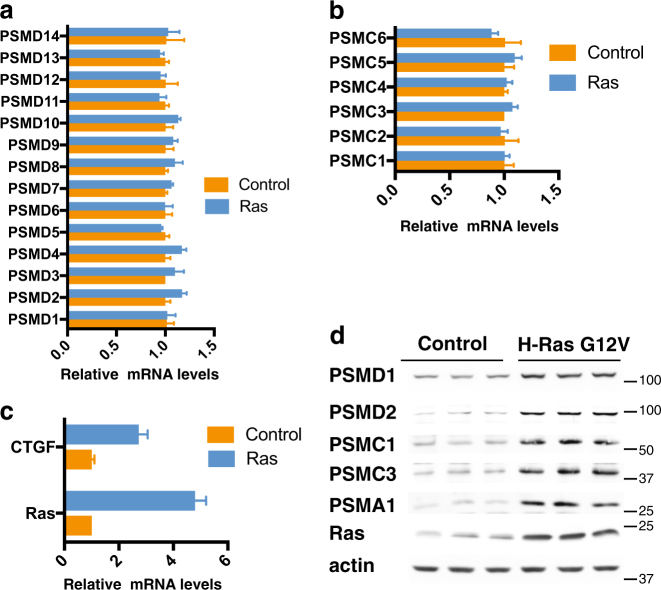
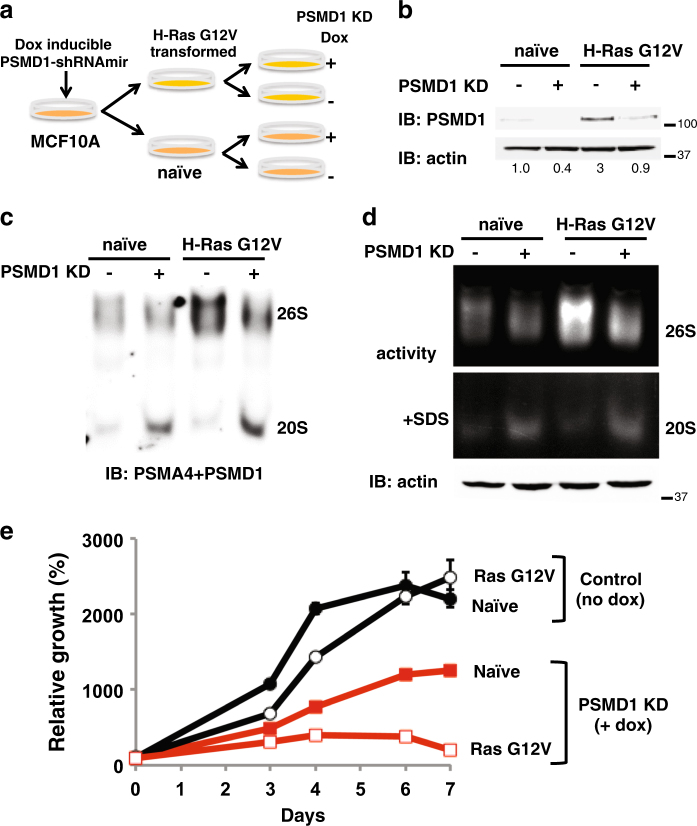
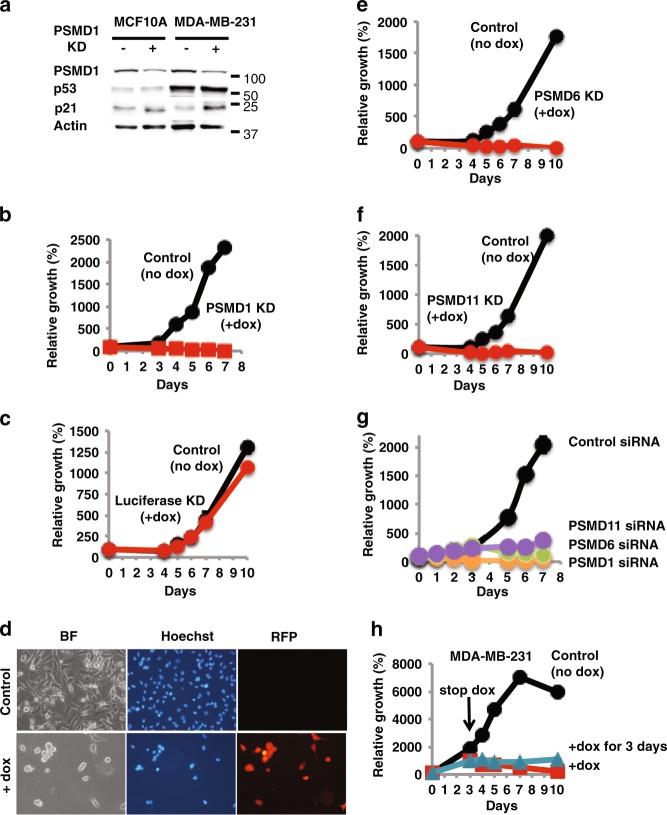
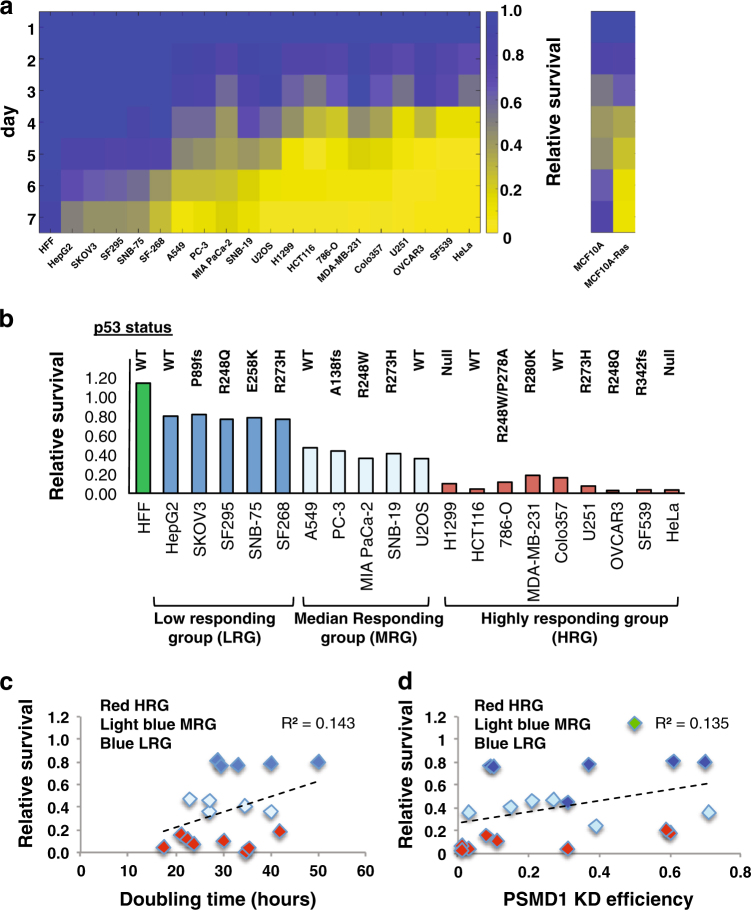
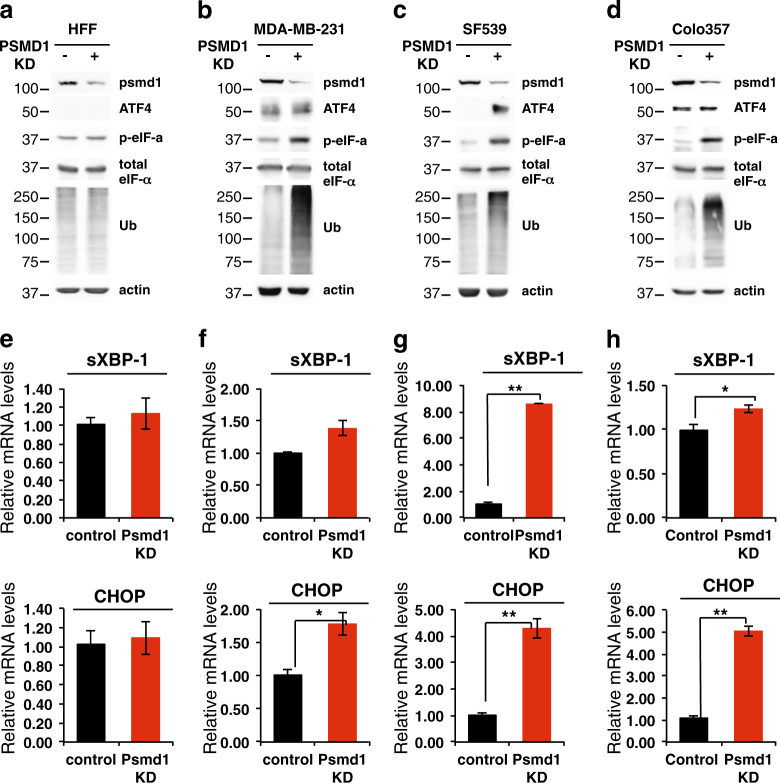
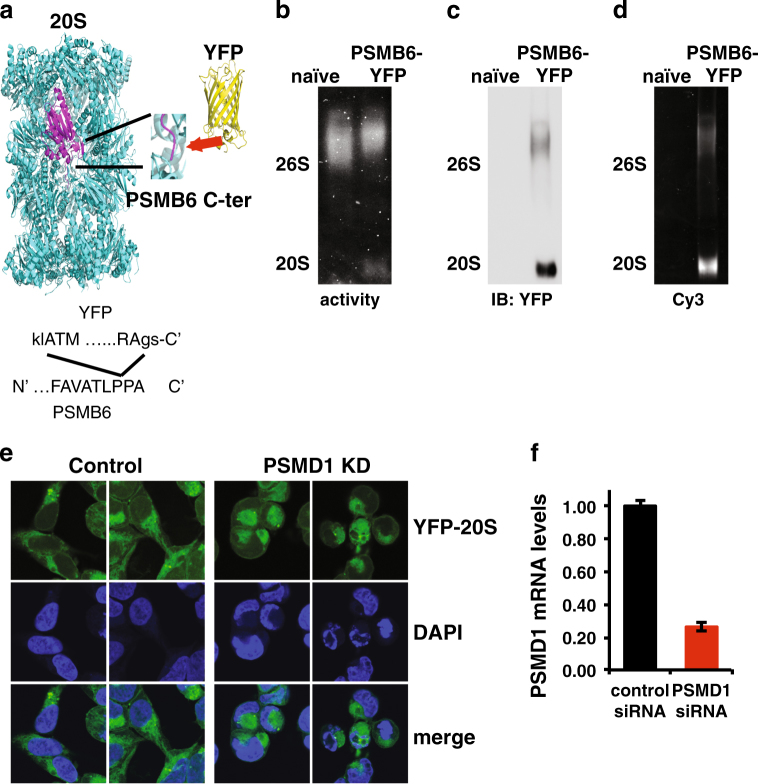
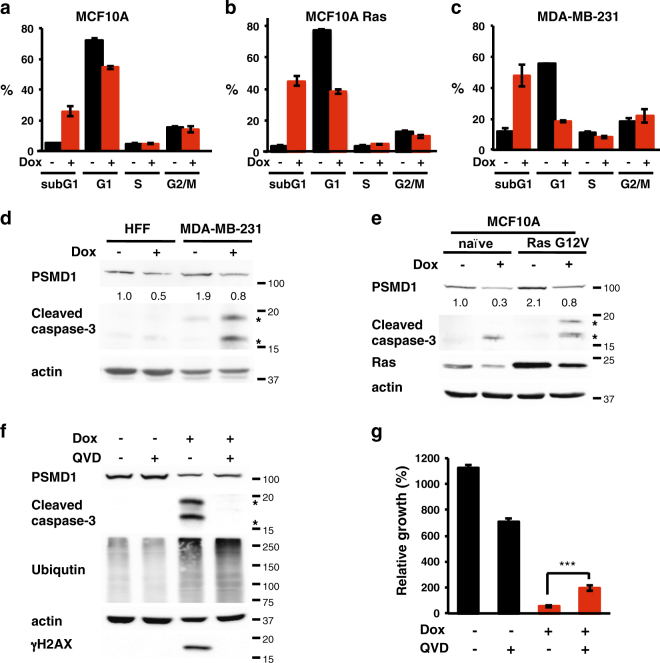
Proteasomes are large intracellular complexes responsible for the degradation of cellular proteins. The altered protein homeostasis of cancer cells results in increased dependency on proteasome function. The cellular proteasome composition comprises the 20S catalytic complex that is frequently capped with the 19S regulatory particle in forming the 26S proteasome. Proteasome inhibitors target the catalytic barrel (20S) and thus this inhibition does not allow the deconvolution of the distinct roles of 20S versus 26S proteasomes in cancer progression. We examined the degree of dependency of cancer cells specifically to the level of the 26S proteasome complex. Oncogenic transformation of human and mouse immortalized cells with mutant Ras induced a strong posttranscriptional increase of the 26S proteasome subunits, giving rise to high 26S complex levels. Depletion of a single subunit of the 19S RP was sufficient to reduce the 26S proteasome level and lower the cellular 26S/20S ratio. Under this condition the viability of the Ras-transformed MCF10A cells was severely compromised. This observation led us to hypothesize that cancer cell survival is dependent on maximal utilization of its 26S proteasomes. We validated this possibility in a large number of cancer cell lines and found that partial reduction of the 26S proteasome level impairs viability in all cancer cells examined and was not correlated with cell doubling time or reduction efficiency. Interstingly, normal human fibroblasts are refractory to the same type of 26S proteasome reduction. The suppression of 26S proteasomes in cancer cells activated the UPR and caspase-3 and cells stained positive with Annexin V. In addition, suppression of the 26S proteasome resulted in cellular proteasome redistribution, cytoplasm shrinkage, and nuclear deformation, the hallmarks of apoptosis. The observed tumor cell-specific addiction to the 26S proteasome levels sets the stage for future strategies in exploiting this dependency in cancer therapy.


Conflict of interest statement

The authors declare that they have no conflict of interest.

Figures

Fig. 1
Fig. 1. The H-Ras G12V-transformed NIH3T3 and MCF10A cells contain high levels of 26S proteasome.
a NIH3T3 cells were transduced with retroviruses carrying H-Ras G12V gene, and visualized by microscopy. The cells displayed a transformed phenotype with a spindle-shaped and highly refractile morphology. b Expression of the proteasomal subunits PSMA4, a 20S component, and PSMD1, a 19S component, was tested by immunoblot (IB). c 26S and 20S proteasomal complex activity and levels were analyzed by native gel electrophoresis in both naive NIH3T3 and Ras-transformed cells. Equal amount of total protein, determined by Bradford assay, was loaded onto native gels (actin loading control is represented). The 26S complex is either double capped, namely each of both ends of the 20S proteasome is occupied by a 19S complex (DC-26S) or single capped (SC-26S). d MCF10A were transduced with retroviruses carrying pBabe H-Ras G12V gene, visualized by microscopy and subjected to soft agar assay. Transformation was evidenced by a fibroblast-like appearance and a dispersed cell distribution in monolayer culture (left) and by anchorage-independent growth in soft agar (right). e 26S and 20S proteasomal complex activity and levels were analyzed by native gel electrophoresis in both naive MCF10A and Ras-transformed cells. In the right panel, for the visualization of the 20S complex, the proteasomal activity was enhanced by the addition of 0.02% SDS to the activity reaction
Fig. 2
Fig. 2. H-Ras G12V-transformed MCF10A cells show increased protein level of the components of the 19S subunits.
MCF10A were transduced with retroviruses carrying H-Ras G12V gene. mRNA levels of all PSMD (a) and PSMC (b) proteasomal subunits, as well as of Ras and CTGF genes (c), were measured by qPCR. Protein levels of selected proteasomal subunits were tested in triplicate by immunoblot (d)
Fig. 3
Fig. 3. H-Ras G12V-transformed MCF10A are addicted to high 26S proteasome levels.
a Schematic description of the experimental strategy. MCF10A stably expressing doxycycline-inducible PSMD1 shRNA were further subjected to transformation with H-Ras G12V. PSMD1 KD was induced by the addition of 1 μg/ml doxycycline for 72 h. b Protein content in the MCF10A naive and H-Ras G12V-transformed cells, in the presence or absence of PSMD1 shRNA induction, was analyzed by immunoblot. Quantification of the amount PSMD1, normalized to the amount of actin, is presented. c The 26S and 20S proteasomal complex levels were analyzed by native gel electrophoresis as described in Fig. 1c. d The levels of the 26S and 20S proteasome activity were determined as in Fig. 1c. Equal amounts of total protein, determined by Bradford assay, were loaded onto native gels (actin loading control is represented). e Cell proliferation rate was analyzed using the XTT assay. Naive or Ras-transformed MCF10A cells harboring a doxycycline-inducible PSMD1 shRNA were either doxycycline treated to induce PSMD1 shRNA expression or left untreated, and cell proliferation was followed daily. XTT at the seeding day was taken as 100% in measuring relative cell growth
Fig. 4
Fig. 4. A triple negative breast cancer cell line is addicted to high 26S proteasome levels.
a MCF10A and MDA-MB-231 cells harboring a doxycycline-inducible PSMD1 shRNA were either doxycycline treated to induce PSMD1 shRNA expression or left untreated. The levels of p53, p21, and PSMD1 were analyzed by immunoblot. b Growth of MDA-MB-231 cells expressing doxycycline-inducible PSMD1 shRNA was analyzed using the XTT assay. c Growth of MDA-MB-231 cells expressing doxycycline-inducible shRNA designed against the luciferase gene was analyzed as in b, ruling out non-specific doxycycline effects. d Visualization of the 26S-depleted MDA-MB-231 cells 4 days after PSMD1 shRNA induction. Expression of RFP as a marker for shRNA expression, and nuclear staining by DAPI are shown. Growth of MDA-MB-231 cells expressing doxycycline-inducible PSMD6 shRNA (e) and PSMD11 shRNA (f) was analyzed as in b. g Effect of synthetic siRNA designed against PSMD1, 6 or 11 or the luciferase gene on growth of MDA-MB-231 cells. Cells were transfected with the above siRNAs, and, after 24 h were replated for the XTT assay. h Irreversible inhibition of cell proliferation and induction of cell killing in MDA-MB-231 cells by PSMD1 shRNA expression. Cells were induced to express PSMD1 shRNA for 3 days by doxycycline, and then washed and cultured in fresh medium without or with doxycycline for an additional 7 days. Cell proliferation was analyzed as in 4b
Fig. 5
Fig. 5. Aggressive and drug-resistant tumor cell lines are more susceptible to 26S depletion.
A panel of various cell lines harboring doxycycline-inducible PSMD1 shRNA were treated with doxycycline to induce PSMD1 shRNA expression or left untreated. Alternatively, cells were transfected with siRNA against PSMD1 or luciferase gene. Cell proliferation was quantified as described in Fig. 3e. a Heat map analysis showing the relative survival of multiple cell lines in the course of 26S depletion (left). Heat map analysis showing relative survival of an isogenic cell line pair (MCF10A versus Ras-transformed counterpart) (right). Relative survival is calculated as a ratio of viability of PSMD1 shRNA-expressing cells to the viability of control cells measured at the same time point. b Relative survival of different cell lines measured at day 5 of induction. Mutational status of the p53 gene is depicted for each cell line. c Relative survival at day 5 plotted against the doubling time of the tested cell lines. d Relative survival at day 5 plotted against PSMD1 KD efficiency in the tested cell lines (PSMD1 KD efficiency is calculated as a ratio of remaining PSMD1 levels in shRNA-induced cells divided by the PSMD1 levels of control cells at the same time point)
Fig. 6
Fig. 6. UPR activation in 26S-depleted cells.
Normal fibroblasts (HFF) (a, e) and representative cell lines from the “highly responding group” MDA-MB-231 (b, f), SF539 (c, g), and Colo357 (d, h) harboring doxycycline-inducible PSMD1 shRNA were either doxycycline treated to induce PSMD1 shRNA expression or left untreated. The levels of UPR markers ATF4 and p-eIFα were analyzed by immunoblot, and of CHOP and the spliced XBP-1 (sXBP-1) mRNA were measured by qPCR. *p < 0.05, **p < 0.01
Fig. 7
Fig. 7. 26S depletion induces cytosolic condensation and nuclear distortion.
a Experimental strategy of CRISPR/Cas9 editing to tag the endogenous 20S subunit PSMB6 with YFP at its C terminus (the N and C terminus of the YFP sequence are shown by capital letters). b The 26S and 20S proteasomal complex activity of the PSMB6-YFP proteasomes was analyzed by native gel electrophoresis in both naive and PSMB6-YFP cells as described. The 20S complex is shifted a bit higher with the addition of YFP. c The level of the YFP proteasome complexes was examined by immunoblotting with anti-YFP or by YFP fluorescence (Cy3 filter) (d). e Cellular morphology of PSMB6-YFP 293 cells upon 26S depletion. Endogenous proteasomes are visualized by YFP, and nuclei are stained by DAPI. HEK293 PSMB6-YFP cells were transfected with siRNA targeting PSMD1 or with control siRNA targeting luciferase. PSMD1 levels in siRNA-transfected PSMB6-YFP HEK293 cells were measured by qPCR (f)
Fig. 8
Fig. 8. The role of caspases in 26S depletion-mediated TNBC cell death.
Differential cell death response of (a) naive MCF10A, (b) Ras-transformed MCF10A, and (c) cancer cell line MDA-MB-231 upon 26S depletion. Cells harboring doxycycline-inducible PSMD1 shRNA were either doxycycline treated to induce PSMD1 shRNA expression or left untreated. Cell cycle was analyzed by FACS after 4 days, and cell death level was quantified by measuring subG1 fraction. d Caspase-3 cleavage in MDA-MB-231 cells versus normal fibroblasts was analyzed by immunoblot after 4 days of PSMD1 shRNA induction. Asterisks mark the 17 and 19 kD caspase-3 cleavage products. e Caspase-3 cleavage in MCF10A Ras-transformed versus naive MCF10A cells was analyzed by immunoblot after 4 days of PSMD1 shRNA induction. Role of caspases in cell death mediated by 26S depletion was examined by using pan-caspases inhibitor QVD. Cells were induced to express PSMD1 shRNA by doxycycline in the presence or absence of 25 μMQVD, and protein expression (f) and viability (g) were analyzed after 4 days

Similar articles

Cited by

References

    1. Hershko A, Ciechanover A. The ubiquitin system. Annu. Rev. Biochem. 1998;67:425–479. doi: 10.1146/annurev.biochem.67.1.425. - DOI - PubMed
    1. Collins GA, Goldberg AL. The logic of the 26S proteasome. Cell. 2017;169:792–806. doi: 10.1016/j.cell.2017.04.023. - DOI - PMC - PubMed
    1. Zwickl P, Voges D, Baumeister W. The proteasome: a macromolecular assembly designed for controlled proteolysis. Philos. Trans. R. Soc. Lond. B Biol. Sci. 1999;354:1501–1511. doi: 10.1098/rstb.1999.0494. - DOI - PMC - PubMed
    1. Varshavsky A. The ubiquitin system. Trends Biochem. Sci. 1997;22:383–387. doi: 10.1016/S0968-0004(97)01122-5. - DOI - PubMed
    1. Finley D, Chen X, Walters KJ. Gates, channels, and switches: elements of the proteasome machine. Trends Biochem. Sci. 2016;41:77–93. doi: 10.1016/j.tibs.2015.10.009. - DOI - PMC - PubMed

Publication types