. 2018 Nov;12(11):2723-2735.
doi: 10.1038/s41396-018-0212-z. Epub 2018 Jul 10.

Cross-feeding modulates antibiotic tolerance in bacterial communities

Affiliations

Cross-feeding modulates antibiotic tolerance in bacterial communities

Elizabeth M Adamowicz et al. ISME J. 2018 Nov.

Abstract

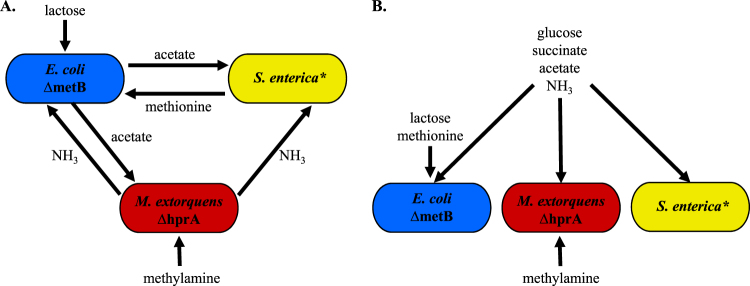
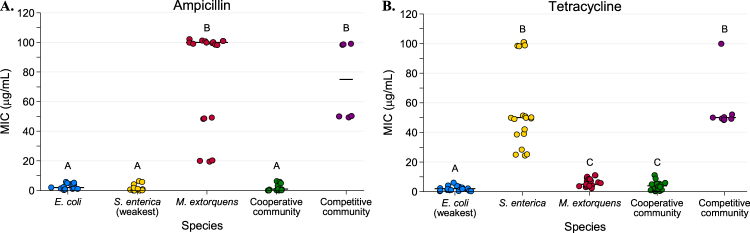
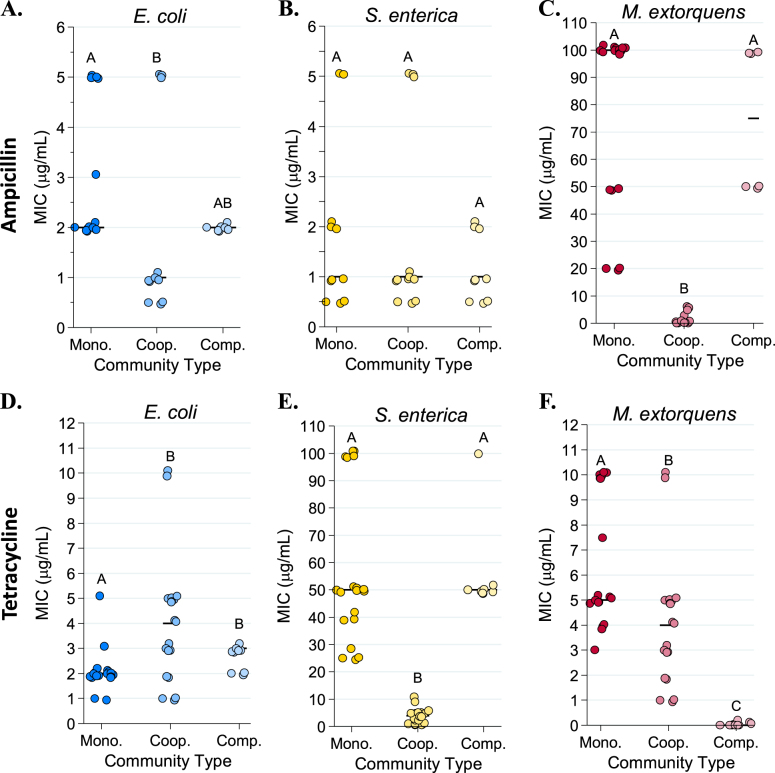
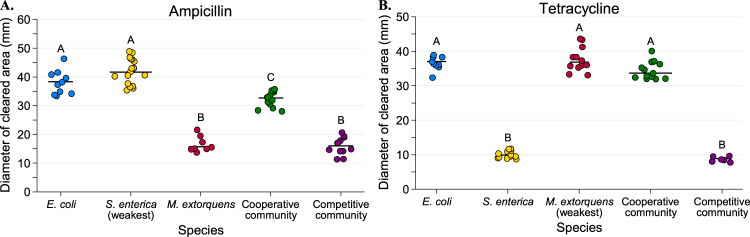
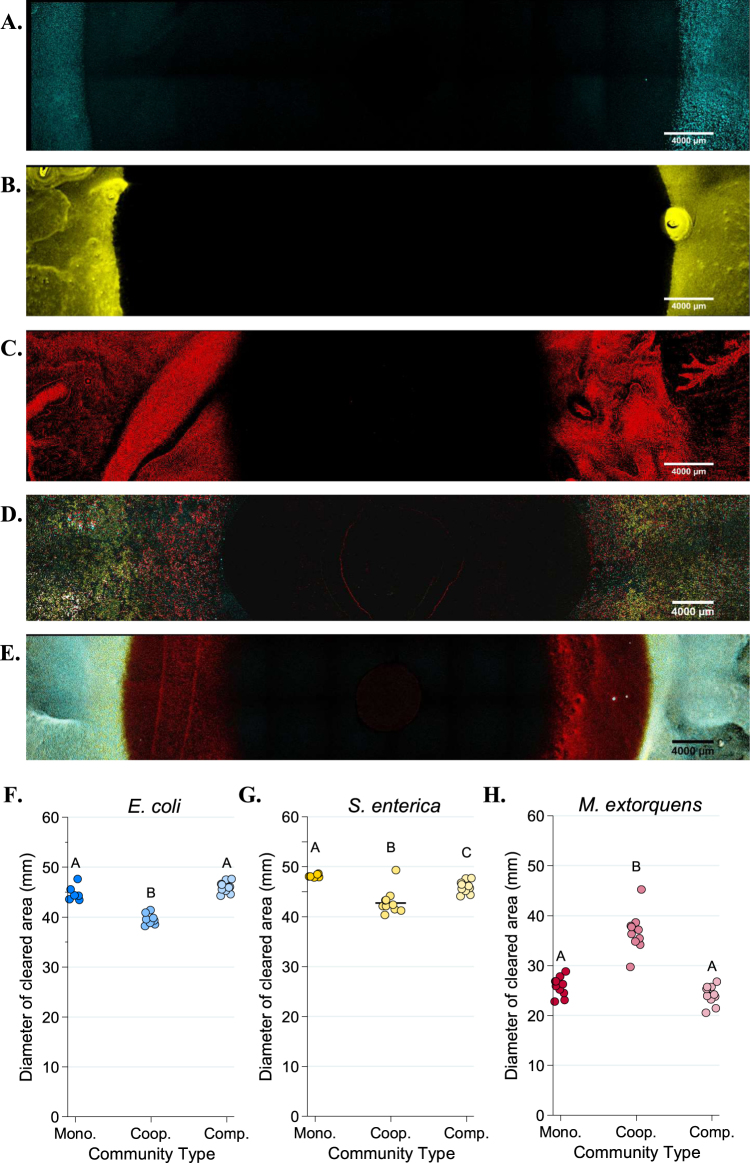
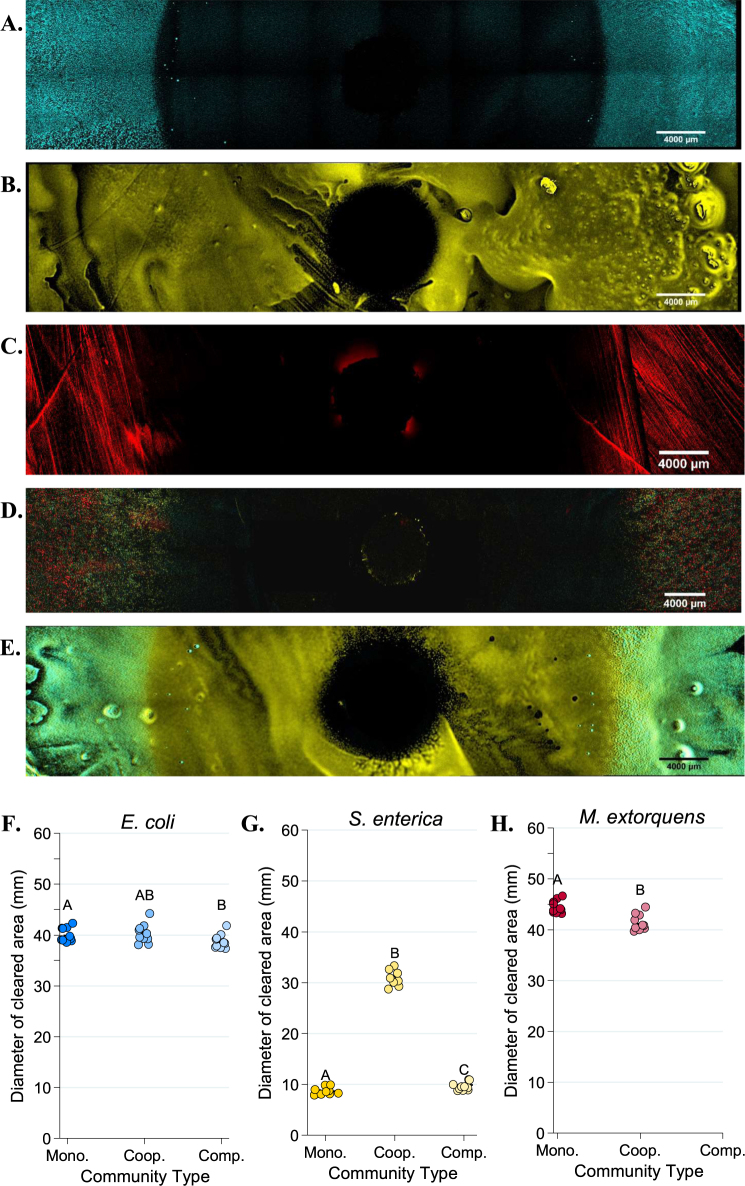
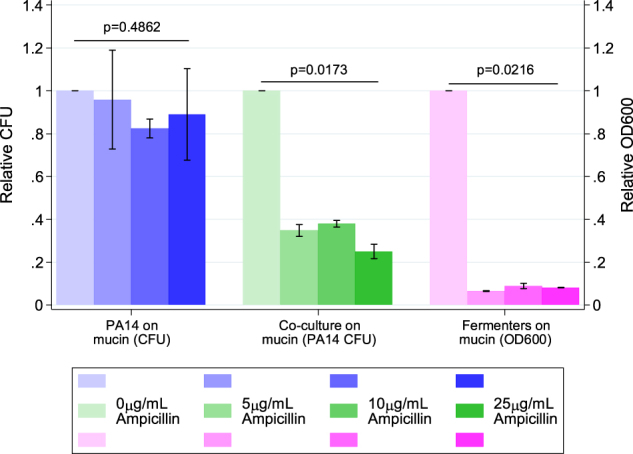
Microbes frequently rely on metabolites excreted by other bacterial species, but little is known about how this cross-feeding influences the effect of antibiotics. We hypothesized that when species rely on each other for essential metabolites, the minimum inhibitory concentration (MIC) for all species will drop to that of the "weakest link"-the species least resistant in monoculture. We tested this hypothesis in an obligate cross-feeding system that was engineered between Escherichia coli, Salmonella enterica, and Methylobacterium extorquens. The effect of tetracycline and ampicillin were tested on both liquid and solid media. In all cases, resistant species were inhibited at significantly lower antibiotic concentrations in the cross-feeding community than in monoculture or a competitive community. However, deviation from the "weakest link" hypothesis was also observed in cross-feeding communities apparently as result of changes in the timing of growth and cross-protection. Comparable results were also observed in a clinically relevant system involving facultative cross-feeding between Pseudomonas aeruginosa and an anaerobic consortium found in the lungs of cystic fibrosis patients. P. aeruginosa was inhibited by lower concentrations of ampicillin when cross-feeding than when grown in isolation. These results suggest that cross-feeding significantly alters tolerance to antibiotics in a variety of systems.


Conflict of interest statement

The authors declare that they have no conflict of interest.

Figures

Fig. 1
Fig. 1
Cooperative and competitive model communities. a Cooperative community. Methylamine and lactose are supplied in the growth medium as a nitrogen and a carbon source, respectively. E. coli consumes lactose and excretes acetate as a carbon source for S. enterica and M. extorquens. S. enterica secretes methionine for the methionine auxotroph E. coli. M. extorquens, which has a deletion in hprA that renders it unable to assimilate carbon from methylamine, provides nitrogen to the community via methylamine breakdown. b Competitive community. Growth medium contains all metabolites necessary for growth of each individual species such that no cross-feeding is necessary to support growth
Fig. 2
Fig. 2
Minimum inhibitory concentration (MIC) values for each monoculture and community type in ampicillin (a) and tetracycline (b) based on total population OD600. The “weakest link” species (i.e., the species with the lowest median MIC in monoculture) is indicated on the x-axis. Bars represent median values. MIC is defined as the minimum concentration of antibiotic required to inhibit growth by three times the time to observable growth of the antibiotic-free control. Cultures were grown on a Tecan plate reader with measurements every 15 min. At least eight replicates were performed for each species/antibiotic combination. Pairwise comparisons of median MIC were performed using a Mann–Whitney U test, with a Bonferroni correction applied for ten pairwise multiple comparisons. Shared letters indicate non-significant differences between groups
Fig. 3
Fig. 3
Species-specific minimum inhibitory concentration (MIC) values in monoculture, cooperative community, and competitive community in ampicillin (ac) and tetracycline (df). MIC was defined as the minimum concentration of antibiotic required to inhibit growth by three times the time to detectable growth of the antibiotic-free control MICs were calculated based on fluorescence (CFP for E. coli, YFP for S. enterica, and RFP for M. extorquens) recorded on a Tecan plate reader with fluorescence measurements every 15 min. Pairwise comparisons of median MIC were performed using a Mann–Whitney U test, with a Bonferroni correction applied for three multiple comparisons. Shared letters indicate non-significant differences between clusters
Fig. 4
Fig. 4
Diameters of zones of clearing for ampicillin (a) and tetracycline (b) disc diffusion assays. The diameter of the zone of clearing was measured three times for each plate and averaged for a single-plate measurement. At least eight replicate plates were measured for each monoculture and community type. The “weakest link” species (i.e., the species with the largest median zone of clearing in monoculture) is indicated on the x-axis. Pairwise comparisons of the zone of clearing for each monoculture and community was performed with a Mann–Whitney U test with Bonferroni adjustment for multiple comparisons. Significant differences are noted by different letters above each cluster; shared letters represent non-significant differences
Fig. 5
Fig. 5
Fluorescent microscopy images of Petri plates with ampicillin antibiotic discs. An AZ100 confocal fluorescent macroscope at ×3.40 magnification was used to image 12 × 2 fields of view of each Petri plate to visualize E. coli (CFP, in blue), S. enterica (YFP, in yellow) or M. extorquens (RFP, red). ae Representative images of E. coli monoculture (a), S. enterica monoculture (b), M. extorquens monoculture (c), cooperative community (d), and competitive community (e). Quantification of the diameter of the species-specific zone of clearing for E. coli (f), S. enterica (g), and M. extorquens (h) in each growth condition was performed in Elements software. The average of three technical replicate diameters was calculated to obtain a single measurement. At least 6 biological replicates were obtained for each species/growth condition. Pairwise comparisons of median diameter of clearing were performed using a Mann–Whitney U test, with a Bonferroni correction applied for three multiple comparisons. Significant differences are noted by different letters above each cluster
Fig. 6
Fig. 6
Fluorescent microscopy images of Petri plates with tetracycline antibiotic discs. An AZ100 confocal fluorescent macroscope at ×3.40 magnification was used to image 12 × 2 fields of view of each Petri plate to visualize E. coli (CFP, in blue), S. enterica (YFP, in yellow) or M. extorquens (RFP, red). ae Representative images of E. coli monoculture (a), S. enterica monoculture (b), M. extorquens monoculture (c), cooperative community (d), and competitive community (e). Quantification of the diameter of the species-specific zone of clearing for E. coli (f), S. enterica (g), and M. extorquens (h) in each growth condition was performed in Elements software. The average of three technical replicate diameters was calculated to obtain a single measurement. At least 6 biological replicates were obtained for each species/growth condition, except for M. extorquens in competition in tetracycline, for which no RFP signal could be detected. Pairwise comparisons of median diameter of clearing were performed using a Mann–Whitney U test, with a Bonferroni correction applied for three multiple comparisons. Significant differences are noted by different letters above each cluster
Fig. 7
Fig. 7
Ampicillin tolerance of Pseudomonas aeruginosa PA14 grown, PA14 cross-feeding with a mucin-fermenting community, and the mucin-fermenting community alone. PA14 colony-forming units (CFUs) from monocultures and co-cultures were enumerated by plating cells from each ampicillin concentration on LB agar after 16 h of growth. Fermenter community OD600 was measured with a Biotek Synergy H1 plate reader after 48 h of growth. Normalized OD600 and CFU values were calculated for each concentration of ampicillin by dividing raw values for the OD600 or CFU value at that concentration by the raw OD600 or CFU value of growth at 0 µg/mL ampicillin. Each point represents the mean and standard deviation of triplicate samples. P-values were calculated using a Kruskal–Wallis test across ampicillin concentrations using relative CFU (for PA14) or OD600 (for fermenters)

References

    1. World Health Organization. Antimicrobial resistance: global report on surveillance. Geneva: WHO; 2014.
    1. Friman V.-P., Guzman L. M., Reuman D. C., Bell T. Bacterial adaptation to sublethal antibiotic gradients can change the ecological properties of multitrophic microbial communities. Proceedings of the Royal Society B: Biological Sciences. 2015;282(1806):20142920–20142920. doi: 10.1098/rspb.2014.2920. - DOI - PMC - PubMed
    1. Hughes D, Andersson DI. Selection of resistance at lethal and non-lethal antibiotic concentrations. Curr Opin Microbiol Antimicrob Genomics. 2012;15:555–60. doi: 10.1016/j.mib.2012.07.005. - DOI - PubMed
    1. Tay WH, Chong KKL, Kline KA. Polymicrobial–host interactions during infection. J Mol Biol Mol Mech Host-Pathog Interact. 2016;428:3355–71. doi: 10.1016/j.jmb.2016.05.006. - DOI - PubMed
    1. de Vos MGJ, Zagorski M, McNally A, Bollenbach T. Interaction networks, ecological stability, and collective antibiotic tolerance in polymicrobial infections. Proc Natl Acad Sci USA. 2017;114:10666–71. doi: 10.1073/pnas.1713372114. - DOI - PMC - PubMed

Publication types

MeSH terms