. 2018 Nov;37(46):6011-6024.
doi: 10.1038/s41388-018-0388-8. Epub 2018 Jul 10.

Exposure of Barrett's and esophageal adenocarcinoma cells to bile acids activates EGFR-STAT3 signaling axis via induction of APE1

Affiliations

Exposure of Barrett's and esophageal adenocarcinoma cells to bile acids activates EGFR-STAT3 signaling axis via induction of APE1

Ajaz A Bhat et al. Oncogene. 2018 Nov.

Abstract

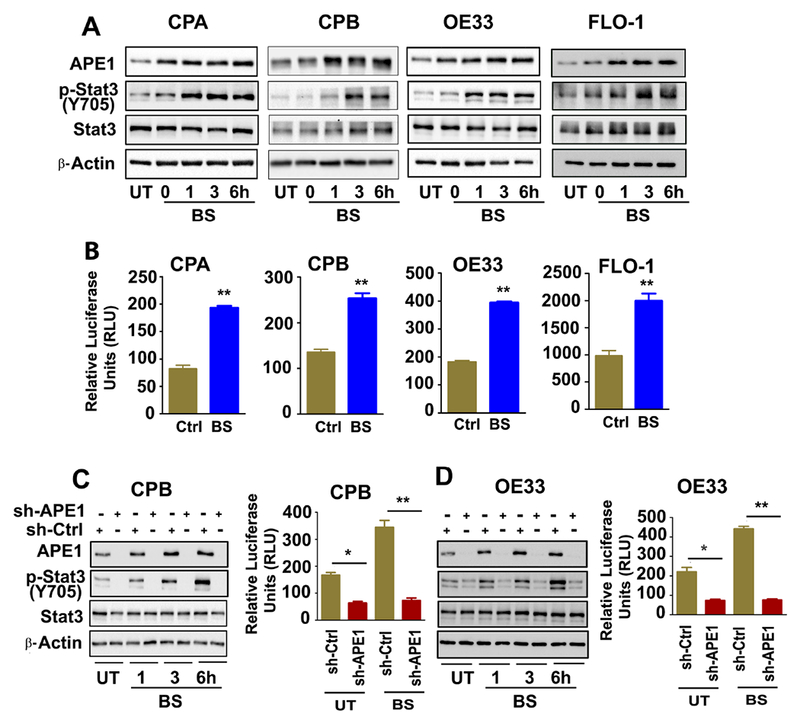
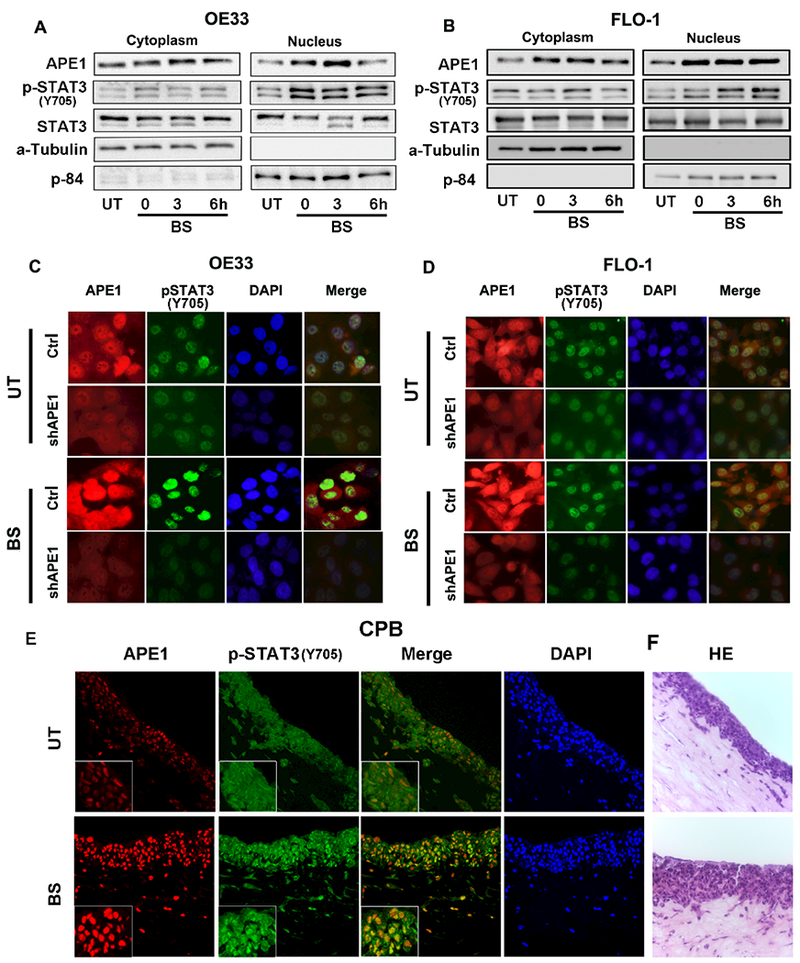
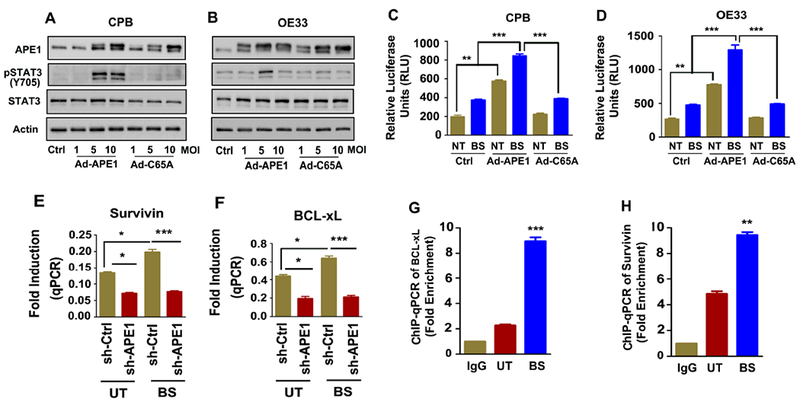
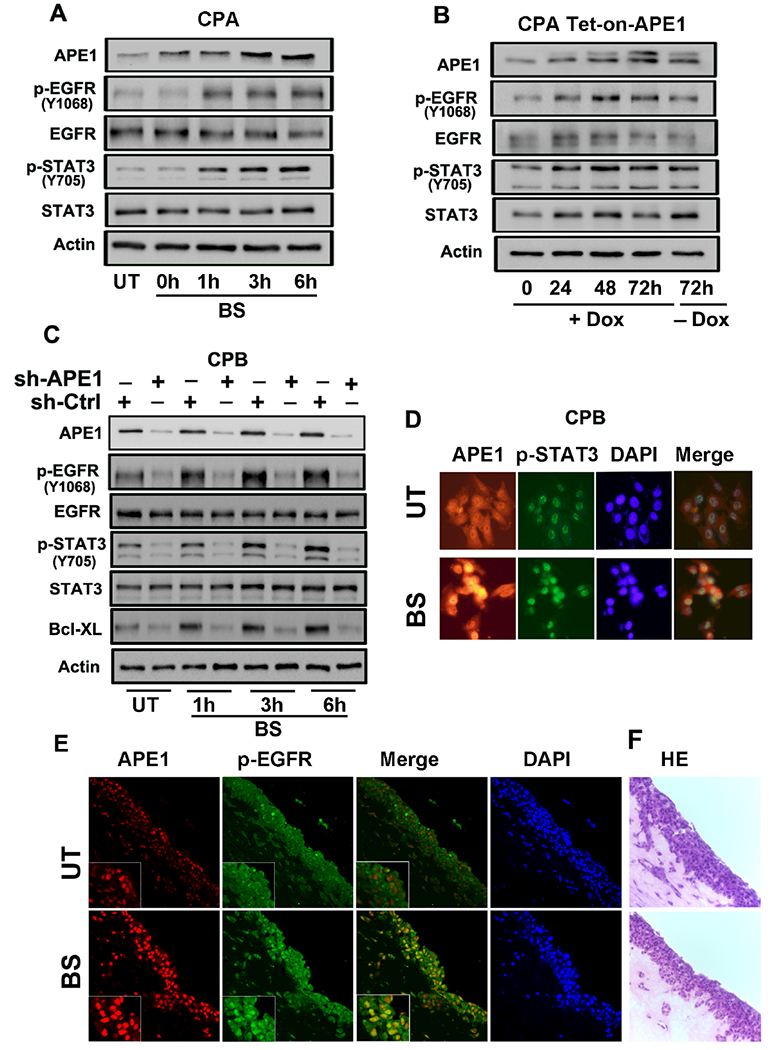
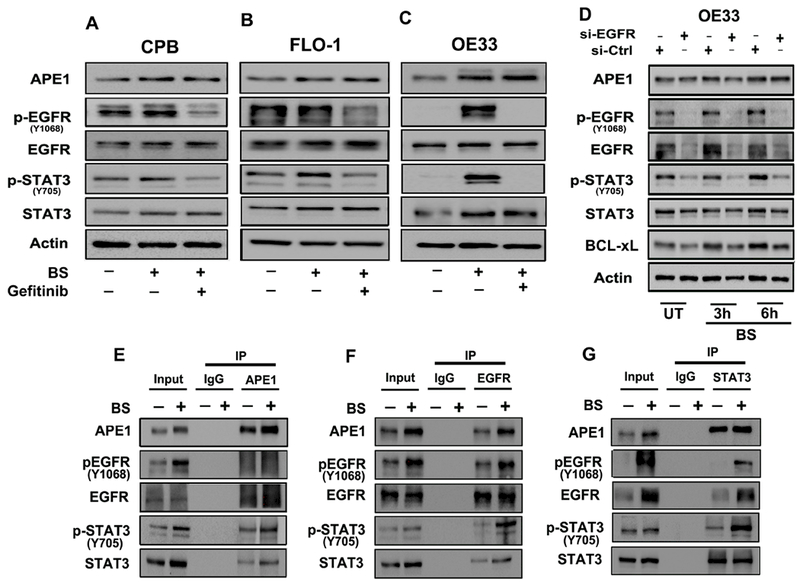
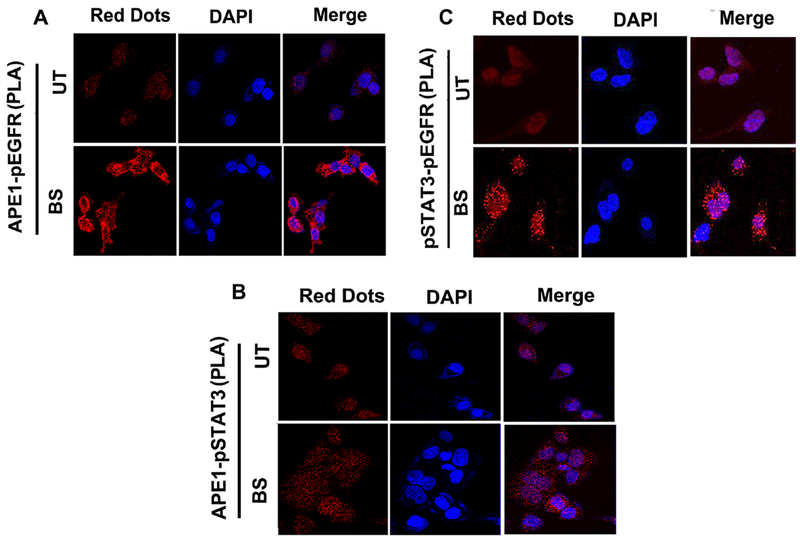
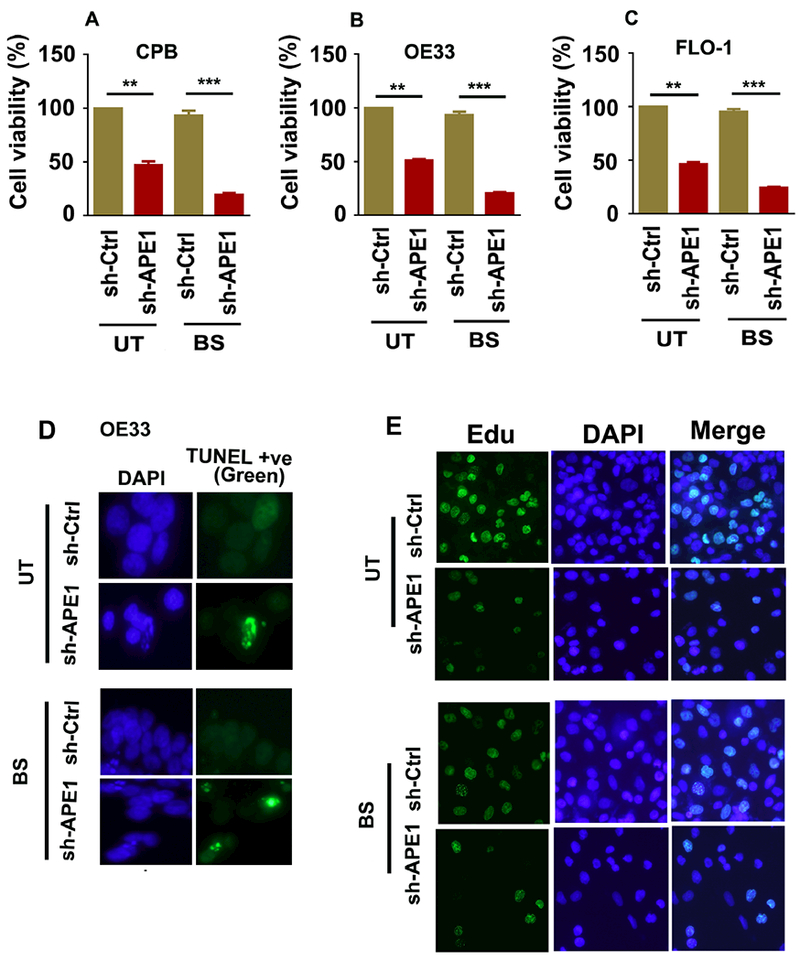
The development of Barrett's esophagus (BE) and its progression to esophageal adenocarcinoma (EAC) is highly linked to exposure to acidic bile salts due to chronic gastroesophageal reflux disease (GERD). In this study, we investigated the role of Apurinic/apyrimidinic endonuclease 1/redox effector factor-1 (APE1/REF-1) in STAT3 activation in response to acidic bile salts. Our results indicate that APE1 is constitutively overexpressed in EAC, whereas its expression is transiently induced in response to acidic bile salts in non-neoplastic BE. Using overexpression or shRNA knockdown of APE1, we found that APE1 is required for phosphorylation, nuclear localization, and transcriptional activation of STAT3. By using an APE1 redox-specific mutant (C65A) and APE1 redox inhibitor (E3330), we demonstrate that APE1 activates STAT3 in a redox-dependent manner. By using pharmacologic inhibitors and genetic knockdown systems, we found that EGFR is a required link between APE1 and STAT3. EGFR phosphorylation (Y1068) was directly associated with APE1 levels and redox function. Co-immunoprecipitation and proximity ligation assays indicated that APE1 coexists and interacts with the EGFR-STAT3 protein complex. Consistent with these findings, we demonstrated a significant induction in mRNA expression levels of STAT3 target genes (IL-6, IL-17A, BCL-xL, Survivin, and c-MYC) in BE and EAC cells, following acidic bile salts treatment. ChIP assays indicated that acidic bile salts treatment enhances binding of STAT3 to the promoter of its target genes, Survivin and BCL-xL. Inhibition of APE1/REF-1 redox activity using E3330 abrogated STAT3 DNA binding and transcriptional activity. The induction of APE1-STAT3 axis in acidic bile salts conditions provided a survival advantage and promoted cellular proliferation. In summary, our study provides multiple pieces of evidence supporting a critical role for APE1 induction in activating the EGFR-STAT3 signaling axis in response to acidic bile salts, the main risk factor for Barrett's carcinogenesis.


Conflict of interest statement

Disclosure of Potential Conflicts of Interest: No potential conflicts of interest were disclosed

Figures

Figure 1.
Figure 1.. Acidic bile salts (pH4) induce APE1-dependent activation of STAT3 in BE and EAC cells
BE (CPA, CPB, A) and EAC (OE33, FLO-1, A) cells were treated with acidic bile salts (100 μM, pH4) for 20 minutes, followed by a recovery in complete media. The samples were collected at 0, 1, 3 and 6h after recovery and analyzed by western blotting for the indicated proteins, β- Actin was used as an internal control. The luciferase reporter assay for STAT3 transcriptional regulation was performed in BE (CPA, CPB, B) and EAC (OE33, FLO-1, B) cells transfected with STAT3-Luc-reporter plasmid followed by treatment with bile salts (100 μM) for 20 minutes. The samples were collected and read for the reporter activity at 6h post recovery. APE1 stable knockdown cells CPB-shAPE1 (C) and OE33-shAPE1 (D) cells, and their control cells (CPB-shCtrl and OE33-shCtrl) were treated with acidic (pH4) bile salts (100 μM) for 20 minutes, followed by a recovery in complete media. The samples were collected at 1, 3 and 6h after recovery and analyzed by western blotting for the indicated proteins, β- Actin was used as an internal control. The luciferase reporter assay for STAT3 transcriptional regulation was performed in CPB-shAPE1 (C), OE33-shAPE1 (D) cells and their control cells by treatment with bile salts (100 μM) for 20 minutes. The samples were collected for the reporter activity at 6h post recovery. The results are expressed as the mean ± SEM of three independent experiments. BS, Bile salts; UT, Untreated. *p<0.05, **p < 0.01 using one-way ANOVA.
Figure 2.
Figure 2.. APE1 drives acidic bile salts induced STAT3 nuclear accumulation in BE and EAC cells
Immunoblot analysis of cytoplasmic and nuclear fractions of OE33 (A) and FLO-1 cells (B) treated with acidic (pH4) bile salts (100 μM) for 20 minutes, followed by a recovery in complete media. The samples were collected at 0, 3 and 6h post recovery. Alpha-tubulin represents a loading control for the cytoplasmic fraction, and p84 for the nuclear fraction. Immunofluorescent images of APE1 stable knockdown cells, OE33-shAPE1 (C) and FLO-1-shAPE1 (D), and their control cells (shCtrl) treated with acidic (pH4) bile salts (100 μM). Cells were stained for APE1 (red), pSTAT3 (green) and nuclei with DAPI (blue). (E) Immunocytochemistry staining of 3D organotypic culture with APE1 (red) and p-STAT3 (green) using immunofluorescence. (F) HE images of organotypic culture corresponding to the fluorescent images. Results shown are representative of at least three independent experiments.
Figure 3.
Figure 3.. APE1 redox function is required for transcriptional activation of STAT3
CPB (BE, A) and OE33 (EAC, B) cells were infected with Control (Ad-ctrl) or Flag-APE1 (WT or C65A) adenoviral expression vector and allowed expression for 48h. C65A is a redox defective mutant of APE1. The samples were analyzed by western blotting for the indicated proteins, β- Actin was used as an internal control. The luciferase reporter assay for STAT3 transcriptional activation was performed in CPB (C) and OE33 (D) cells infected with Control (Ad-ctrl) or Flag-APE1 (WT or C65A) and treated with acidic bile salts (100 μM) for 20 minutes. The samples were collected and read for the reporter activity at 6h post recovery. APE1 stable knockdown cells, OE33-shAPE1, and its’ control (-shCtrl) cells were treated with acidic (pH4) bile salts (100 μM) for 1h. Total RNA was isolated and expression of Survivin (E) and BCL-xL (F) were measured by qPCR. The affinities of STAT3 to the promoters of BCL-xL (G) and Survivin (H), were determined by ChIP assay. OE33 cells were treated with acidic (pH4) bile salts (100 μM) for 1h. IgG works as ChIP control. qPCR quantification was done by specific ChIP primers. Shown is signal in the immunoprecipitates expressed as a fold enrichment. The results are expressed as the mean ± SEM of three independent experiments. Ctrl; Ad-Ctrl, MOI; Multiplicity of infection, NT; No treatment; BS; Bile Salt. **p < 0.01, **p < 0.001 using one-way ANOVA.
Figure 4.
Figure 4.. Bile salts-induced EGFR activation is mediated by APE1
(A) Immunoblot analysis of CPA cells treated with acidic (pH4) bile salts (100 μM) for 20 minutes, followed by a recovery in complete media. The samples were collected at 0, 1, 3 and 6h post recovery. (B) Doxycycline-inducible APE1-Tet-on CPA stable cells were treated with 200ng/ml Doxycycline for 72h and removal of doxycycline for next 72h. The samples were collected at 0, 24, 48 and 72h and analyzed by immunoblotting for the indicated proteins. (C) APE1 knockdown cells CPB-shAPE1 and its control cells CPB-shCtrl were treated with acidic (pH4) bile salts (100 μM) for 20 minutes, followed by a recovery in complete media. The samples were collected at 1, 3 and 6h post recovery and analyzed by immunoblotting for the indicated proteins, β- Actin was used as an internal control. (D) Immunofluorescent images of CPB cells treated with acidic (pH4) bile salts (100 μM). Cells were stained for APE1 (red), pSTAT3 (green) and nuclei with DAPI (blue). (E) Immunocytochemistry staining of 3D organotypic culture with APE1 (red) and p-EGFR (green) using immunofluorescence. (F) H&E images of organotypic culture corresponding to the fluorescent images. Results shown are representative of at least three independent experiments.
Figure 5.
Figure 5.. APE1 mediates bile salts-induced STAT3 activation via an EGFR-dependent mechanism
Immunoblot analysis of CPB (A), FLO-1 (B) and OE33 (C) cells pretreated with EGFR inhibitor (Gefitinib, 25 μM) followed by exposure to acidic (pH4) bile salts (100 μM). The samples were analyzed for the indicated proteins, β-actin was used as an internal control. (D) Immunoblot analysis of OE33 cells with EGFR-knockdown via EGFR siRNA followed by treatment with acidic (pH4) bile salts (100 μM) for 20 minutes and allowed to recover in complete media. The samples were collected at 3 and 6h post recovery and analyzed for the indicated proteins, β-actin was used as an internal control. Immunoprecipitation (IP) of APE1 (E), EGFR (F) and STAT3 (G) in OE33 cells treated with acidic (pH4) bile salts (100 μM) and immunoblotted for the indicated proteins. Results shown are representative of at least three independent experiments.
Figure 6.
Figure 6.. APE1 co-localizes with EGFR and STAT3
(A and B) In situ proximity ligation assay (PLA) demonstrates the interaction of p-EGFR and p-STAT3 with APE1. (C) In situ proximity ligation assay (PLA) demonstrates the interaction of p-EGFR and p-STAT3. Protein interactions (red fluorescent signals) were revealed by PLA anti-rabbit plus probe and PLA anti-mouse minus probe in OE33 cells treated with acidic (pH4) bile salts (100 μM) as mentioned in the materials and methods. Nuclei were stained with DAPI (blue). Results shown are representative of at least three independent experiments.
Figure 7.
Figure 7.. APE1 inhibition decreases cell viability, proliferation and enhances apoptosis in response to acidic bile salts
APE1-knockdown (shAPE1) in CPB, OE33 and FLO-1, and the control (shCtrl) cells were treated with acidic (pH4) bile salts (100μM) for 20 minutes, followed by a recovery in complete media. (A-C) The cell viability was measured by CellTiter-Glo assay in CPB (A), OE33 (B) and FLO-1 (C) cells at 24h post recovery. (D) The apoptosis was measured by a TUNEL assay in OE33 cells at 24h post recovery. (E) For cell proliferation, Edu cell proliferation assay was performed in OE33 cells. The results are expressed as the mean ± SEM of three independent experiments. BS, Bile salts; UT, Untreated. **p < 0.01, **p < 0.001 using one-way ANOVA.

References

    1. Cook MB, Chow WH, Devesa SS. Oesophageal cancer incidence in the United States by race, sex, and histologic type, 1977-2005. Br J Cancer. 2009;101(5):855–9. - PMC - PubMed
    1. Eloubeidi MA, Mason AC, Desmond RA, El-Serag HB. Temporal trends (1973-1997) in survival of patients with esophageal adenocarcinoma in the United States: a glimmer of hope? Am J Gastroenterol. 2003;98(7):1627–33. - PubMed
    1. Reid BJ, Li X, Galipeau PC, Vaughan TL. Barrett’s oesophagus and oesophageal adenocarcinoma: time for a new synthesis. Nat Rev Cancer. 2010;10(2):87–101. - PMC - PubMed
    1. Lagergren J. Adenocarcinoma of oesophagus: what exactly is the size of the problem and who is at risk? Gut. 2005;54 Suppl 1:i1–5. - PMC - PubMed
    1. Pera M, Manterola C, Vidal O, Grande L. Epidemiology of esophageal adenocarcinoma. J Surg Oncol. 2005;92(3):151–9. - PubMed

Publication types

MeSH terms

Supplementary concepts