. 2018 Jun 4:10:75.
doi: 10.1186/s13148-018-0507-y. eCollection 2018.

Promoter methylation of the MGAT3 and BACH2 genes correlates with the composition of the immunoglobulin G glycome in inflammatory bowel disease

Collaborators, Affiliations

Promoter methylation of the MGAT3 and BACH2 genes correlates with the composition of the immunoglobulin G glycome in inflammatory bowel disease

Marija Klasić et al. Clin Epigenetics. .

Abstract

Background: Many genome- and epigenome-wide association studies (GWAS and EWAS) and studies of promoter methylation of candidate genes for inflammatory bowel disease (IBD) have demonstrated significant associations between genetic and epigenetic changes and IBD. Independent GWA studies have identified genetic variants in the BACH2, IL6ST, LAMB1, IKZF1, and MGAT3 loci to be associated with both IBD and immunoglobulin G (IgG) glycosylation.

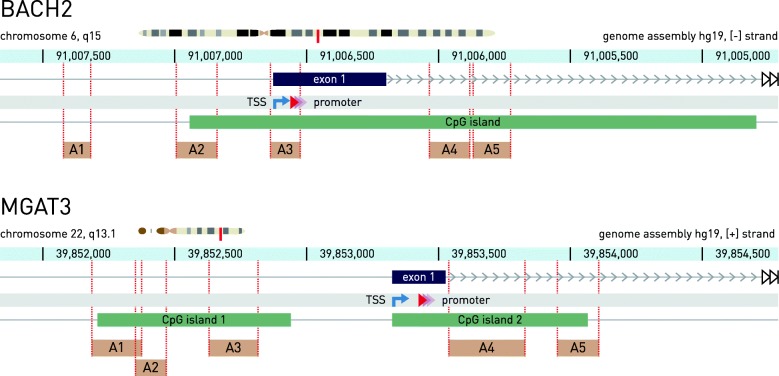
Methods: Using bisulfite pyrosequencing, we analyzed CpG methylation in promoter regions of these five genes from peripheral blood of several hundred IBD patients and healthy controls (HCs) from two independent cohorts, respectively.

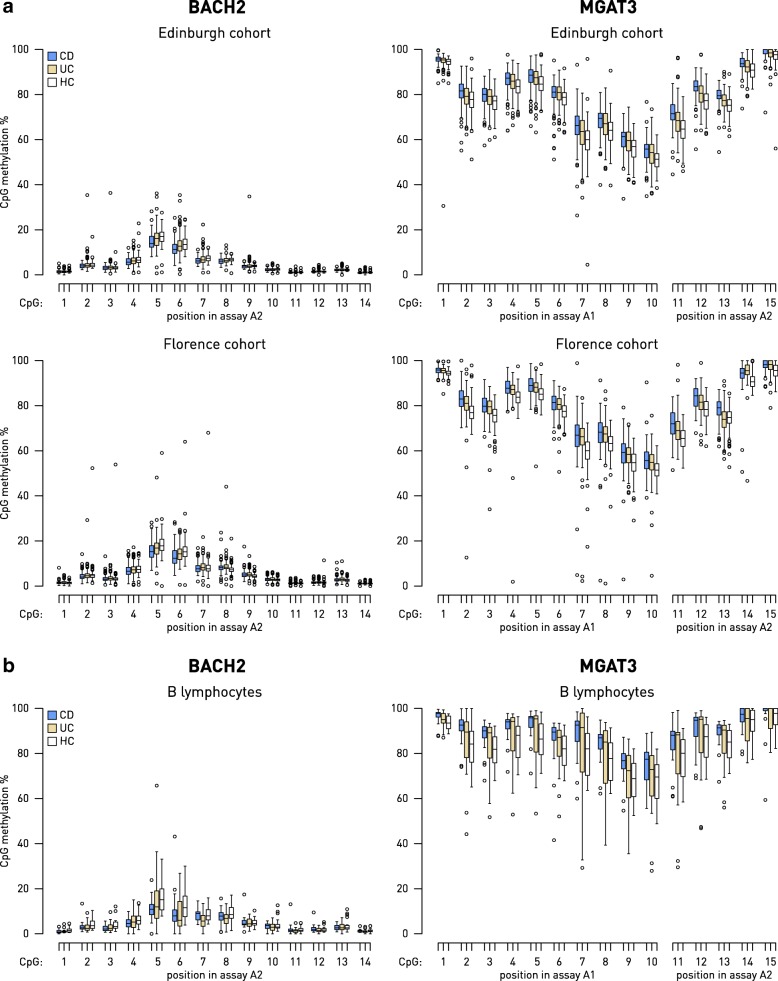
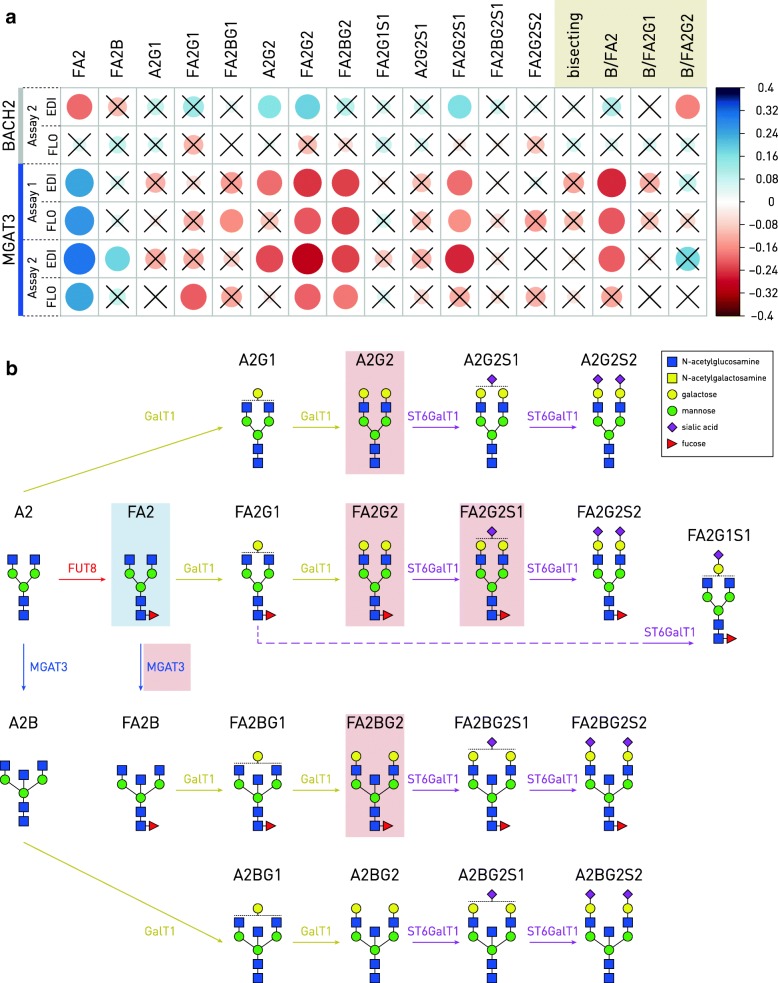
Results: We found significant differences in the methylation levels in the MGAT3 and BACH2 genes between both Crohn's disease and ulcerative colitis when compared to HC. The same pattern of methylation changes was identified for both genes in CD19+ B cells isolated from the whole blood of a subset of the IBD patients. A correlation analysis was performed between the MGAT3 and BACH2 promoter methylation and individual IgG glycans, measured in the same individuals of the two large cohorts. MGAT3 promoter methylation correlated significantly with galactosylation, sialylation, and bisecting GlcNAc on IgG of the same patients, suggesting that activity of the GnT-III enzyme, encoded by this gene, might be altered in IBD. The correlations between the BACH2 promoter methylation and IgG glycans were less obvious, since BACH2 is not a glycosyltransferase and therefore may affect IgG glycosylation only indirectly.

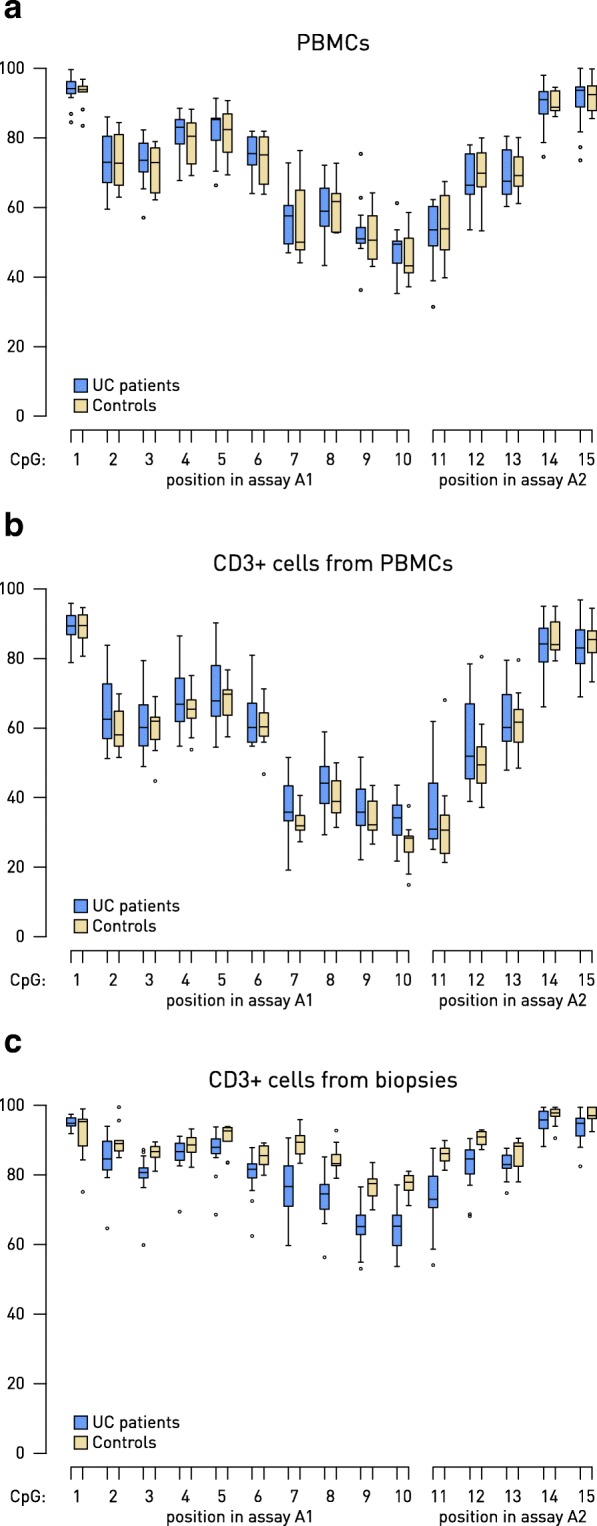
Conclusions: Our results suggest that epigenetic deregulation of key glycosylation genes might lead to an increase in pro-inflammatory properties of IgG in IBD through a decrease in galactosylation and sialylation and an increase of bisecting GlcNAc on digalactosylated glycan structures. Finally, we showed that CpG methylation in the promoter of the MGAT3 gene is altered in CD3+ T cells isolated from inflamed mucosa of patients with ulcerative colitis from a third smaller cohort, for which biopsies were available, suggesting a functional role of this glyco-gene in IBD pathogenesis.


Conflict of interest statement

For the Edinburgh and Florence cohorts, ethical approvals were obtained from Tayside Committee on Medical Ethics B, and all patients and controls provided written, informed consent (LREC 06/S1101/16, LREC 2000/4/192). For the patients from Portugal, all clinical procedures and research protocols were approved by the ethics committee of CHP/HSA, Portugal (233/12(179-DEFI/177-CES); all participants gave their informed consent.The authors declare that they have no competing interests.Springer Nature remains neutral with regard to jurisdictional claims in published maps and institutional affiliations.

Figures

Fig. 1
Fig. 1
Positions of the BACH2 and MGAT3 genes in the human genome and relative positions of the fragments analyzed for methylation level (pyrosequencing assays) within these genes. For each pyrosequencing assay (A1–A5), the region amplified by PCR is shown. Positions of the genes on the chromosomes are shown using chromosome models (red vertical lines). Coordinates are relative to the hg19 human genome assembly. The genes are displayed in the direction corresponding to their reading frames. Annotations (CpG islands and pyrosequencing assays) are to scale. TSS transcription start site
Fig. 2
Fig. 2
Box plot of CpG methylation in peripheral whole blood for the BACH2 and MGAT3 genes in the Edinburgh and Florence cohorts and in B cells from a subset of patients from Edinburgh cohort. Groups were compared using the Mann-Whitney U test with significance threshold of p = 0.05, corrected for multiple testing using the Bonferroni method. a Methylation levels were generally low in the assayed portion of the BACH2 gene promoter, with significant differences between HC and CD methylation at CpG sites 4, 5, 6, and 8 (replicated in both cohorts). For the MGAT3 gene, general methylation level was high, with all CpG sites showing a reproducibly significant difference between HC and both CD and UC, except for CpG sites 2, 13, and 15 for which reproducible significant differences were found only between HC and CD. b In B cells, isolated from PBMCs of a subset of the patients from the Edinburg cohort, differential methylation was found at the CpG position 5 of the BACH2 gene (assay 2) between HC and CD, while for the MGAT3 gene, differentially methylated were CpG sites 1–5, 12, and 13 between HC and CD. CD Crohn’s disease, UC ulcerative colitis, HC healthy controls
Fig. 3
Fig. 3
Box plot of CpG methylation level in the MGAT3 gene promoter (assays A1 and A2) analyzed from PBMCs (a), CD3+ T cells isolated from PBMCs (b), and CD3+ T cells isolated from inflamed colonic mucosa (c) from the independent cohort of Porto. Changes between UC patients with active disease and HC were statistically significant only in CD3+ T cells isolated from inflamed colonic mucosa at CpG positions 3 and 7–12 (p < 0.05 after Bonferroni correction for 15 hypotheses). PBMC peripheral blood mononuclear cells, UC ulcerative colitis, HC healthy controls
Fig. 4
Fig. 4
Correlations between CpG methylation in the BACH2 and MGAT3 gene promoters and glycan structures measured from the same individuals of the Edinburgh and Florence cohorts, mapped to the glycan biosynthesis pathways. a Correlation coefficients between average CpG methylation in the assayed gene promoter fragments and glycan structure percentages are shown as blue (positive) or red (negative correlation) circles with their size and shade proportional to the correlation coefficient. Correlations without statistical significance (p > 0.05 after Bonferroni correction for multiple testing) are crossed. Columns represent 13 individual glycan structures and four derived traits (beige box). EDI Edinburgh cohort, FLO Florence cohort, Bisecting, percentage of all structures with bisecting N-acetylglucosamine, B/FA2 ratio of FA2B to FA2 structures, B/FA2G1 ratio of FA2BG1 to FA2G1 structures, B/FA2G2 ratio of FA2BG2 to FA2G2 structures. b Glycan biosynthesis pathways with the glycan structures, labels, and the enzymes mapped to correlation results for the MGAT3 gene. Light blue rectangles indicate positive, while light red rectangles indicate negative correlation between the glycan structures or traits and CpG methylation levels. Only correlations replicated across assays and/or cohorts are shown. The red rectangle around the MGAT3 enzyme reflects the negative correlation between CpG methylation and the derived trait B/FA2, which effectively measures enzyme activity at this step. MGAT3 N-acetilglucosaminyltransferase III (GnT-III), FUT8 fucosyltransferase 8, GalT1 galactosyltranserase 1, ST6GalT1 Beta-galactoside alpha-2,6-sialyltransferase 1

References

    1. Burisch J, Pedersen N, Čuković-Čavka S, Brinar M, Kaimakliotis I, Duricova D, Shonová O, Vind I, Avnstrøm S, Thorsgaard N, et al. East–West gradient in the incidence of inflammatory bowel disease in Europe: the ECCO-EpiCom inception cohort. Gut. 2013;63:588–597. doi: 10.1136/gutjnl-2013-304636. - DOI - PubMed
    1. Xavier RJ, Podolsky DK. Unravelling the pathogenesis of inflammatory bowel disease. Nature. 2007;448:427–434. doi: 10.1038/nature06005. - DOI - PubMed
    1. Anderson CA, Boucher G, Lees CW, Franke A, D'Amato M, Taylor KD, Lee JC, Goyette P, Imielinski M, Latiano A, et al. Meta-analysis identifies 29 additional ulcerative colitis risk loci, increasing the number of confirmed associations to 47. Nat Genet. 2011;43:246–252. doi: 10.1038/ng.764. - DOI - PMC - PubMed
    1. Franke A, Balschun T, Sina C, Ellinghaus D, Häsler R, Mayr G, Albrecht M, Wittig M, Buchert E, Nikolaus S, et al. Genome-wide association study for ulcerative colitis identifies risk loci at 7q22 and 22q13 (IL17REL) Nat Genet. 2010;42:292–294. doi: 10.1038/ng.553. - DOI - PubMed
    1. Franke A, McGovern DP, Barrett JC, Wang K, Radford-Smith GL, Ahmad T, Lees CW, Balschun T, Lee J, Roberts R, et al. Genome-wide meta-analysis increases to 71 the number of confirmed Crohn’s disease susceptibility loci. Nat Genet. 2010;42:1118–1125. doi: 10.1038/ng.717. - DOI - PMC - PubMed

Publication types

MeSH terms

Substances

LinkOut - more resources