. 2018 Aug 21;18(17):2510-2522.
doi: 10.1039/c8lc00357b.

Microphysiological flux balance platform unravels the dynamics of drug induced steatosis

Affiliations

Microphysiological flux balance platform unravels the dynamics of drug induced steatosis

Avner Ehrlich et al. Lab Chip. .

Abstract

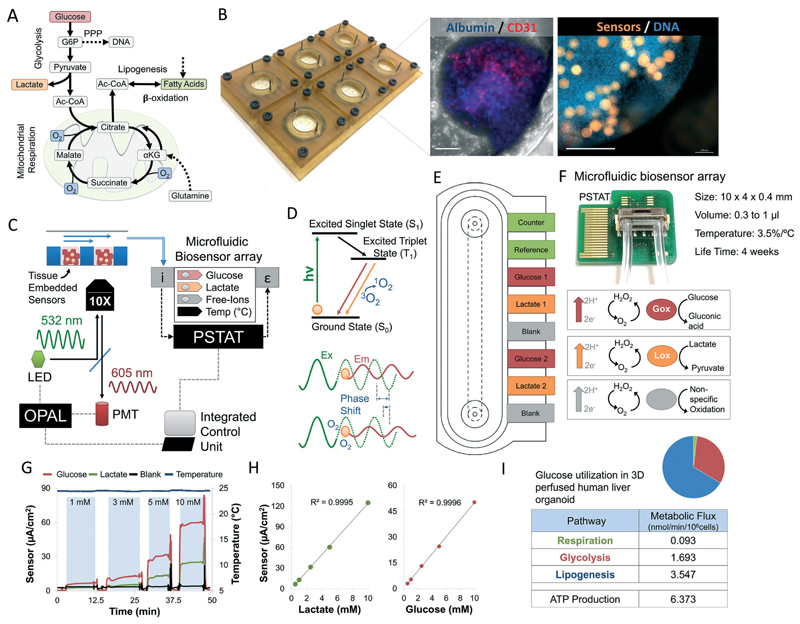
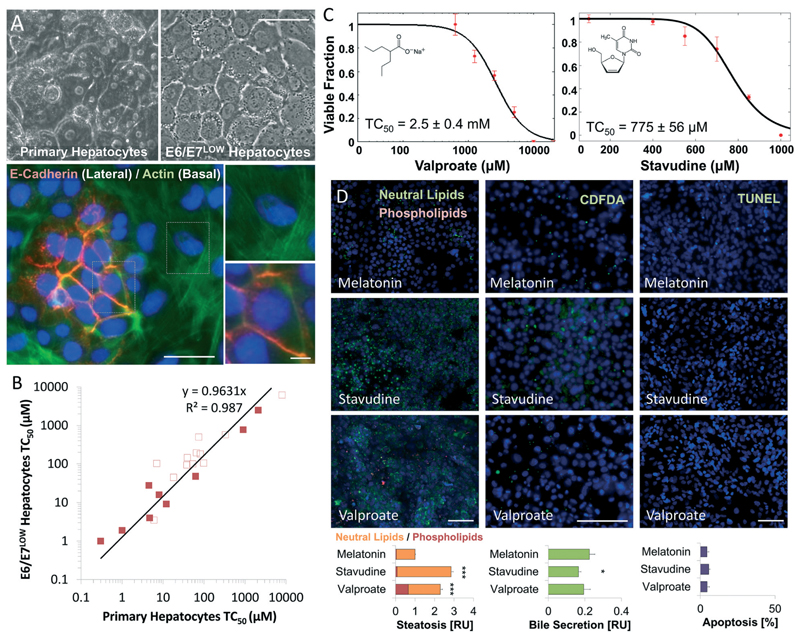
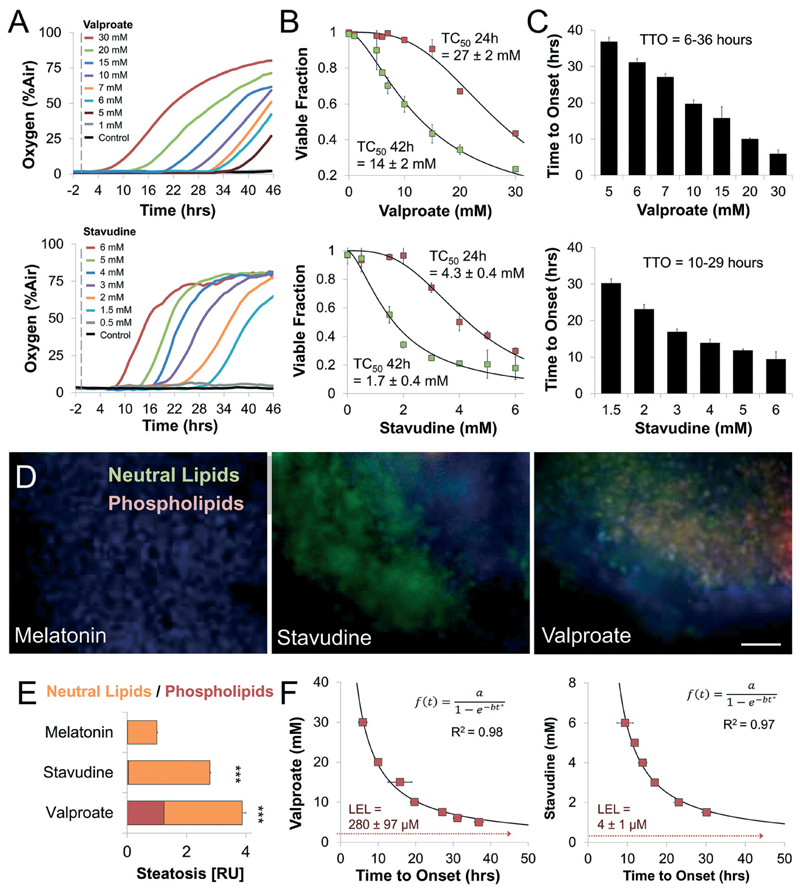
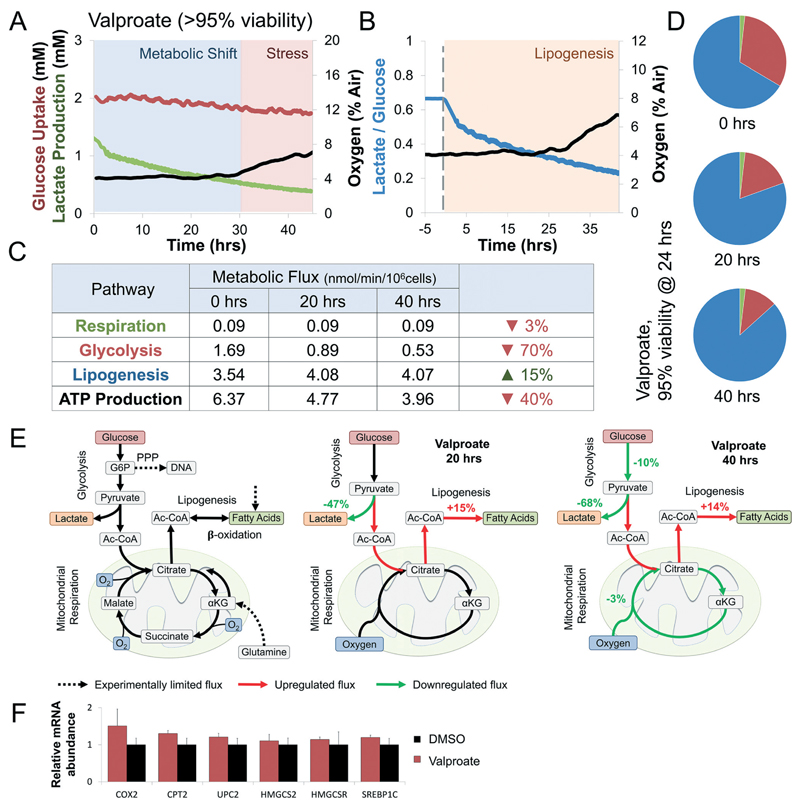
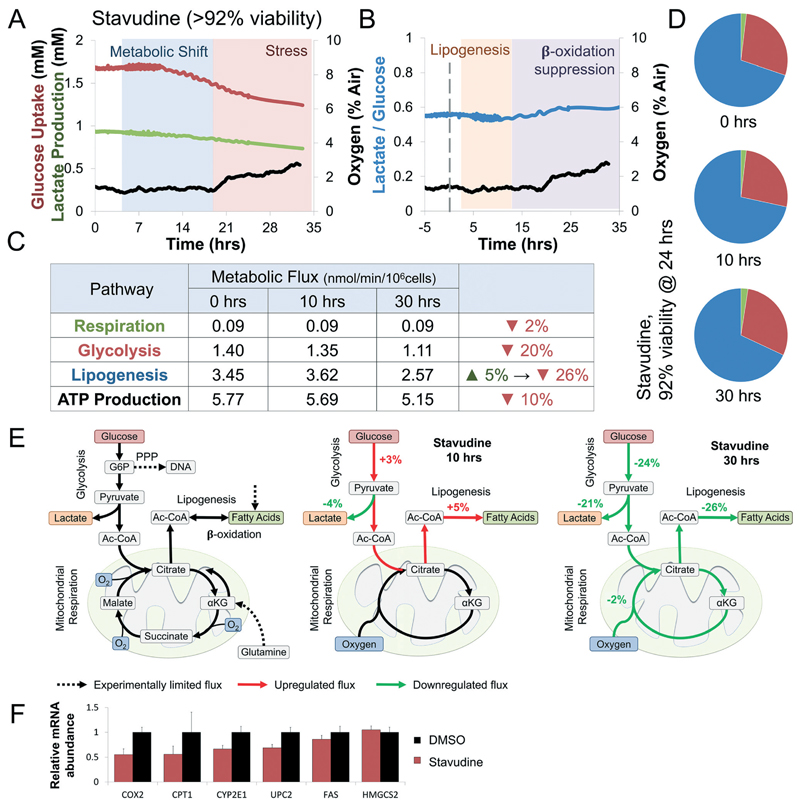
Drug development is currently hampered by the inability of animal experiments to accurately predict human response. While emerging organ on chip technology offers to reduce risk using microfluidic models of human tissues, the technology still mostly relies on end-point assays and biomarker measurements to assess tissue damage resulting in limited mechanistic information and difficulties to detect adverse effects occurring below the threshold of cellular damage. Here we present a sensor-integrated liver on chip array in which oxygen is monitored using two-frequency phase modulation of tissue-embedded microprobes, while glucose, lactate and temperature are measured in real time using microfluidic electrochemical sensors. Our microphysiological platform permits the calculation of dynamic changes in metabolic fluxes around central carbon metabolism, producing a unique metabolic fingerprint of the liver's response to stimuli. Using our platform, we studied the dynamics of human liver response to the epilepsy drug Valproate (Depakine™) and the antiretroviral medication Stavudine (Zerit™). Using E6/E7LOW hepatocytes, we show TC50 of 2.5 and 0.8 mM, respectively, coupled with a significant induction of steatosis in 2D and 3D cultures. Time to onset analysis showed slow progressive damage starting only 15-20 hours post-exposure. However, flux analysis showed a rapid disruption of metabolic homeostasis occurring below the threshold of cellular damage. While Valproate exposure led to a sustained 15% increase in lipogenesis followed by mitochondrial stress, Stavudine exposure showed only a transient increase in lipogenesis suggesting disruption of β-oxidation. Our data demonstrates the importance of tracking metabolic stress as a predictor of clinical outcome.


Conflict of interest statement

Conflicts of interest

Y. N. holds equity in Tissue Dynamics Ltd. and chairs its scientific advisory board.

Figures

Fig. 1
Fig. 1. Design of a microphysiological flux balance platform.
(A) Metabolic pathways of glucose utilization in human hepatocytes. Flux balance analysis permits the calculation of intracellular fluxes using extracellular oxygen, glucose, and lactate measurements. Dotted arrows note experimentally-limited fluxes. (B) CNC-fabricated 6-unit bioreactor plate. Laser-cut disposable microwell chips containing 9 organoids are seeded with microsensors in an open configuration and then perfused until metabolic stabilization achieved. Immunofluorescent staining shows a human liver organoid composed of albumin-positive E6/E7LOW hepatocytes (blue) and CD31-positive endothelial cells (red). Oxygen sensors (orange) are embedded inside the microtissue (blue) during seeding. Scale bar = 250 μm (C) platform schematics. Bioreactor is loaded with tissue-embedded oxygen sensors and mounted on an Olympus IX83. OPAL-controlled modulation LED signal excites the embedded oxygen sensors. Phase shift is measured through a hardware-filtered photomultiplier (PMT). Bioreactor outflow is connected to a microfluidic biosensor array containing electrochemical sensors for glucose and lactate, continuously adjusted according to non-specific oxidation events and changes in the ambient temperature. Sensors are connected to an on-chip potentiostat (PSTAT). All measurements (optical and electronic) are processed in real-time by single microprocessor, synchronizing the signal continuously. (D) Jablonski diagram describing the generation of phosphorescence with Ru-CPOx beads under the influence of oxygen. The quenching of the phosphorescence by triplet oxygen leads to a decrease in signal intensity and phosphorescence decay time T1. The effect induces a phase shift between the intensity-modulated excitation and emission light, proportional to oxygen concentration. Two-superimposed frequencies are used to screen out background interference. (E) Low volume microfluidic amperometric, 8-electrode, biosensor array. Anodic oxidation of H2O2 on platinum produces a current rapidly (t90 < 25 s), while embedded catalase activity prevents cross-contamination. A 450 mV potential between the working and counter electrodes is monitored against a reference electrode to minimize background noise caused by reversible electrolysis events. (F) Photo of microfluidic biosensor array with total internal volume of 0.3–1 μL and integrated temperature sensors and PSTAT. (G) Raw measurements of glucose, lactate, blank and temperature sensors of calibration measurements for different analyte concentrations. Measurements were carried automatically out under continuous flow of 2 μL min−1. Air gap between samples ensure a sharp change in chemical gradient on the sensor during in calibration. (H) Amperometric calibration curves of glucose and lactate concentrations in bioreactor outflow. (I) Intracellular metabolic fluxes for polarized HepG2/C3A organoid under steady state conditions. Glucose utilization in each pathway is shown as nmol min−1 per 106 cells as well as calculated ATP production (methods). Relative glucose utilization is shown as pie chart.
Fig. 2
Fig. 2. Valproate and Stavudine show drug-induced steatotic injury following 24 hours exposure in E6/E7LOW hepatocytes.
(A) Phase micrographs showing cuboidal morphology of differentiated E6/E7LOW hepatocytes compared to primary cells. Immunofluorescence staining of E-cadherin and actin shows nodales of epitelial polarization. Scale bar = 50 μm. (B) Graph showing the linear correlation in TC50 values of 21 compounds between E6/E7LOW and primary human hepatocytes. Steatosis-inducing drugs (full squares) show R2 > 0.99 correlation to primary hepatocytes compared with R2 > 0.97 for other drugs (empty squares). In general, differentiated E6/E7LOW hepatocytes show slightly elevated toxicity than cryopreserved cells. (C) Dose-dependent toxicity curves of differentiated E6/E7LOW hepatocytes treated with Valproate or Stavudine for 24 hours in standard 2D cell culture. TC50 values were 2.5 and 0.8 mM, respectively. (D) Fluorescence micrographs and total quantification of adverse outcome pathway in differentiated E6/E7LOW hepatocytes. Disruption of bile acid secretion, cholestasis, was evaluated by CDFDA staining. Lipid accumulation (steatosis) by LipidTOX assay and apoptosis by TUNEL assay (methods). Measurements were normalized to the number of nuclei. (***P < 0.001, *P < 0.05; n = 12). Data are from donor 653. All n values represent the number of experimental/biological repeats. Error bars indicate ± S.E. Scale bar = 200 μm.
Fig. 3
Fig. 3. Tissue-embedded microsensors show prolonged accumulative damage and analytical derivation of no observed effect levels in steatosis-inducing drugs.
(A) Representative oxygen uptake over time response of differentiated HepG2/C3A organoids exposed to increasing concentrations of Valproate and Stavudine. Dotted line notes exposure onset. (B) Dose-dependent toxicity curves of differentiated HepG2/C3A organoids treated with Valproate and Stavudine. TC50 for Valproate ranged from 27 mM at 24 hours to 14 mM at 42 hours. TC50 for Stavudine ranged from 4.3 mM at 24 hours to 1.7 mM at 42 hours. (C) Time to onset (TTO) of response of differentiated HepG2/C3A organoids to Valproate and Stavudine. Both drugs showed a dose-dependent decrease in TTO ranging from 6–36 hours in Valproate to 10–29 hours for Stavudine suggesting slowly accumulative steatotic damage. (D) Fluorescence micrographs and (E) quantification of steatosis and phospholipidosis in differentiated HepG2/C3A organoids as a result of exposure to different drugs. (***P < 0.001; n = 9). n represent the number of experimental repeats. Scale bar = 200 μm. (F) Analytical derivation of lowest exposure level (LEL) using the time to onset-dependent flux accumulation equation. LEL was defined as the horizontal asymptote, concentration for which onset of damage is at infinite time (methods). Valproate and Stavudine showed LEL of 280 ± 97 and 4 ± 1 μM, respectively, close to clinically reported Cmax. All error bars indicate ± standard error. TC50 and LEL error calculated by curve fitting (methods).
Fig. 4
Fig. 4. Valproate induces a rapid shift from glycolysis to lipogenesis at sub-toxic concentrations.
(A) Curves of oxygen, glucose, and lactate fluxes during continuous perfusion with 5 mM Valproate. Oxygen uptake (black) drops by 3% only after 29 hours of continuous exposure. In contrast, glucose uptake (red) and lactate production (green) drop immediately after exposure. Determination of metabolic shift and stress phases are interpretation of the experimental results against trends measured simultaneously of a control bioreactor (Fig. S3A†). Metabolic shift was determined at the onset of a significant change in glucose uptake or lactate production, while stress was determined at the onset of a significant change in oxygen uptake. (B) Changes in lactate over glucose ratio following exposure to Valproate (blue line). Ratio drops by 25% immediately upon exposure, suggesting enzymatic rather than transcriptional effect. Lipogenesis was determined at the onset of a significant shift in the metabolic fluxes towered lipid synthesis (methods) (C) intracellular metabolic fluxes calculated following 0, 20, and 40 hours exposure to sub-toxic concentration Valproate (>95% viability). Glucose utilization in each pathway is shown as nmol min−1 per 106 cells as well as calculated ATP production (methods). Lipogenesis increases by 15% while glycolysis and ATP production drop by 40% and 70%, respectively. (D) Relative glucose utilization is shown as pie chart. Lipogenesis utilizes an increasing percentage of available glucose during Valproate exposure. (E) Schematics depicting the metabolic response of liver cells to Valproate. Dotted arrows note experimentally-limited fluxes, red and green arrows note up- and down-regulated fluxes, respectively. Valproate exposure shift glucose from lactate to citrate production, increasing lipogenesis through the first 30 hours of exposure. Continued exposure suppressed glucose uptake and oxidative respiration, hallmarks of metabolic stress. (F) Gene expression analysis in E6/E7LOW hepatocytes shows metabolic changes but no significant evidence of β-oxidation suppression, supporting enzymatic driven mechanism in sub-toxic exposure.
Fig. 5
Fig. 5. Stavudine (d4T) shows a transient increase in lipogenesis followed by global suppression of glucose utilization at sub-toxic concentrations.
(A) Curves of oxygen, glucose, and lactate fluxes during continuous perfusion with 1.5 mM Stavudine. Oxygen uptake (black) drops by 2% only after 20 hours of continuous exposure. Glucose uptake (red) and lactate production (green) drop 11 hours following exposure. Determination of metabolic shift and stress phases are interpretation of the experimental results against trends measured simultaneously of a control bioreactor (Fig. S3A†). Metabolic shift was determined at the onset of a significant change in glucose uptake or lactate production, while stress was determined at the onset of a significant change in oxygen uptake. (B) Changes in lactate over glucose ratio following exposure to Stavudine (blue line). Ratio drops by 7% in the first 10 hours, suggesting a shift from lactate to citrate production. Ratio increase by 13% after 11 hours suggesting mild mitochondrial stress. Lipogenesis or β-oxidation were determined at the onset of a significant shift in the metabolic fluxes towards either phase (methods) (C) intracellular metabolic fluxes calculated following 0, 10, and 30 hours exposure to sub-toxic concentration Stavudine (>92% viability). Glucose utilization in each pathway is shown as nmol min−1 per 106 cells as well as calculated ATP production (methods). Lipogenesis increases by 5% with the first 10 hours, primarily due to increase glucose uptake and a shift from lactate to citrate production. In contrast, both glycolysis and lipogenesis were suppressed at 30 hours, while ATP production was only marginally affected. (D) Relative glucose utilization is shown as pie chart. No significant changes in the percentage of glucose utilization is seen. (E) Schematics depicting the metabolic response of liver cells to Stavudine. Dotted arrows note experimentally-limited fluxes, red and green arrows note up- and down-regulated fluxes, respectively. Stavudine exposure shift glucose from lactate to citrate production, marginally increasing lipogenesis through the first 10 hours of exposure. Continued exposure suppressed glucose uptake and oxidative respiration, and lipogenesis hallmarks of mild mitochondrial stress. (F) Gene expression analysis in E6/E7LOW hepatocytes shows β-oxidation genes CPT1, COX2, UPC2, and CYP2E1 are inhibited by Stavudine suggesting a slow transcriptional suppression of lipid oxidation.

References

    1. Olson H, Betton G, Robinson D, Thomas K, Monro A, Kolaja G, Lilly P, Sanders J, Sipes G, Bracken W, Dorato M, et al. Regul Toxicol Pharmacol. 2000;32:56–67. - PubMed
    1. O’Brien PJ, Irwin W, Diaz D, Howard-Cofield E, Krejsa CM, Slaughter MR, Gao B, Kaludercic N, Angeline A, Bernardi P, Brain P, et al. Arch Toxicol. 2006;80:580–604. - PubMed
    1. Bhatia SN, Ingber DE. Nat Biotechnol. 2014;32:760–772. - PubMed
    1. Bavli D, Prill S, Ezra E, Levy G, Cohen M, Vinken M, Vanfleteren J, Jaeger M, Nahmias Y. Proc Natl Acad Sci U S A. 2016;113:E2231–2240. - PMC - PubMed
    1. Schmalzlin E, van Dongen JT, Klimant I, Marmodee B, Steup M, Fisahn J, Geigenberger P, Lohmannsroben HG. Biophys J. 2005;89:1339–1345. - PMC - PubMed

Publication types

MeSH terms