

Reorganization of cortical oscillatory dynamics underlying disinhibition in frontotemporal dementia
- PMID: 29992242
- PMCID: PMC6061789
- DOI: 10.1093/brain/awy176
Reorganization of cortical oscillatory dynamics underlying disinhibition in frontotemporal dementia
Abstract
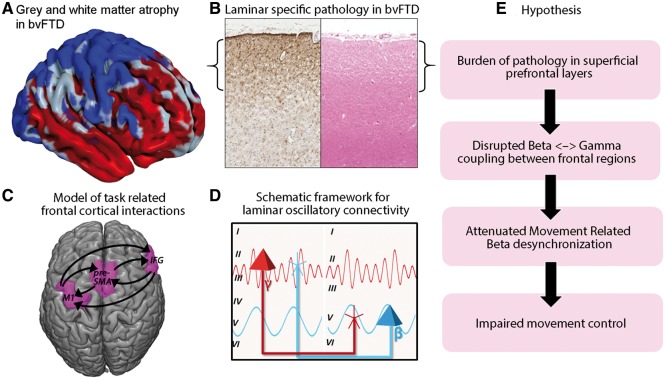
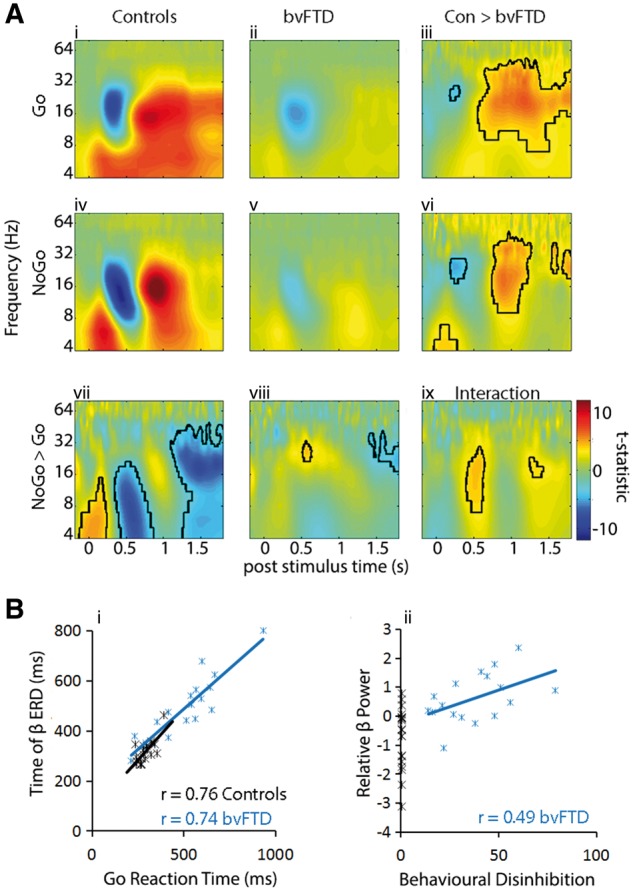
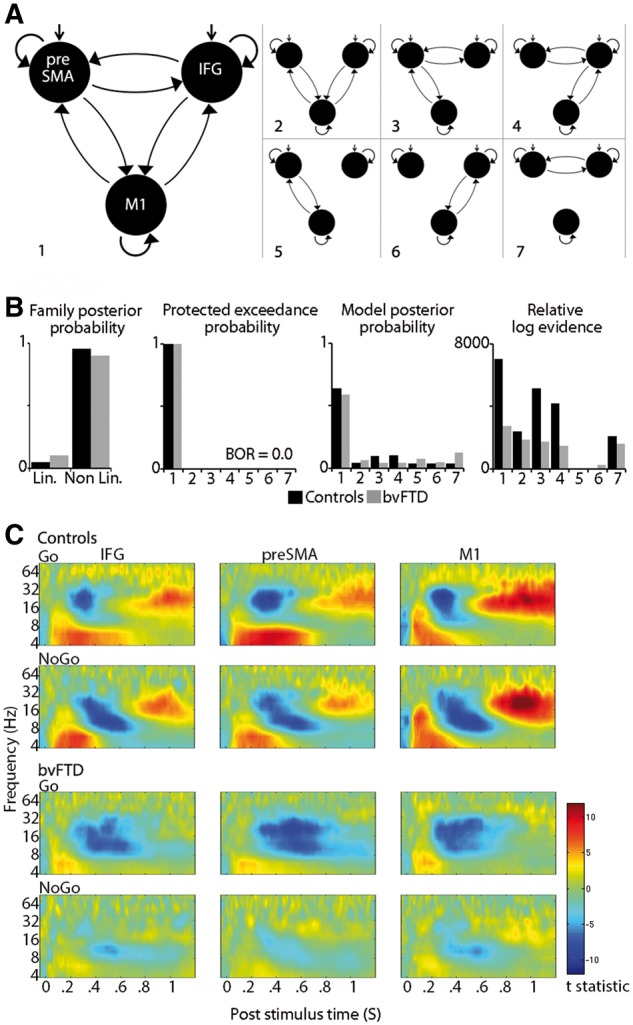
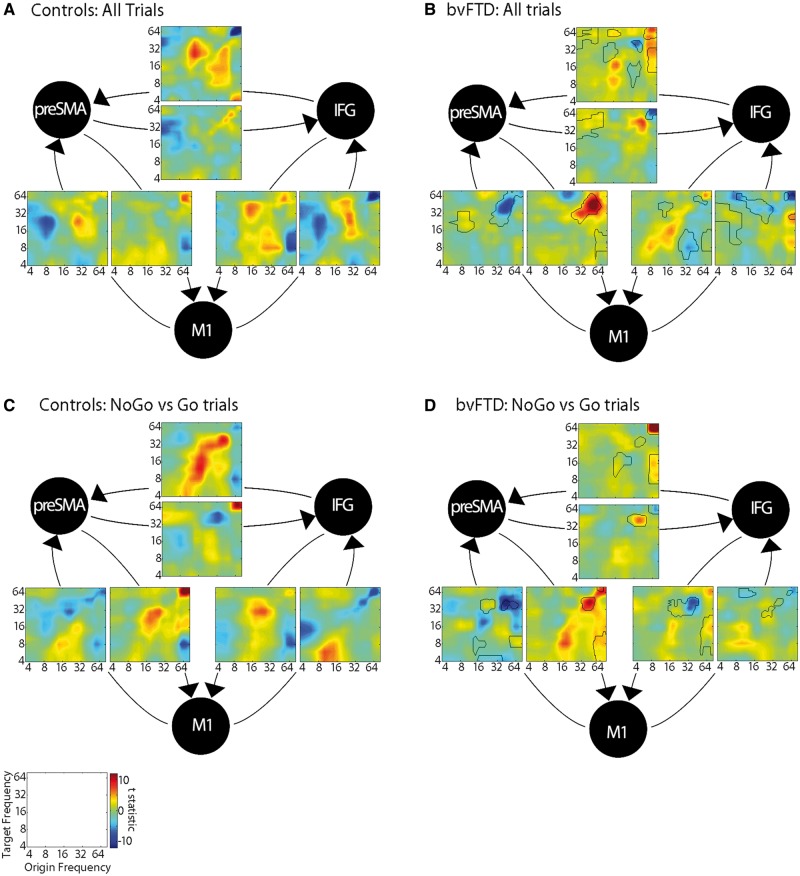
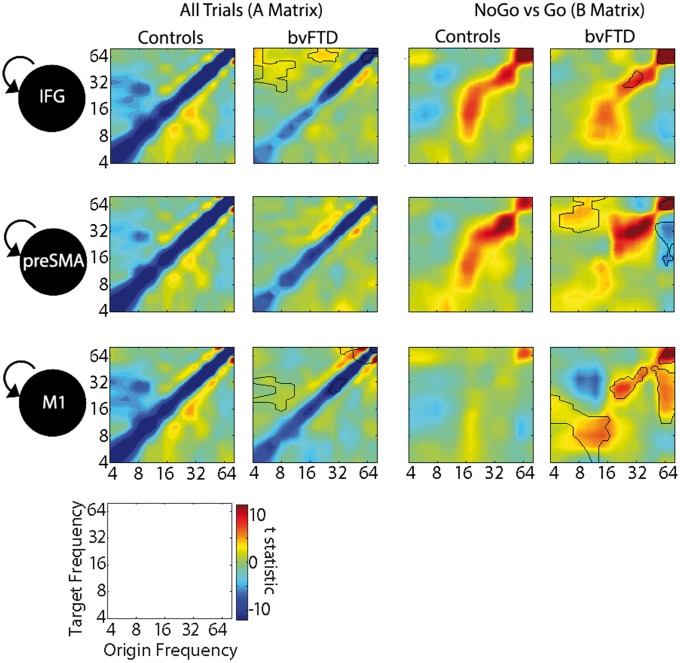
The distribution of pathology in frontotemporal dementia is anatomically selective, to distinct cortical regions and with differential neurodegeneration across the cortical layers. The cytoarchitecture and connectivity of cortical laminae preferentially supports frequency-specific oscillations and hierarchical information transfer between brain regions. We therefore predicted that in frontotemporal dementia, core functional deficits such as disinhibition would be associated with differences in the frequency spectrum and altered cross-frequency coupling between frontal cortical regions. We examined this hypothesis using a 'Go-NoGo' response inhibition paradigm with 18 patients with behavioural variant frontotemporal dementia and 20 healthy aged-matched controls during magnetoencephalography. During Go and NoGo trials, beta desynchronization was severely attenuated in patients. Beta power was associated with increased impulsivity, as measured by the Cambridge Behavioural Inventory, a carer-based questionnaire of changes in everyday behaviour. To quantify the changes in cross-frequency coupling in the frontal lobe, we used dynamic causal modelling to test a family of hierarchical casual models, which included the inferior frontal gyrus, pre-supplementary motor area (preSMA) and primary motor cortex. This analysis revealed evidence for cross-frequency coupling in a fully connected network in both groups. However, in the patient group, we identified a significant loss of reciprocal connectivity of the inferior frontal gyrus, particularly for interactions in the gamma band and for theta to alpha coupling. Importantly, although prefrontal coupling was diminished, gamma connectivity between preSMA and motor cortex was enhanced in patients. We propose that the disruption of behavioural control arises from reduced frequency-specific connectivity of the prefrontal cortex, together with a hyper-synchronous reorganization of connectivity among preSMA and motor regions. These results are supported by preclinical evidence of the selectivity of frontotemporal lobar degeneration on oscillatory dynamics, and provide a clinically relevant yet precise neurophysiological signature of behavioural control as a potential pharmacological target for early phase experimental medicines studies.
Figures
Comment in
-
Spectral signatures of neurodegenerative diseases: how to decipher them?Brain. 2018 Aug 1;141(8):2241-2244. doi: 10.1093/brain/awy195. Brain. 2018. PMID: 30060021 No abstract available.
-
Brain oscillations, inhibition and social inappropriateness in frontotemporal degeneration.Brain. 2018 Oct 1;141(10):e73. doi: 10.1093/brain/awy233. Brain. 2018. PMID: 30212838 No abstract available.
-
Reply: Brain oscillations, inhibition and social inappropriateness in frontotemporal degeneration.Brain. 2018 Oct 1;141(10):e74. doi: 10.1093/brain/awy235. Brain. 2018. PMID: 30212860 No abstract available.
References
-
- Aron AR, Robbins TW, Poldrack RA. Inhibition and the right inferior frontal cortex: one decade on. Trends Cogn Sci 2014; 18: 177–85. - PubMed
-
- Ashburner J. A fast diffeomorphic image registration algorithm. Neuroimage 2007; 38: 95–113. - PubMed
-
- Attal Y, Bhattacharjee M, Yelnik J, Cottereau B, Lefevre J, Okada Y et al. Modeling and detecting deep brain activity with MEG & EEG. Conf Proc IEEE Eng Med Biol Soc 2007; 2007: 4937–40. - PubMed
-
- Barbas H. General cortical and special prefrontal connections: principles from structure to function. Annu Rev Neurosci 2015; 38: 269–89. - PubMed
-
- Bartos M, Vida I, Jonas P. Synaptic mechanisms of synchronized gamma oscillations in inhibitory interneuron networks. Nat Rev Neurosci 2007; 8: 45–56. - PubMed
Publication types
MeSH terms
Substances
Grants and funding
LinkOut - more resources
Full Text Sources
Other Literature Sources
