. 2018 Sep 1;159(9):3132-3142.
doi: 10.1210/en.2018-00433.

α7 Nicotinic Acetylcholine Receptor Regulates the Function and Viability of L Cells

Affiliations

α7 Nicotinic Acetylcholine Receptor Regulates the Function and Viability of L Cells

Dawei Wang et al. Endocrinology. .

Abstract

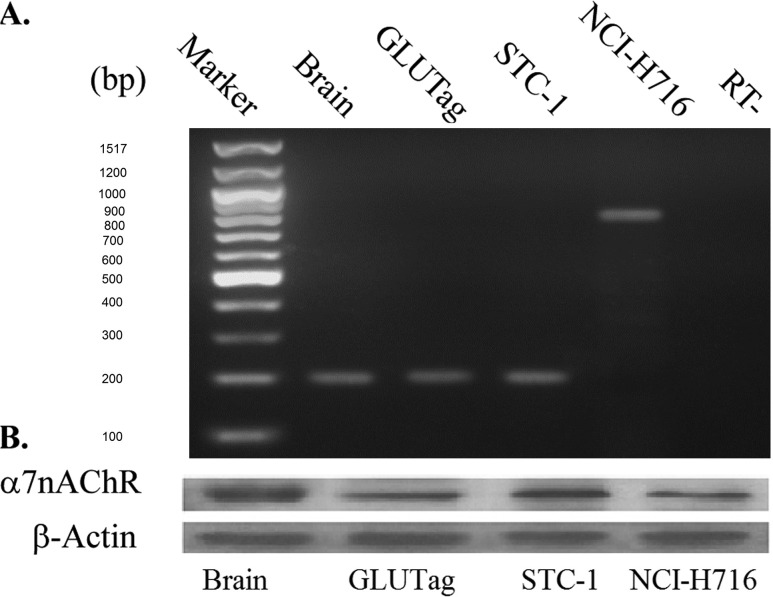
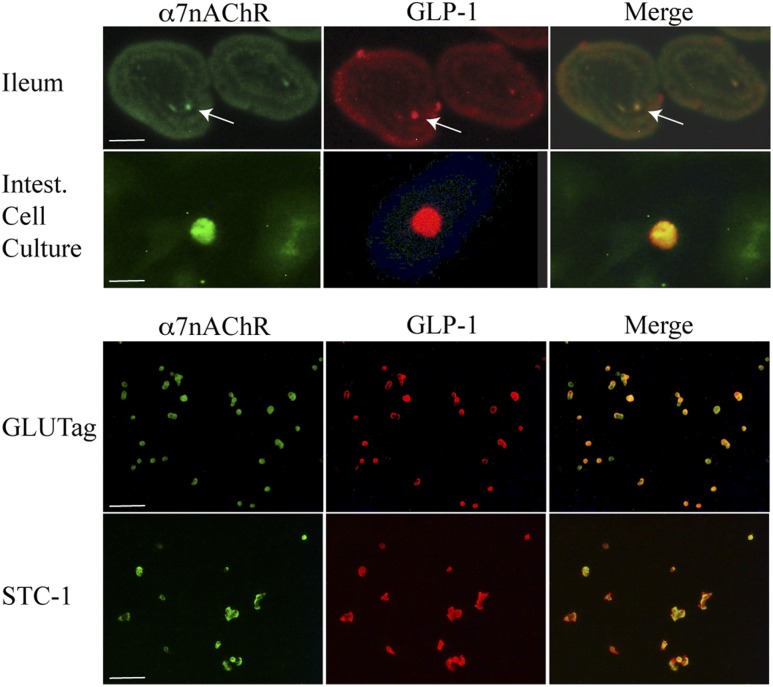
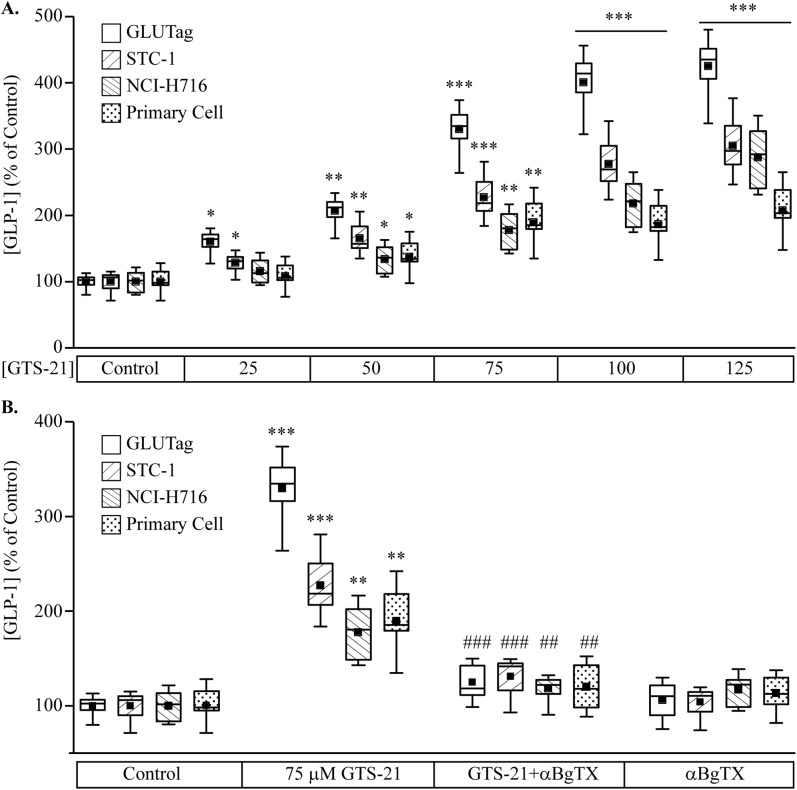
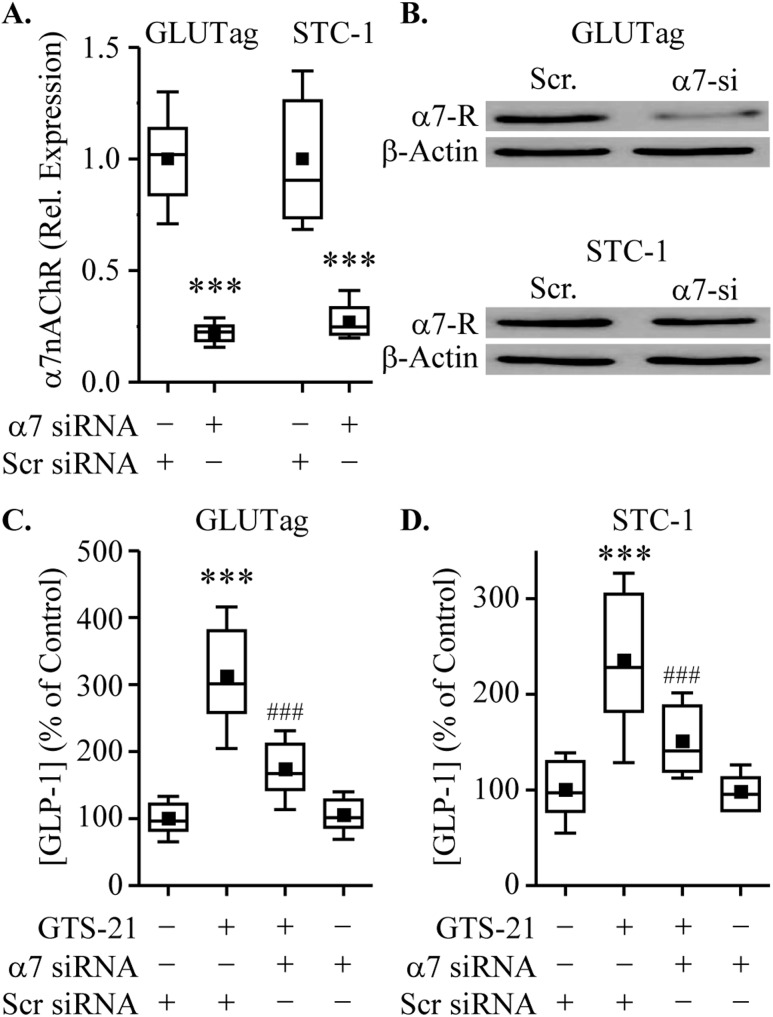
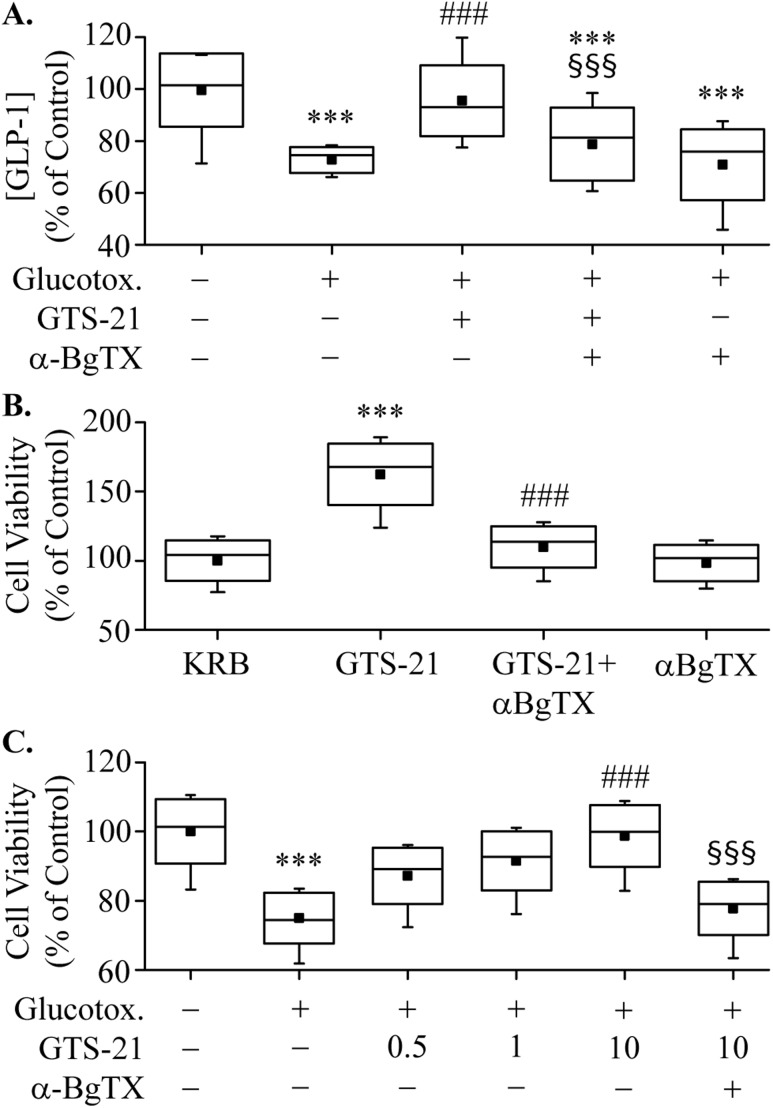
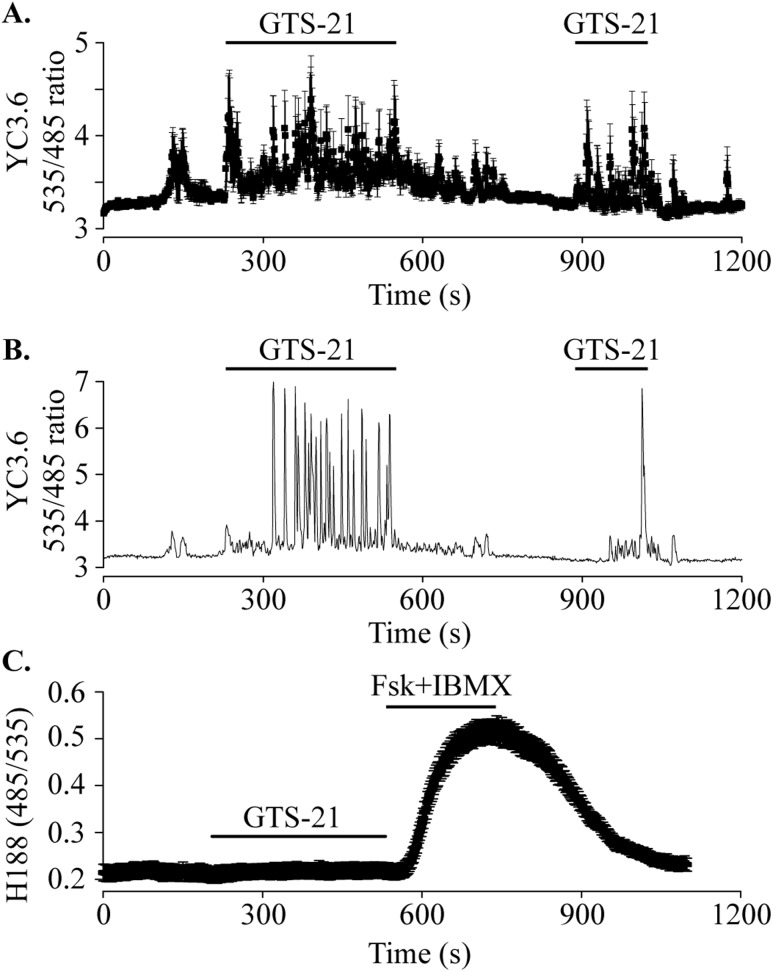
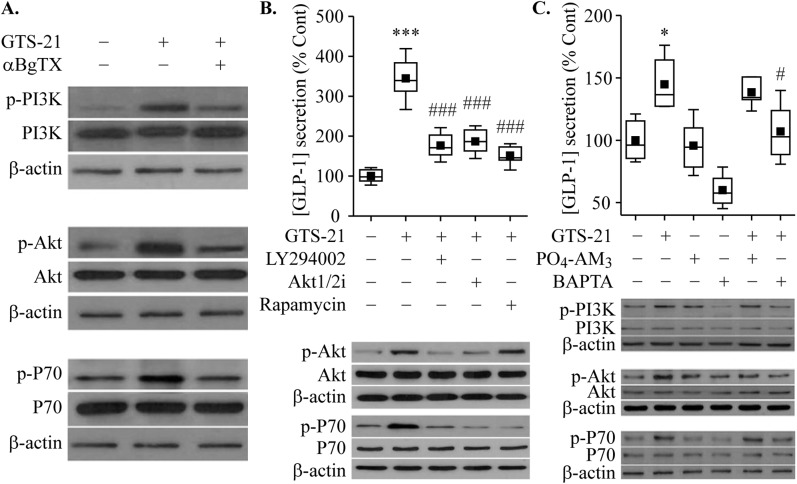
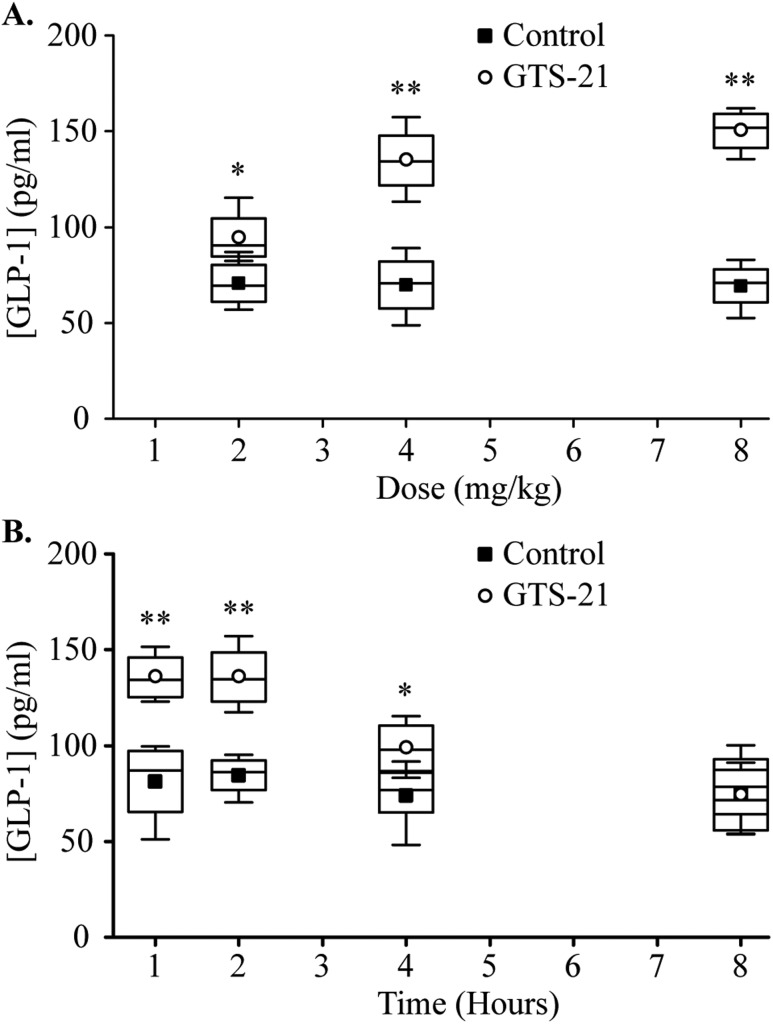
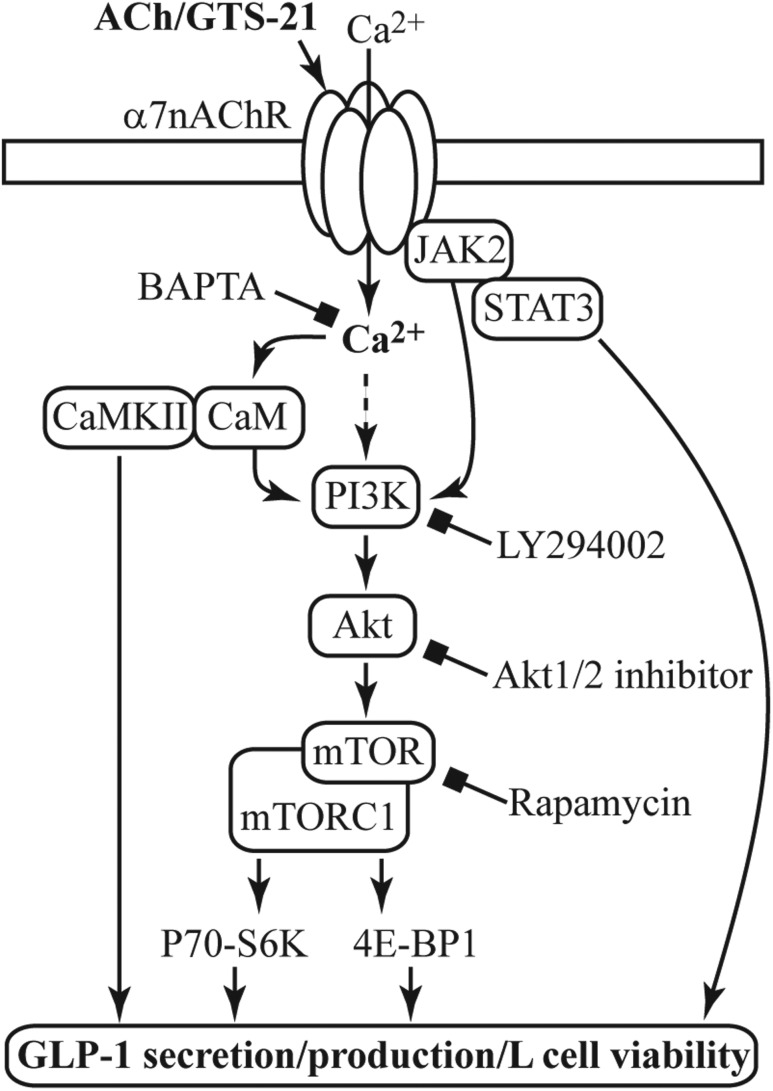
Enteroendocrine L cells secrete the incretin hormone glucagon-like peptide-1 (GLP-1), and they also express the α7 nicotinic acetylcholine receptor (α7nAChR), which may regulate GLP-1 secretion. Here, GTS-21, a selective α7nAChR agonist, was used to examine the effect of α7nAChR activation in L-cell lines, mouse intestinal primary cell cultures, and C57BL/6 mice. GTS-21 stimulated GLP-1 secretion in vitro, and this effect was attenuated by an α7nAChR antagonist or by α7nAChR-specific small interfering RNA. Under in vitro cell culture conditions of glucotoxicity, GTS-21 restored GLP-1 secretion and improved L-cell viability while also acting in vivo to raise levels of circulating GLP-1 in mice. To assess potential signaling mechanisms underlying these actions of GTS-21, we first monitored Ca2+, cAMP, and phosphatidylinositol 3-kinase (PI3K) activity. As expected for a GLP-1 secretagogue promoting Ca2+ influx through α7nAChR cation channels, [Ca2+]i increased in response to GTS-21, but [cAMP]i was unchanged. Surprisingly, pharmacological inhibition of growth factor signaling pathways revealed that GTS-21 also acts on the PI3K-protein kinase B-mammalian target of rapamycin pathway to promote L-cell viability. Moreover, the Ca2+ chelator BAPTA-AM counteracted GTS-21‒stimulated PI3K activity, thereby indicating unexpected crosstalk of L-cell Ca2+ and growth factor signaling pathways. Collectively, these data demonstrate that α7nAChR activation enhances GLP-1 secretion by increasing levels of cytosolic Ca2+ while also revealing Ca2+- and PI3K-dependent processes of α7nAChR activation that promote L-cell survival.


Figures

Figure 1.
Figure 1.
α7nAChR expression in intestinal L cells. (A) α7nAChR mRNA expression was analyzed by RT-PCR. A 199-bp band corresponding to mouse α7nAChR was specifically amplified in mouse brain tissue (positive control), GLUTag cells, and STC-1 cells. An 843-bp band corresponding to human α7nAChR was amplified in NCI-H716 cells. No contamination of genomic DNA was detected in the lane labeled “RT−,” which corresponds to PCR reactions run in the absence of reverse transcription. (B) α7nAChR protein expression was detected in mouse brain (positive control), GLUTag, STC-1, and NCI-H716 cells, as evaluated by Western blot analysis (20 μg of protein loaded per lane) using anti-α7nAChR antisera. RT−, reverse transcription‒negative.
Figure 2.
Figure 2.
Immunofluorescent staining of α7nAChR and GLP-1. Top two panels show α7nAChR (green) and GLP-1 (red) immunoreactivity in sections of mouse ileum and in primary intestinal (Intest.) cell cultures that contain L-cells (arrows). Merged overlays demonstrate codetection of both immunoreactivities in single L cells (yellow). Bottom two panels show the same as for top panels except that findings are for GLUTag and STC-1 cells. Calibration bars, 100 μm for ileum, GLUTag, and STC-1 or 10 μm for primary intestinal cell cultures.
Figure 3.
Figure 3.
Effects of GTS-21 and α-bungarotoxin (α-BgTX) on GLP-1 secretion. (A) GLUTag, STC-1, NCI-H716, and mouse primary intestinal cell cultures were treated with PBS (control) or increasing concentrations of GTS-21 for 2 h. Secreted GLP-1 was measured using ELISA assays and is expressed as the percentage change relative to control for each cell type. *P < 0.05, **P < 0.01, ***P < 0.001 vs. control group (n = 8 to 10). (B) GLUTag, STC-1, NCI-H716, and mouse primary intestinal cell cultures were preincubated with 100 nM of α-BgTX for 30 min before 2-h stimulation with GTS-21. **P < 0.01, ***P < 0.001 vs. control group; ##P < 0.01, ###P < 0.001 vs. GTS-21 group (n = 8 to 10). Box and whisker plots show the mean (solid box), 25% to 75% range (open box), median (horizontal line within open box), and minimum and maximum values (whiskers).
Figure 4.
Figure 4.
α7nAChR siRNA regulates α7nAChR expression and GLP-1 secretion. (A and B) Cells were transfected with (+) or without (−) α7nAChR (α7-si) or nontargeting [scrambled (Scr)] siRNA for 48 h. Levels of α7nAChR (A) mRNA and (B) protein (α7-R) were measured by RT-PCR and Western blot analysis. Cells transfected with α7nAChR or Scr siRNA (48 h) were treated with GTS-21 (75μM) for 2 h, and GLP-1 secretion was determined. (C and D) Knockdown of α7nAChR reduced GLP-1 secretion induced by GTS-21 in (C) GLUTag and (D) STC-1 cells. ***P < 0.001 vs. scrambled siRNA group; ###P < 0.001 vs. scrambled siRNA plus GTS-21 group (n = 7 to 8).
Figure 5.
Figure 5.
Effects of glucotoxicity (Glucotox.). (A) GLUTag cells were incubated for 72 h in either 5.6 mM (control) or 25.6 mM of glucose, washed and pretreated ± α-BgTX for 30 min, then stimulated with PBS or GTS-21 (75 μM) for 2 h. The amount of GLP-1 released into the medium was measured by ELISA. ***P < 0.001 vs. control group; ###P < 0.001 vs. PBS group; §§§P < 0.001 vs. GTS-21 group (n = 7). (B) GLUTag cells were preincubated with 100 nM of α-BgTX for 30 min and then were treated with PBS or GTS-21 (1 μM) for 24 h. Cell viability was determined by the MTT assay. ***P < 0.001 vs. PBS group; ###P < 0.001 vs. GTS-21 group (n = 8). (C) GLUTag cells were treated with 5.6 mM (control) or 30.6 mM (Glucotox.) of glucose for 72 h. GLUTag cells were then stimulated with GTS-21 (1 μM) for 24 h with (+) or without (−) preincubation using α-BgTX (100 nM). Cell viability was then measured by MTT assay. ***P < 0.001 vs. control group; ###P < 0.001 vs. PBS group; §§§P < 0.001 vs. 10-μM GTS-21 alone group (n = 7).
Figure 6.
Figure 6.
Assays for cytosolic Ca2+ and cAMP. (A) GLUTag cells transduced with the Ca2+ reporter YC3.6 were perifused with 5.6 mM of glucose standard extracellular solution at 37°C. GTS-21 (100 μM) was applied (indicated by bars) and induced an oscillatory rise of [Ca2+]i. Data are plotted as mean ± SEM for 9 cells from a single experiment and are representative of 64 cells from three independent transductions. (B) Single cell [Ca2+]i response to GTS-21 (100 μM) taken from the record shown in (A). The single-cell record highlights the oscillatory [Ca2+]i response. (C) GLUTag cells transduced with the cAMP reporter H188 were perifused with GTS-21 (100 μM) followed by forskolin (Fsk; 5 μM) + 3-isobutyl-1-methylxanthine (IBMX; 100 μM). GTS-21 had no effect on [cAMP]i, whereas the positive control (Fsk + IBMX) reversibly elevated [cAMP]. Data are plotted as mean ± SEM for 24 cells from three experiments and are representative of 62 cells from three independent viral transductions.
Figure 7.
Figure 7.
Regulation of GLP-1 secretion by the PI3K/AKT/mTOR signaling pathway. (A‒C) Stimulation of α7nAChR by GTS-21 enhanced GLP-1 secretion through PI3K/AKT/mTOR activation in GLUTag cells. (A) PI3K/AKT/mTOR activation. Cells were pretreated with α-BgTX (100 nM) for 30 min, then treated with GTS-21 (75 μM) for 2 h. The cell lysate was subjected to Western blotting. (B) Effects of GTS-21 on GLP-1 secretion were abrogated by the inhibitor of the PI3K/AKT/mTOR signaling pathway. Cells were pretreated with LY294002 (10 μM), Akt1/2 kinase inhibitor (5 μM), and rapamycin (2 nM) for 30 min, then treated with GTS-21 (75 μM) for 2 h. The amount of GLP-1 released into the medium was measured, and the cell lysate was subjected to Western blot analysis. (C) Effect of BAPTA-AM on GLP-1 secretion. Cells were pretreated with BAPTA-AM (10 µM) or PO4-AM3 (3.3 µM) for 30 min, then treated with GTS-21 (75 μM) for 2 h. Cell lysates were subjected to Western blotting. *P < 0.05, ***P < 0.001 vs. control group; #P < 0.05, ###P < 0.001 vs. GTS-21 group (n = 5 to 8).
Figure 8.
Figure 8.
Effects of GTS-21 on circulating GLP-1. (A) Mice were injected intraperitoneally with 2 to 8 mg/kg of GTS-21 or normal saline (vehicle). Blood samples were collected 1 h later, and GLP-1 levels were measured by ELISA. *P < 0.05, **P < 0.01 vs. control group (n = 4 to 5). (B) Mice were injected with 4 mg/kg of GTS-21, and circulating GLP-1 was measured at 1, 2, 4, and 8 h later by ELISA. *P < 0.05, **P < 0.01 vs. control group (n = 4 or 5).
Figure 9.
Figure 9.
A model for α7nAChR coupling to L-cell function, growth, and survival. Acetylcholine (ACh) or GTS-21 activates α7nAChR and promotes Ca2+ influx. Activation of the PI3K/Akt/mTOR pathway downstream of α7nAChR is involved in regulating GLP-1 secretion and cell viability, as revealed by the use of LY294002 (PI3K inhibitor), Akt1/2 kinase inhibitor, or rapamycin (mTOR inhibitor). Coupling of α7nAChR to PI3K activation can occur through several pathways including Ca2+-calmodulin (CaM) (41) and Janus kinase 2 (JAK2) (42). Ca2+ can also promote GLP-1 secretion directly or through Ca2+/calmodulin‒dependent kinase II (CaMKII) (43). The Ca2+ chelator BAPTA-AM inhibits all depicted effects of GST-21. Numerous downstream effectors of the metabolically regulated mTOR complex 1 (mTORC1) (44) are involved in cell viability, and determining which pathways are important to L-cell biology requires further investigation.

Similar articles

Cited by

References

    1. Habib AM, Richards P, Rogers GJ, Reimann F, Gribble FM. Co-localisation and secretion of glucagon-like peptide 1 and peptide YY from primary cultured human L cells. Diabetologia. 2013;56(6):1413–1416. - PMC - PubMed
    1. Vilsbøll T, Holst JJ. Incretins, insulin secretion and type 2 diabetes mellitus. Diabetologia. 2004;47(3):357–366. - PubMed
    1. Abbott CR, Monteiro M, Small CJ, Sajedi A, Smith KL, Parkinson JR, Ghatei MA, Bloom SR. The inhibitory effects of peripheral administration of peptide YY(3-36) and glucagon-like peptide-1 on food intake are attenuated by ablation of the vagal-brainstem-hypothalamic pathway. Brain Res. 2005;1044(1):127–131. - PubMed
    1. Krieger JP, Arnold M, Pettersen KG, Lossel P, Langhans W, Lee SJ. Knockdown of GLP-1 receptors in vagal afferents affects normal food intake and glycemia. Diabetes. 2016;65(1):34–43. - PubMed
    1. Courtney H, Nayar R, Rajeswaran C, Jandhyala R. Long-term management of type 2 diabetes with glucagon-like peptide-1 receptor agonists. Diabetes Metab Syndr Obes. 2017;10:79–87. - PMC - PubMed

Publication types

MeSH terms