. 2018 Jul 11;9(1):2681.
doi: 10.1038/s41467-018-04918-x.

Discovery of a drug candidate for GLIS3-associated diabetes

Affiliations

Discovery of a drug candidate for GLIS3-associated diabetes

Sadaf Amin et al. Nat Commun. .

Abstract

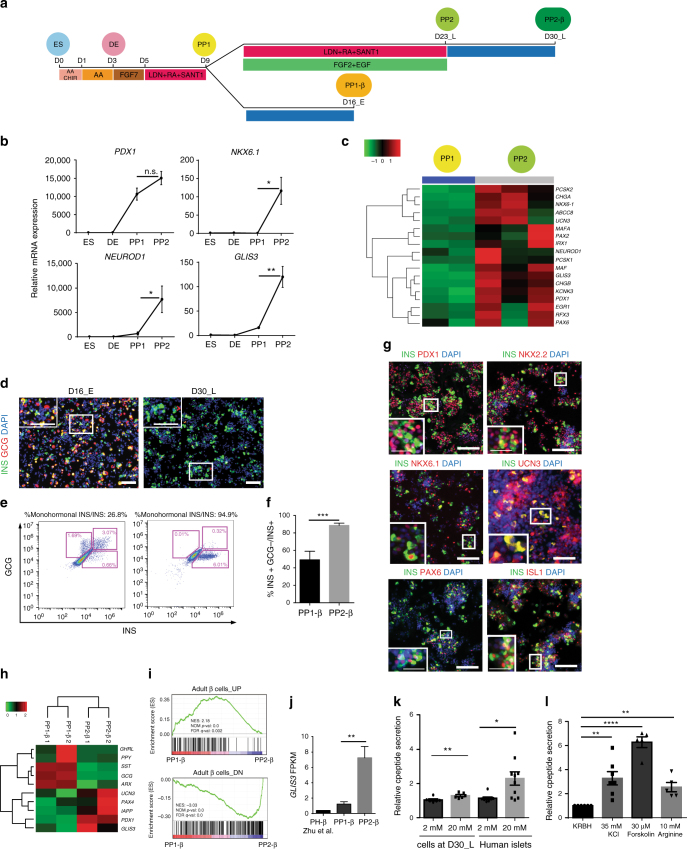
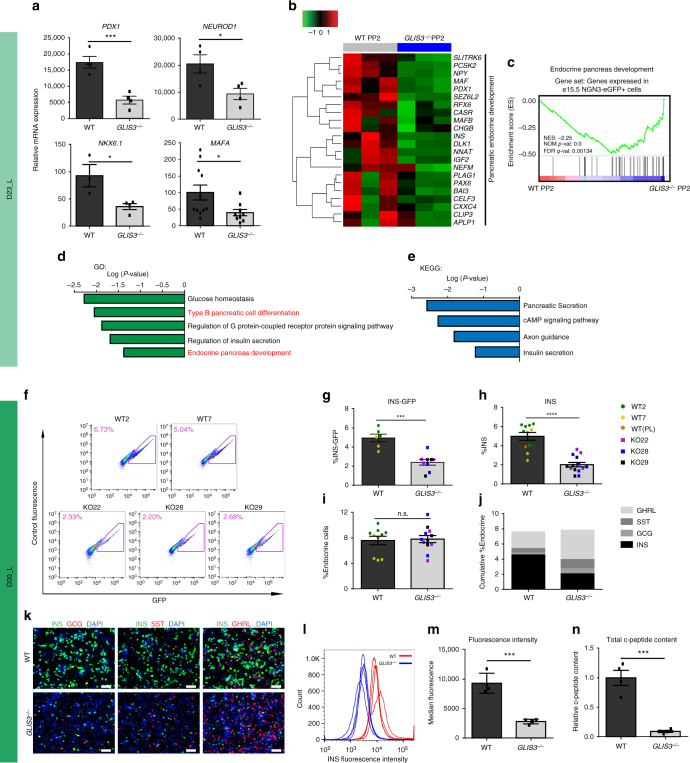
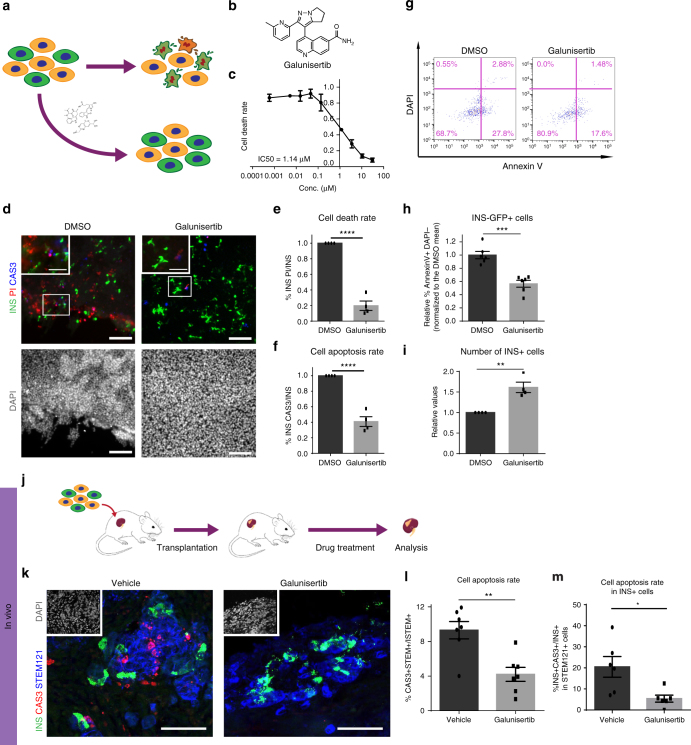
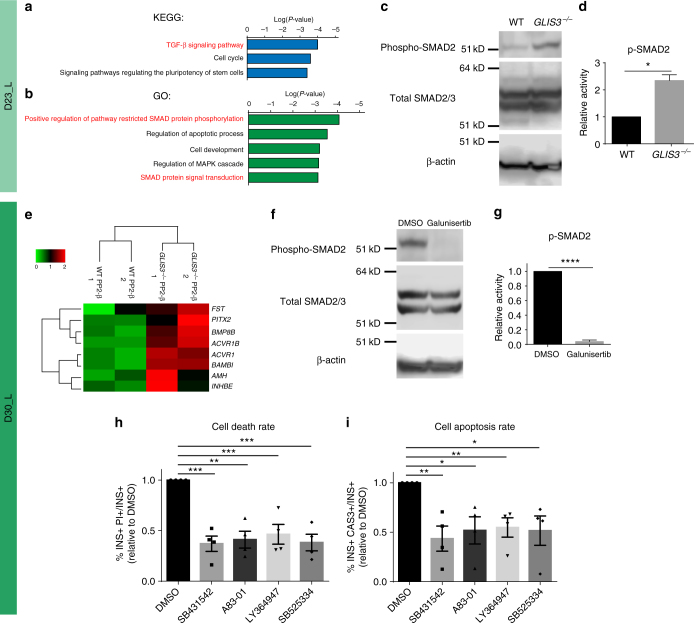
GLIS3 mutations are associated with type 1, type 2, and neonatal diabetes, reflecting a key function for this gene in pancreatic β-cell biology. Previous attempts to recapitulate disease-relevant phenotypes in GLIS3-/- β-like cells have been unsuccessful. Here, we develop a "minimal component" protocol to generate late-stage pancreatic progenitors (PP2) that differentiate to mono-hormonal glucose-responding β-like (PP2-β) cells. Using this differentiation platform, we discover that GLIS3-/- hESCs show impaired differentiation, with significant death of PP2 and PP2-β cells, without impacting the total endocrine pool. Furthermore, we perform a high-content chemical screen and identify a drug candidate that rescues mutant GLIS3-associated β-cell death both in vitro and in vivo. Finally, we discovered that loss of GLIS3 causes β-cell death, by activating the TGFβ pathway. This study establishes an optimized directed differentiation protocol for modeling human β-cell disease and identifies a drug candidate for treating a broad range of GLIS3-associated diabetic patients.


Conflict of interest statement

The authors have filed a patent of the differentiation strategy. The authors declare no other competing interests.

Figures

Fig. 1
Fig. 1
Generation of mono-hormonal pancreatic β-like cells through the induction of late-stage pancreatic progenitors (PP2). a Schematic representation of the stepwise differentiation protocol. b qRT-PCR analysis of pancreatic progenitor markers in hESCs, definitive endoderm (DE), PP1 and PP2 cells (ES, DE n = 3, PP1 n = 6, PP2 n = 8). c Heatmap representing relative expression profiles of genes related to β-cell development in PP1 and PP2 cells (PP1 n = 2, PP2 n = 3). d Immunocytochemistry analysis of insulin (INS) and glucagon (GCG) expression at D16_E and D30_L, insets show a higher magnification image. Scale bar = 100 µm. Intracellular flow cytometry analysis (e) and quantification (f) of INS and GCG expression at D16_E and D30_L (D16_E n = 4, D30_L n = 8). g Immunocytochemistry analysis of cells at D30_L. Scale bar = 100 µm, scale bar of high magnification insets = 40 µm. h Heatmap representing the relative expression level of endocrine markers in PP1-β and PP2-β cells. i GSEA analysis shows that PP2-β cells are transcriptionally closer to human adult β-cells than PP1-β cells. The adult β cells_UP and adult β cells_DN gene sets consist of the top 1000 differentially expressed genes (higher expression for UP and lower expression for DN) in primary human β-cells compared to PP1-β cells. j FPKM values of GLIS3 in PH-β cells derived using Zhu et al.’s protocol and the purified INS-GFP+ PP1-β (n = 4) and PP2-β cells (n = 2). k Glucose-stimulated c-peptide secretion of cells at D30_L and human islets. The amount of c-peptide secretion in 20 mM (high) D-glucose condition was normalized to the amount of c-peptide secreted in 2 mM (low) D-glucose condition (n = 6 for cells at D30_L and n = 10 for islets). l Insulin secretion of cells at D30_L in response to other secretagogues, including 30 mM KCl (n = 7), 30 µM Forskolin (n = 5), or 10 mM Arginine (n = 5) relative to basal Krebs–Ringer bicarbonate HEPES (KRBH) buffer treatment (n = 7). The fold change was normalized to the amount of c-peptide secreted in KRBH condition. P values by unpaired two-tailed t-test were *P < 0.05, **P < 0.01, ***P < 0.001, ****P < 0.0001. Data are presented as individual biological replicates. The center value is “mean”. Error bar is SEM
Fig. 2
Fig. 2
Biallelic mutation of GLIS3 affects pancreatic differentiation and the generation of endocrine cells. a qRT-PCR analysis of pancreatic markers in the isogenic WT and GLIS3−/− PP2 cells. (PDX1, NEUROD1, NKX6.1 n = 4, MAFA n = 12). b Heatmap representing the relative expression levels of endocrine genes in WT and GLIS3−/− PP2 cells (n = 3). c GSEA analysis showing the decrease of endocrine pancreas-related genes in GLIS3−/− PP2 cells. Gene ontology (GO) analysis (d) and KEGG pathway analysis (e) of genes significantly downregulated (P < 0.01) in GLIS3−/− PP2 cells. f Flow cytometry analysis of WT and GLIS3−/− cells at D30_L. g Quantification of the percentage of INS-GFP+ cells of WT (n = 6) and GLIS3−/− (n = 9) cells at D30_L. The percentage of INS-GFP+ cells was quantified based on flow cytometry analysis of GFP+ cells. h Quantification of the percentage of INS+ cells of WT (n = 11) and GLIS3−/− (n = 14) cells at D30_L. The percentage was quantified based on intracellular flow cytometry analysis of INS+ cells. i Total percentage of endocrine cells in isogenic WT (n = 10) and GLIS3−/− (n = 12) cells at D30_L. The percentage of endocrine cells is calculated as the sum of the percentages of INS+, GCG+, SST+, and GHRL+ cells. j Plot representing the ratios of different endocrine subtypes in WT and GLIS3−/− cells at D30_L. k Immunocytochemistry analysis of pancreatic endocrine marker expression in WT and GLIS3−/− cells at D30_L. Scale bar = 100 μm. l, m Histogram showing fluorescence intensity (l) and quantification of median fluorescence values (m) of INS staining of WT and GLIS3−/− PP2-β cells (n = 4). n Insulin content of the purified INS-GFP+ WT and GLIS3−/− PP2-β cells (n = 4). Data are normalized to the WT mean value. P values by unpaired two-tailed t-test were *P < 0.05, **P < 0.01, ***P < 0.001, ****P < 0.0001. The center value is “mean”. Error bar is SEM
Fig. 3
Fig. 3
Loss of GLIS3 leads to increased cell death in PP2 and PP2-β cells. a Quantification of early apoptotic cells (the percentage of Annexin V+/DAPI cells) in WT and GLIS3−/− ES, DE, PP1, and PP2 cells (n = 3). b Representative flow cytometry analysis plots of Annexin V staining in WT and GLIS3−/− cells at D23_L. c Immunostaining for PDX1 and cleaved caspase-3 in WT and GLIS3−/− cells at D23_L. Scale bar = 40 μm. Annexin V staining (d) and quantification (e) of early apoptotic cells in the INS-GFP+ cells at D30_L (n = 6). Histogram showing fluorescence intensity (f) and quantification of median fluorescence values (g) of Annexin V staining of WT and GLIS3−/− INS+ DAPIPP2-β cells (WT n = 4, GLIS3−/− n = 6). h PI, cleaved caspase-3 and INS staining of WT and GLIS3−/− cells at D30_L. Scale bar = 40 μm. i Quantification of cell death rate (the percentage of PI+INS+ cells in INS+ cells) and apoptosis rate (the percentage of cleaved caspase-3+INS+ cells in INS+ cells) of WT and GLIS3−/− INS+ PP2-β cells (n = 3). j Schematic representation of the in vivo transplantation experiment. k Immunostaining for INS, cleaved caspase-3 and STEM121 in the grafts of mice transplanted with WT or GLIS3−/− cells. Scale bar = 100 μm. l Quantification of the apoptosis rate (the percentage of cleaved caspase-3+/ STEM121+ cells in STEM121+ cells) within WT and GLIS3−/− grafts (n = 7 for WT, n = 4 for GLIS3−/−). m Quantification of the percentage of apoptotic INS+ cells (CAS3+PDX1+STEM121+) in the INS+ population within the WT and GLIS3−/− grafts (INS+STEM121+, WT n = 7, GLIS3−/− n = 4). CAS3: cleaved caspase-3. P values by unpaired two-tailed Student’s t-test were *P < 0.05, **P < 0.01, ***P < 0.001, ****P < 0.0001. The center value is “mean”. Error bar is SEM
Fig. 4
Fig. 4
A high-content chemical screen identifies galunisertib as a drug candidate to rescue cell death induced by loss of GLIS3 both in vitro and in vivo. a Schematic representation of the high-content chemical screen. b Chemical structure of galunisertib. c Inhibitory curve of galunisertib. d Immunocyto-chemistry analysis of GLIS3−/− PP2-β cells treated with DMSO or 10 µM galunisertib. Scale bar = 100 μm, scale bar of high magnification insets = 40 μm. e, f Quantification of the cell death rate (e, the percentage of PI+INS+ cells in INS+ cells, n = 4) and apoptosis rate (f, the percentage of cleaved caspase-3+INS+ cells in INS+ cells, n = 3) of GLIS3−/− PP2-β cells treated with DMSO or 10 µM galunisertib. Flow cytometry analysis (g) and quantification (h) of early apoptotic cells (the percentage of Annexin V+/DAPI cells) in GLIS3−/− INS-GFP+ PP2-β cells treated with DMSO or 10 μM galunisertib (n = 6). i Relative number of INS+ cells in GLIS3−/− PP2-β cells treated with DMSO or 10 μM galunisertib. Data are normalized to DMSO-treated values (n = 4). j Schematic representation of the in vivo transplantation and drug treatment experiments. k Immunohistochemistry analysis of INS, cleaved caspase-3, and STEM121 in the grafts isolated from vehicle- or galunisertib-treated mice. Scale bar = 100 μm. l Quantification of immunohistochemistry data in j (n = 7). m Quantification of the percentage of apoptotic INS+ cells (CAS3+INS+ STEM121+) in the INS+ population within the grafts from vehicle- or galunisertib-treated mice (INS+STEM121+, n = 6). CAS3: cleaved caspase-3. P values by unpaired two-tailed t-test were *P < 0.05, **P < 0.01, ***P < 0.001, ****P < 0.0001. The center value is “mean”. Error bar is SEM
Fig. 5
Fig. 5
Galunisertib rescues loss of GLIS3 induced cell death by inhibiting TGFβ signaling. KEGG pathway analysis (a) and gene ontology (GO) analysis (b) of genes that are significantly (P < 0.01) upregulated in GLIS3−/− PP2 cells. Western blot analysis (c) and quantification (d, n = 3) of SMAD2/3 phosphorylation in WT and GLIS3−/− cells at D23_L. e Heatmap representing the relative expression levels of TGF-β-related genes upregulated at least two-fold in the purified WT and GLIS3−/− INS-GFP+ PP2-β cells. Western blotting analysis (f) and quantification (g, n = 3) of SMAD2/3 phosphorylation in GLIS3−/− cells at D30_L treated with DMSO or 10 μM galunisertib. h, i Quantification of the cell death rate (h, the percentage of PI+INS+ cells in INS+ cells) and apoptosis rate (i, the percentage of cleaved caspase-3+INS+ cells in INS+ cells) of GLIS3−/− PP2-β cells treated with different TGFβ inhibitors (n = 4). CAS3: cleaved caspase-3. P values by unpaired two-tailed t-test were *P < 0.05, **P < 0.01, ***P < 0.001, ****P < 0.0001. The center value is “mean”. Error bar is SEM

References

    1. Barrett JC, et al. Genome-wide association study and meta-analysis find that over 40 loci affect risk of type 1 diabetes. Nat. Genet. 2009;41:703–707. doi: 10.1038/ng.381. - DOI - PMC - PubMed
    1. Steck AK, et al. Improving prediction of type 1 diabetes by testing non-HLA genetic variants in addition to HLA markers. Pediatr. Diabetes. 2014;15:355–362. doi: 10.1111/pedi.12092. - DOI - PMC - PubMed
    1. Winkler C, et al. Feature ranking of type 1 diabetes susceptibility genes improves prediction of type 1 diabetes. Diabetologia. 2014;57:2521–2529. doi: 10.1007/s00125-014-3362-1. - DOI - PubMed
    1. Dupuis J, et al. New genetic loci implicated in fasting glucose homeostasis and their impact on type 2 diabetes risk. Nat. Genet. 2010;42:105–116. doi: 10.1038/ng.520. - DOI - PMC - PubMed
    1. Cho YS, et al. Meta-analysis of genome-wide association studies identifies eight new loci for type 2 diabetes in east Asians. Nat. Genet. 2011;44:67–72. doi: 10.1038/ng.1019. - DOI - PMC - PubMed

Publication types

MeSH terms