. 2018 Jul 11;9(1):2676.
doi: 10.1038/s41467-018-05068-w.

An in vitro paradigm to assess potential anti-Aβ antibodies for Alzheimer's disease

Affiliations

An in vitro paradigm to assess potential anti-Aβ antibodies for Alzheimer's disease

Ming Jin et al. Nat Commun. .

Abstract

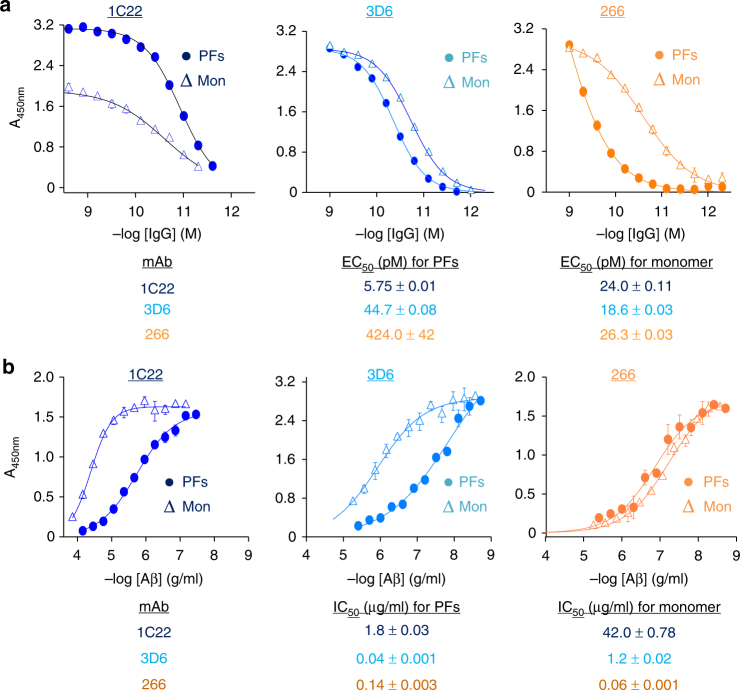
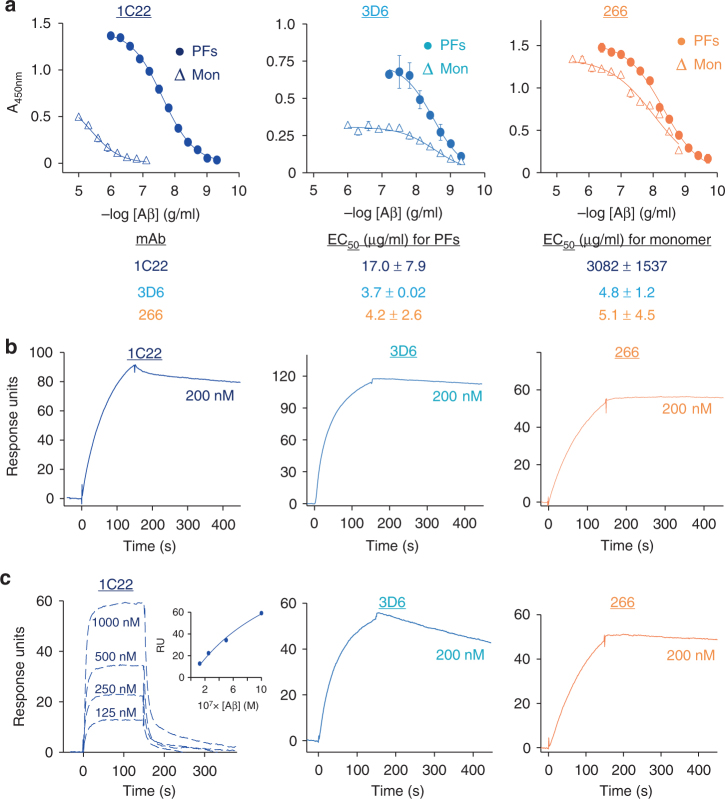
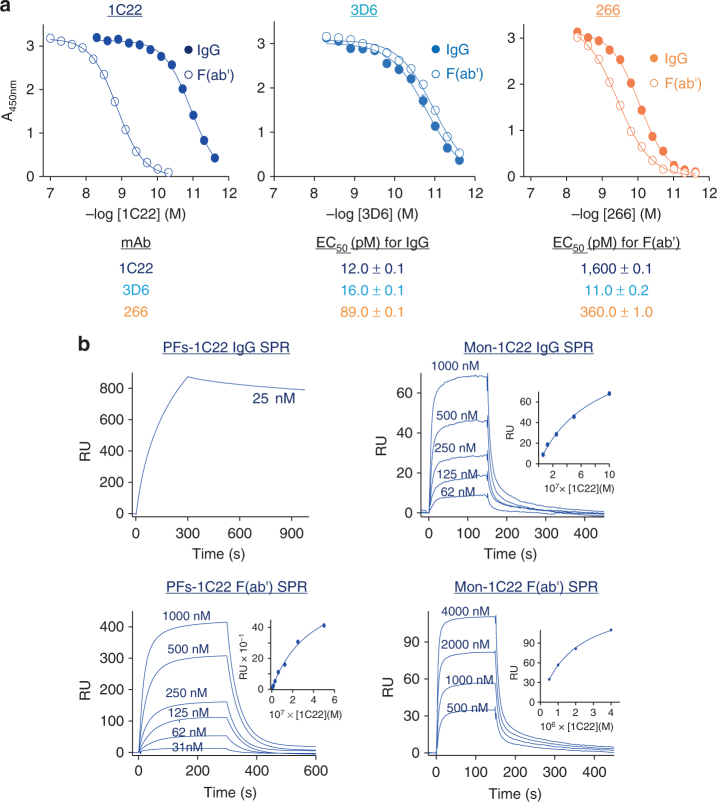
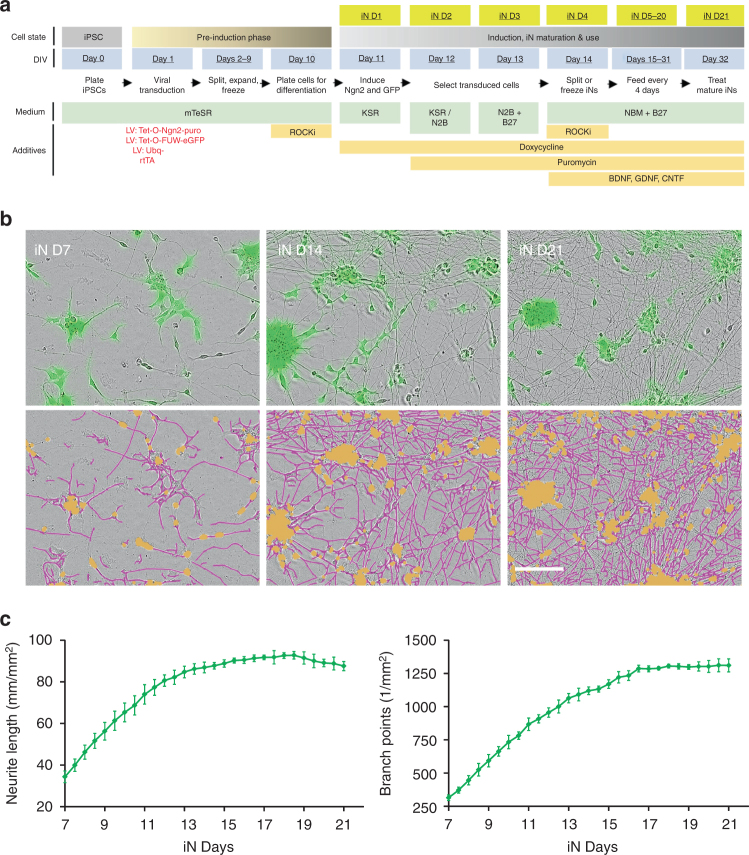
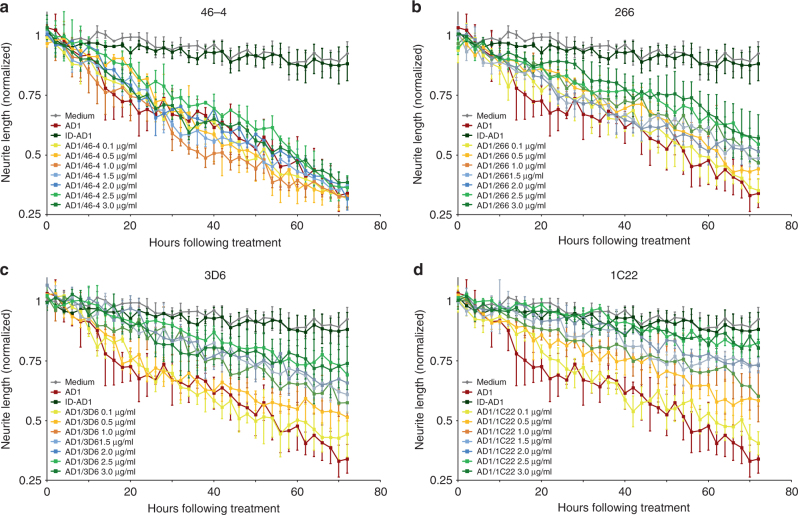
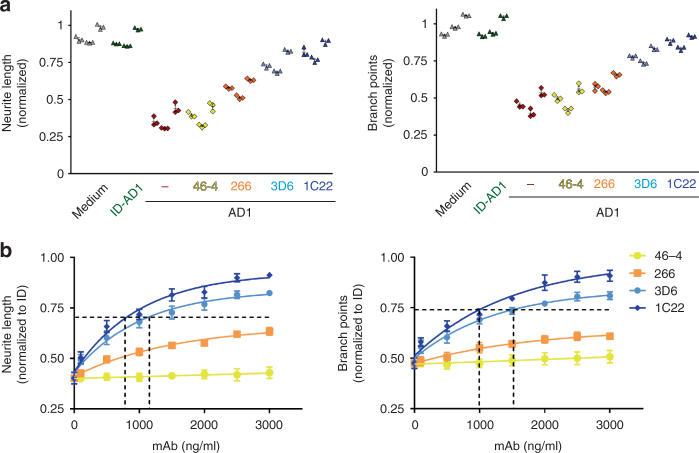
Although the amyloid β-protein (Aβ) is believed to play an initiating role in Alzheimer's disease (AD), the molecular characteristics of the key pathogenic Aβ forms are not well understood. As a result, it has proved difficult to identify optimal agents that target disease-relevant forms of Aβ. Here, we combined the use of Aβ-rich aqueous extracts of brain samples from AD patients as a source of human Aβ and live-cell imaging of iPSC-derived human neurons to develop a bioassay capable of quantifying the relative protective effects of multiple anti-Aβ antibodies. We report the characterization of 1C22, an aggregate-preferring murine anti-Aβ antibody, which better protects against forms of Aβ oligomers that are toxic to neurites than do the murine precursors of the clinical immunotherapeutics, bapineuzumab and solanezumab. These results suggest further examination of 1C22 is warranted, and that this bioassay maybe useful as a primary screen to identify yet more potent anti-Aβ therapeutics.


Conflict of interest statement

The authors declare no competing interests.

Figures

Fig. 1
Fig. 1
MAb 1C22 binds to PFs better than monomer. a Aβ1-40 monomer (Mon) and [Aβ1-40S26C]2 protofibrils (PFs) were immobilized at 200 ng/well on microtiter plates and mAbs 1C22, 3D6 and 266 diluted across the plates. Antibody binding curves were sigmoidally fit and used to determine the concentration of antibody that gave half-maximal binding EC50. Values in the table are in pM. b Aβ competition curves for mAbs binding to plate-immobilized Aβ monomers in the presence or absence of solution-phase Mon or PFs competitors were sigmoidally fit and used to determine the concentration of competitor that produced half-maximal inhibition of mAb binding (IC50). Values in the table are in μg/ml. In both a and b values are the average±SD of each condition analyzed in triplicate. When error bars are not visible they are smaller than the size of the symbol. Because we do not know the molecular weight of protofibrils the concentration of Aβ is given in μg/ml. In contrast, since the molecular weight of IgG is known, we provided mAb concentration in molar amounts. All Aβ concentrations are based on monomer molar equivalents and results are representative of at least 3 independent experiments
Fig. 2
Fig. 2
Surface-immobilized 1C22 mAb preferentially binds to PFs in solution. a mAbs 1C22, 3D6, and 266 were immobilized on the wells of microtiter plates and allowed to bind solution-phase protofibrils (PFs) and Aβ monomers (Mon). Antibody binding curves were sigmoidally fit and used to determine the concentration of antibody that gave half-maximal binding, EC50. When error bars are not visible they are smaller than the size of the symbol. Values in the table are in μg/ml and are the average ± SD of each condition analyzed in triplicate. Antibodies were immobilized on CM5 chips and solution-phase b PFs, or c Mon added. The molar concentration of Aβ monomers and PFs (wrt to Aβ monomer content) used is indicated on each sensogram. Except for Aβ monomer binding by 1C22, sensograms for mAb binding to Aβ monomers were fit to a 1:1 langmuir binding model. Sensograms for 1C22 binding to Aβ monomers were fit to steady state analysis. The inset in c panel 1 is a plot of response units (RU) at steady state for Aβ monomers binding to chip-immobilized 1C22. The apparent binding constant (KAPP) of mAbs for PFs are: 1C22 < 1 nM; 3D6 < 1 nM; 266 < 1 nM, and the binding constants (KD) for Mon are: 1C22 = 1100 ± 500 nM; 3D6 = 7.9 ± 0.16 nM; and 266 = 2.1 ± 1.8 nM
Fig. 3
Fig. 3
Bivalency drives 1C22 binding to PFs. a IgG and Fab binding curves for 1C22, 266, and 3D6 against plate-immobilized protofibrils (PFs). EC50 values determined from the sigmoidally fit curves demonstrated that 1C22 IgG had ~130-fold stronger reactivity against PFs than the 1C22 Fab fragment. In contrast, Fab fragments of 3D6 and 266 bound to PFs as strongly as the intact molecules. When error bars are not visible they are smaller than the size of the symbol. Values in the table are in pM and are the average ± SD of each condition analyzed in triplicate. b Representative sensograms for 1C22 IgG (upper panels) and Fab (lower panels) binding to CM5 chip-immobilized PFs (right panels) and monomer (Mon) (left panels) confirm that intact 1C22 binds more tightly to immobilized PFs than 1C22 Fab, whereas intact 1C22 and Fab bind similarly to Aβ monomer. Insets show plots of RU values at steady state for intact 1C22 and 1C22 Fab binding to PFs or Mon. The apparent binding constant of 1C22 IgG for PFs = 0.48 ± 0.002 nM, whereas the binding constant (KD) for 1C22 IgG with Mon = 1.39 ± 0.46 μM, and the KD for IgG Fab binding to PFs and Mon are: 0.80 ± 0.88 μM,1.14 ± 0.49 μM, respectively
Fig. 4
Fig. 4
Time-lapse imaging of differentiated human induced neuron (iNs). Human induced neuron (iNs) were prepared as described in the Supplementary Methods and used for live-cell imaging from iN day 0 to iN day 21. a Schematic depicts the process used to generate and mature iNs and indicates the nomenclature used to designate the different stages of the process. b Phase contrast and fluorescence images of iN days 7, 14, and 21 are shown in the upper panels. These images were then analyzed using the IncuCutye NeuroTrack algorithm to identify neurites (pink) and cell bodies (brown). NeuroTrack-identified neurites (pink) and cell bodies (brown) are shown superimposed on the phase contrast image in the lower panels. The Scale bar is 100 μm. c Images were collected at 12 h intervals from iN days 7–21 and analyzed using the IncuCutye NeuroTrack algorithm to determine neurite length (left) and the number of neurite branch points (right). Each data point is the average of measurement from 12 wells of iN cells cultured in the same 96 well plate. Error bars are SEM
Fig. 5
Fig. 5
Treatment of iNs with AD brain-derived soluble Aβ induces neuritic dystrophy. Live-cell imaging was used to monitor the effect of Aβ-containing AD brain extracts on iNs. a iN day 21 cultures were treated with mock-immunodepleted AD1 extract (Mock ID) or AD1 extract immunodepleted with the pan anti-Aβ antiserum AW7 (AW7 ID) and cells imaged for 72 h. Phase contrast images (left panels) at 0, 24, 48, and 72 h were analyzed using the IncuCutye NeuroTrack algorithm to identify neurites (middle panels) and the NeuroTrack-identified neurites (pink) are shown superimposed on the phase contrast image (right panels). Scale bars are 100 μm. b Each well of iNs was imaged for 6 h prior to addition of sample and NeuroTrack-identified neurite length and branch points used to normalize neurite length and branch points measured at each interval after addition of sample. Mock-ID AD1 extract was tested at 3 dilutions, 1:4, 1:8, and 1:16. Immunodepleted AD1 was tested at 1:4 and cells treated with medium alone were used to monitor the integrity of untreated cells. The values shown in graphs are the average of triplicate wells for each treatment ± SEM. c Plots of normalized neurite length (left panel) and neurite branch points (right panel) are derived from the last 6 h of the traces shown in b and in Supplementary Figure 8B and are presented as mean values ± SEM. Application of AD1 brain extract caused a decrease in both neurite length and branch points relative to: (i) the same neurons prior to treatment, and (ii) sister wells of untreated neurons (neurite length, p < 0.0001; branch points, p < 0.0001, two-way ANOVA). Importantly, AD1 extract that had been immunodepleted of Aβ had no significant effect on either neurite length or branch points (neurite length, p = 0.7195; branch points, p = 1.0000, two-way ANOVA). The results shown are representative of at least three independent experiments
Fig. 6
Fig. 6
Anti-Aβ antibodies dose-dependently attenuate the neuritotoxic effects of AD brain extracts. To determine whether anti-Aβ antibodies could protect against the neuritotoxicity induced by Aβ-containing AD brain extracts iNs were treated with AD1 extract at a dilution of 1:4 in the presence or absence of increasing amounts of antibody. Graphs show time-course measurements of NeuroTrack-defined neurite length of iNs treated ± AD1 extract and a 46-4, b 266, c 3D6, and d 1C22. Each data point is the average of 3 wells±SEM
Fig. 7
Fig. 7
MAb 1C22 more effectively protects against AD brain extract induced neuritotoxicity than either 3D6 or 266. Three independent experiments were conducted as in Fig. 6. a Graphs show the normalized change in NeuroTrack-defined neurite length or branch points over the last 6 h of imaging of iNs treated with AD1 extract ± 3 μg/ml mAbs 46–4, 266, 3D6, or 1C22. In each individual experiment, 1C22 almost completely protected against the neuritotoxicity of AD1 extract and always exerted a stronger effect than 3D6, and 3D6 always provided better protection than 266 (left panel, p = 0.9991, 1C22 vs 3D6; p < 0.0001, 1C22 vs 266, two-way ANOVA). Highly similar results were obtained for neurite branch points (right panel, p = 0.9464, 1C22 vs 3D6; p < 0.0001, 1C22 vs 266, two-way ANOVA). b To investigate the effect of mAb concentration, NeuroTrack-defined neurite length (left panel) was averaged over the last 6 h of imaging for each treatment and values normalized to the immunodepleted AD1 treatment and neurite length plotted vs. antibody concentration. The ability of mAbs to protect neurite branch points (right panel) was determined in a similar fashion as described for neurite length. Values are the average ± SD of each condition analyzed in triplicate. When error bars are not visible they are smaller than the size of the symbol

References

    1. Liu J, Yang B, Ke J, Li W, Suen WC. Antibody-based drugs and approaches against amyloid-beta species for Alzheimer’s disease immunotherapy. Drugs Aging. 2016;33:685–697. doi: 10.1007/s40266-016-0406-x. - DOI - PubMed
    1. Golde TE. Open questions for Alzheimer’s disease immunotherapy. Alzheimer’s Res. Ther. 2014;6:3. doi: 10.1186/alzrt233. - DOI - PMC - PubMed
    1. van Dyck CH. Anti-amyloid-beta monoclonal antibodies for Alzheimer’s disease: pitfalls and promise. Biol. Psychiatry. 2017;83:311–319. doi: 10.1016/j.biopsych.2017.08.010. - DOI - PMC - PubMed
    1. Kohyama K, Matsumoto Y. Alzheimer’s disease and immunotherapy: what is wrong with clinical trials? Immunotargets Ther. 2015;4:27–34. - PMC - PubMed
    1. Selkoe DJ, Hardy J. The amyloid hypothesis of Alzheimer’s disease at 25 years. EMBO Mol. Med. 2016;8:595–608. doi: 10.15252/emmm.201606210. - DOI - PMC - PubMed

Publication types

MeSH terms