. 2019 Apr;25(4):1732-1745.
doi: 10.1109/TVCG.2018.2817557. Epub 2018 Mar 20.

Precision Risk Analysis of Cancer Therapy with Interactive Nomograms and Survival Plots

Precision Risk Analysis of Cancer Therapy with Interactive Nomograms and Survival Plots

G Elisabeta Marai et al. IEEE Trans Vis Comput Graph. 2019 Apr.

Abstract

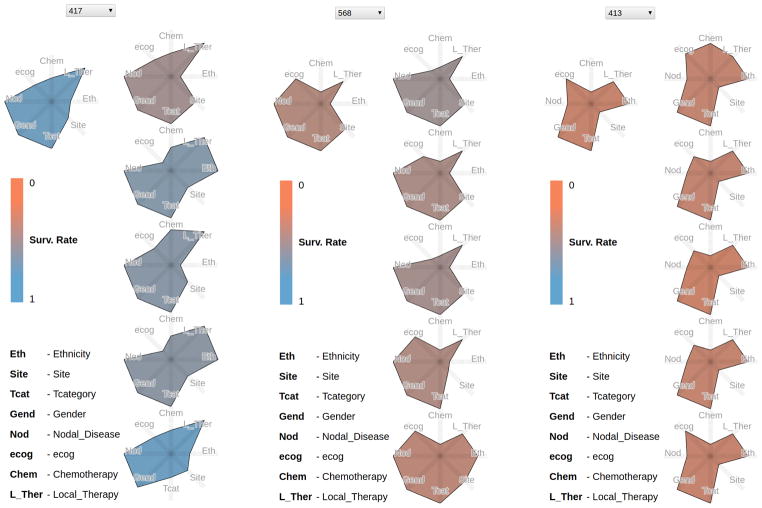
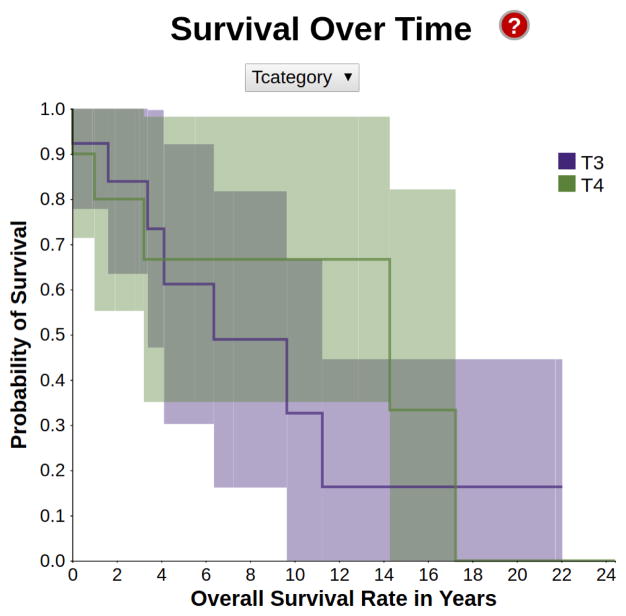
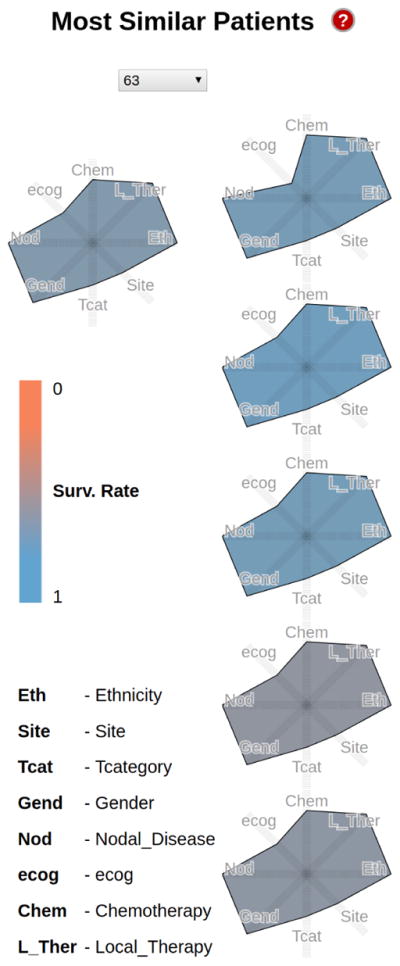
We present the design and evaluation of an integrated problem solving environment for cancer therapy analysis. The environment intertwines a statistical martingale model and a K Nearest Neighbor approach with visual encodings, including novel interactive nomograms, in order to compute and explain a patient's probability of survival as a function of similar patient results. A coordinated views paradigm enables exploration of the multivariate, heterogeneous and few-valued data from a large head and neck cancer repository. A visual scaffolding approach further enables users to build from familiar representations to unfamiliar ones. Evaluation with domain experts show how this visualization approach and set of streamlined workflows enable the systematic and precise analysis of a patient prognosis in the context of cohorts of similar patients. We describe the design lessons learned from this successful, multi-site remote collaboration.


Figures

Fig. 1
Fig. 1
Patient prognosis for a white female with T4 supraglottic cancer. The Kiviat panel (left) shows the patient along with the five most similar patients in the repository; glyph colors (mapped to the computed survival probability) capture a notable variation of therapy outcomes. The interactive nomogram shows that despite variation in treatment, similar T4 patients (green) have similar low survival outcomes, below 0.5. Two similar patients with higher survival are revealed to be T3-level (purple). The Kaplan-Meier survival over time plot, however, predicts similar trajectories for the T3 and more severe T4 category. The mosaic context confirms that even the T3 female subgroup has low mean survival rates, below 0.5.
Fig. 2
Fig. 2
Example Kiviat panels for three patients (417, 568, 413). Each panel shows on the left the patient currently selected, and on the right the 5 most similar patients. The glyph colors encode the patient survival rate, from good (blue) to worse (orange). While the Kiviats encode few-valued categorical data, as opposed to quantitative, note how the glyph shapes in the small multiple display capture the patient similarity at a glance.
Fig. 3
Fig. 3
Interactive nomogram for a white female subject with T3 supraglottic cancer, before (top) and after (middle and bottom) axis editing. A filter has been applied along the age axis in all versions. In the top image, a mouse-over highlights one similar patient of interest. In the middle version, a statistician has determined that the gender axis is irrelevant and has removed it. In the bottom version, some axes have been rescaled and translated, in order to generate a cleaner, publishable paper nomogram [41].
Fig. 4
Fig. 4
A survival encoding in the style of Kaplan-Meier, showing the different survival probability distributions depending on the cancer stage. For this interactive plot, white patients with supraglottic cancer were selected.
Fig. 5
Fig. 5
Mosaic investigation of survival rates and cancer sites context for a Hispanic patient. Left: Glottic cancers (second box from the top, in blue for all ethnicities) indicate high (above 0.52) 5-year mean survival rates across ethnicities. Right: Hispanics, Asian and undetermined ethnicities with glottic cancers have even higher (above 0.69) mean survival rates. However, only the Hispanic group (rightmost column) contains enough samples to warrant further investigation.
Fig. 6
Fig. 6
T-category survival plot for Hispanic glottic cancer cases (T3 in brown, and T4 in pink). The T4 and T3 ribbons (standard deviation) are both wide and at times overlapping. The predicted survival time in months for T3 cases is significantly longer than the one for T4. However, and surprisingly, T4 cases feature higher probability of survival in the middle 4 to 17 years survival period than T3 cases: note that in this 4–17 interval (X axis) the T4 line chart is higher than the T3 line chart.
Fig. 7
Fig. 7
Kiviat profile for a Hispanic male patient with glottic cancer, and the 5 most similar patients in the repository. The polygon shade encodes the 5-year survival rate (blue is better, grays and browns towards orange are worse). Note how similar the six patients are with respect to 8 variables.
Fig. 8
Fig. 8
Three of the possible workflows through the explorer, as observed during evaluation with domain experts who had different backgrounds. These observations show how panel layout in a linked views approach enable multiple workflows.

References

    1. http://www.cancer.gov/research/progress/snapshots/head-and-neck,” Retrieved Aug 2016.

    1. Zhang L, Garden AS, Lo J, Ang KK, Ahamad A, Morrison WH, Rosenthal DI, Chambers MS, Zhu XR, Mohan R, et al. Multiple regions-of-interest analysis of setup uncertainties for head-and-neck cancer radiotherapy. International Journal of Radiation Oncology* Biology* Physics. 2006;64(5):1559–1569. - PubMed
    1. Nakata A, Tateoka K, Fujimoto K, Saito Y, Nakazawa T, Abe T, Yano M, Sakata K, et al. The reproducibility of patient setup for head and neck cancers treated with image-guided and intensity-modulated radiation therapies using thermoplastic immobilization device. International Journal of Medical Physics, Clinical Engineering and Radiation Oncology. 2013;2(04):117.
    1. Perni S, Mohamed A, Garden A, Gunn G, Rosenthal D, Scott J, Fuller C. Impact of pretreatment volumetric tumor growth velocity on oncologic outcomes in oropharyngeal squamous cell cancer. International Journal of Radiation Oncology Biology Physics. 2016;94(4):917–918.
    1. Lewin T, Kim J, Latifi K, Poleszczuk J, Bull J, Byrne H, Torres-Roca J, Moros E, Gatenby R, Harrison L, et al. Proliferation saturation index predicts oropharyngeal squamous cell cancer gross tumor volume reduction to prospectively identify patients for adaptive radiation therapy. International Journal of Radiation Oncology Biology Physics. 2016;94(4):903.

Publication types