. 2018 Nov;26(11):2134-2144.
doi: 10.1109/TNSRE.2018.2839565. Epub 2018 May 21.

Reshaping Movement Distributions With Limit-Push Robotic Training

Reshaping Movement Distributions With Limit-Push Robotic Training

Amit K Shah et al. IEEE Trans Neural Syst Rehabil Eng. 2018 Nov.

Abstract

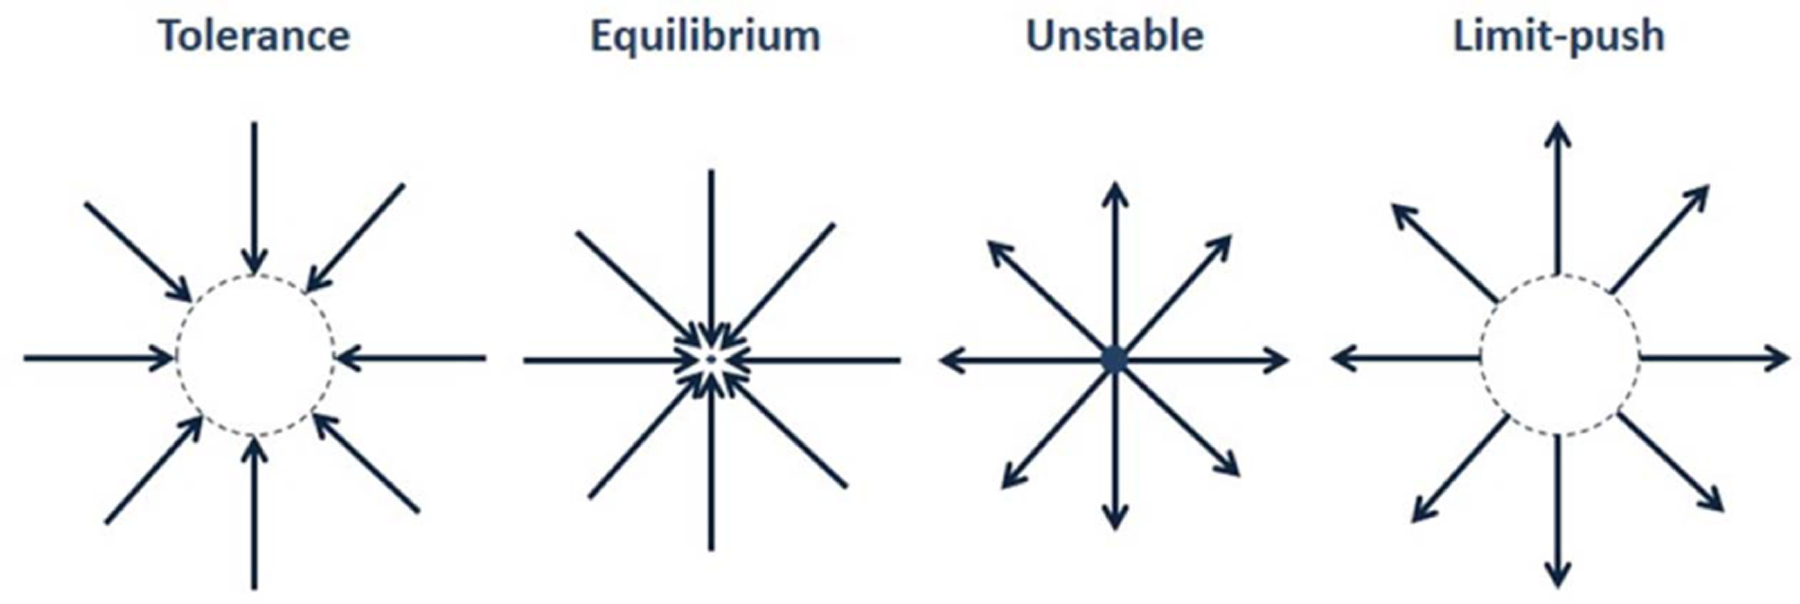
High-cost situations need to be avoided. However, occasionally, cost may only be learned by experience. Here, we tested whether an artificially induced unstable and invisible high-cost region, a "limit-push" force field, might reshape people's motion distributions. Healthy and neurologically impaired (chronic stroke) populations attempted 600 interceptions of a projectile while holding a robot handle that could render forces to the hand. The "limit-push," in the middle of the study, pushed the hand outward unless the hand stayed within a box-shaped region. Both healthy and some stroke survivors adapted through selection of safer actions, avoiding the high-cost regions (outside the box); they stayed more inside and even kept a greater distance from the box's boundaries. This was supported by other measures that showed subjects distributed their hand movements within the box more uniformly. These effects lasted a very short time after returning to the no-force condition. Although most robotic teaching approaches focus on shifting the mean, this limit-push treatment demonstrates how both mean and variance might be reshaped in motor training and neurorehabilitation.


Figures

Fig. 1.
Fig. 1.
Several Classes of Force Fields. Limit-push forces push subjects away from a region once subject is outside the region.
Fig. 2.
Fig. 2.
(A) Experimental Setup: Gray shaded box (3.75 cm depth along anterior-posterior axis) denotes the invisible low-cost region. Virtual projectile is launched along anterior-posterior axis approximately 0.8 m from workspace. The subject manipulated the robot in a 3d environment within a workspace (sphere). (B) Top-down View of Task During Treatment. Shaded region is the invisible box-like region. Arrows show direction of forces when hand is outside the box. The distribution of trajectory paths of the projectiles is shown as yellow shaded horizontal lines.
Fig. 3.
Fig. 3.
Typical screenshot view (A) and three representative interception trials from pre-treatment (B), early treatment (C), and late treatment (D). The projectile (blue cube) and the hand (red cube) are shown at interception. The circles represent the subject’s initial position at launch of the projectile.
Fig. 4.
Fig. 4.
2D Projections of Healthy Treatment Subjects. Each colored dot is a different subject. Columns are snapshots of phases where pre-treatment represents the last 25 trials before the forces, end-treatment represents the last 25 trials of the treatment phase, early post-treatment represents the first 25 trials after the forces are deactivated and late post-treatment is the final 25 trials. The first row is top-down view, bottom row is side view. Note how the variability in position along anterior-posterior axis reduces with active limit-push forces by the end of treatment phase, but starts to increase once forces are off in the post-treatment phase. Variability in position is not visibly constrained along any other dimension.
Fig. 5.
Fig. 5.
Two Typical Healthy Subjects (Treatment, Control). Anterior-posterior position distribution of healthy treatment and healthy control subject. Gray shaded region indicates forces were on and the presence of a high-cost region. The red shaded and blue shaded curves are the resultant probability distributions of the anterior-posterior hand positions over 25 trial windows for a typical (A) treatment and (B) control subjects. When forces were on subjects clustered their distribution within the box-shaped low-cost region, but washed out when turned off. Black dots are the raw position data along the anterior-posterior axis. The minimum and maximum value along that axis were plotted along with every 20th sample.
Fig. 6.
Fig. 6.
Two Exemplary Stroke Subjects. Plot feature explanations are the same as Fig. 5. Behavior is similar to the healthy subjects shown before. The chosen stroke treatment subject was the best in the group at staying within the box.
Fig. 7.
Fig. 7.
Coefficient of Determination (CoD) Plots. Healthy treatment (A, red) and control (B, blue) and stroke treatment (C, red), and control (D, blue) CoD fits of ideal bounded-uniform distribution of positions along anterior-posterior axis, 25 trials at a time, in an overlapping moving window. As can be seen, the red shaded region is largely positive during treatment phase in the treatment groups, and even after the forces are off there is greater incidence of positive CoD signifying that the subject tended to reduce time spent outside the boxed region more than before. Control subject does not exhibit this behavior. Cartoon inset shows how the distributions were computed and compared to the ideal bounded uniform distribution to derive the CoD score. When the subject was outside the 3.75 cm depth of the box region, a negative CoD would generally result (an extremely poor fit). Each colored line indicates movement traces that contributed to the distribution (shaded light red). Gold rectangle edges are bounds of the low-cost region.
Fig. 8.
Fig. 8.
MoS Group and Population Changes Across Experiment. Red = treatment; blue = control. Wings are 95% confidence intervals. (A) Measure of Safety (MoS) is plotted for each phase from the healthy population. MoS slightly decreases upon onset of forces before it increases after prolonged exposure for the treatment group. The control group is worse across this similar period. The change across treatment was statistically significant between groups. No effect is evident during post-treatment as subjects return to pre-treatment variability once forces are off. (B) The stroke population MoS is plotted for each phase. No statistically significant change was found across treatment phase for the treatment group, though a positive trend is visible. There was a sharp decrease in MoS upon onset of forces before some improvement compared to pre-treatment levels. Stroke subjects were more variable in their response to the forces than the healthy population as indicated by the large confidence intervals by end of treatment.
Fig. 9.
Fig. 9.
CoD Group and Population Changes Across Experiment. Red = treatment; blue = control. Wings are 95% confidence intervals. (A) CoD increases after prolonged exposure for the treatment group. The control group is worse across this similar period. The change was statistically significant across the treatment phase between groups. No effect is evident during post-treatment as subjects return to pre-treatment variability once forces are off. (B) Bar plots of Stroke population plotting CoD for each phase. No statistically significant change was found across treatment phase for the treatment group, though a positive trend is visible. Subjects were more variable in their response to the forces compared to the healthy population as indicated by the large confidence intervals by end of treatment.

References

    1. Hausdorff JM, Rios DA, and Edelberg HK, “Gait variability and fall risk in community-living older adults: A 1-year prospective study,” Arch. Phys. Med. Rehabil, vol. 82, no. 8, pp. 1050–1056, Aug. 2001. - PubMed
    1. Armand M, Huissoon JP, and Patla AE, “Stepping over obstacles during locomotion: Insights from multiobjective optimization on set of input parameters,” IEEE Trans. Rehabil. Eng, vol. 6, no. 1, pp. 43–52, Mar. 1998. - PubMed
    1. Branton P, “A field study of repetitive manual work in relation to accidents at the work place,” Int. J. Prod. Res, vol. 8, no. 2, pp. 93–107, 1970.
    1. Thies SB et al., “Movement variability in stroke patients and controls performing two upper limb functional tasks: A new assessment methodology,” J. Neuroeng. Rehabil, vol. 6, no. 1, p. 2, 2009. - PMC - PubMed
    1. Kamper DG, McKenna-Cole AN, Kahn LE, and Reinkensmeyer DJ, “Alterations in reaching after stroke and their relation to movement direction and impairment severity,” Arch. Phys. Med. Rehabil, vol. 83, pp. 702–707, May 2002. - PubMed

Publication types