. 2018 Aug;37(8):1835-1846.
doi: 10.1109/TMI.2018.2804799. Epub 2018 Feb 9.

Deep Learning for Quantification of Epicardial and Thoracic Adipose Tissue From Non-Contrast CT

Deep Learning for Quantification of Epicardial and Thoracic Adipose Tissue From Non-Contrast CT

Frederic Commandeur et al. IEEE Trans Med Imaging. 2018 Aug.

Abstract

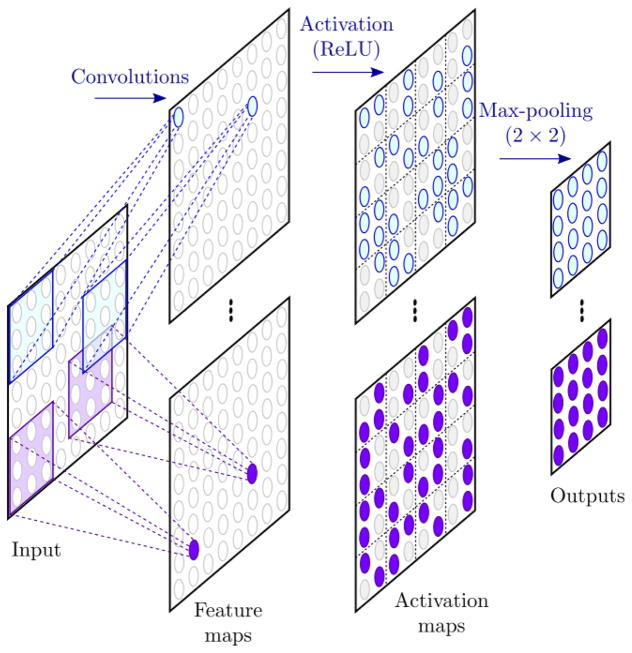
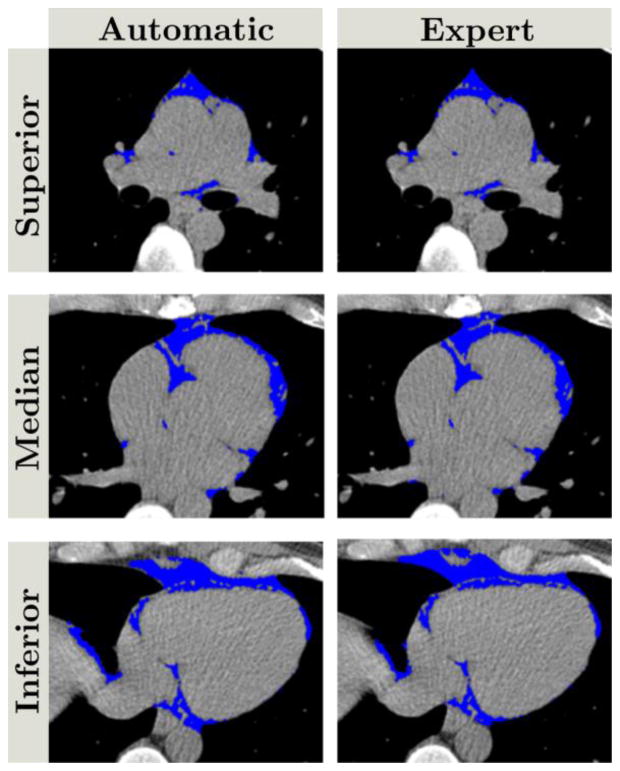
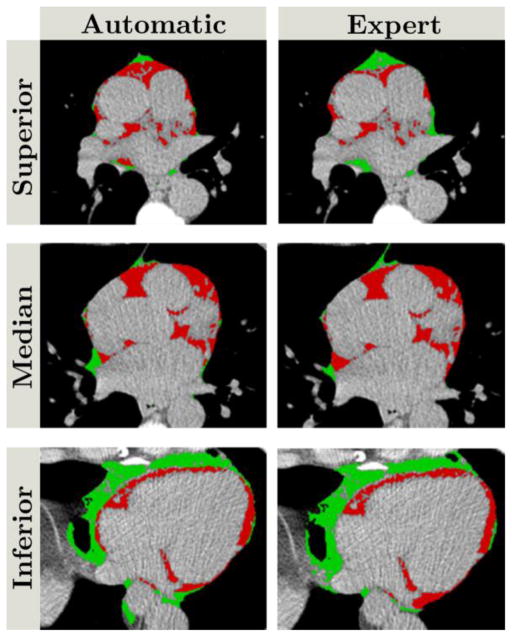
Epicardial adipose tissue (EAT) is a visceral fat deposit related to coronary artery disease. Fully automated quantification of EAT volume in clinical routine could be a timesaving and reliable tool for cardiovascular risk assessment. We propose a new fully automated deep learning framework for EAT and thoracic adipose tissue (TAT) quantification from non-contrast coronary artery calcium computed tomography (CT) scans. The first multi-task convolutional neural network (ConvNet) is used to determine heart limits and perform segmentation of heart and adipose tissues. The second ConvNet, combined with a statistical shape model, allows for pericardium detection. EAT and TAT segmentations are then obtained from outputs of both ConvNets. We evaluate the performance of the method on CT data sets from 250 asymptomatic individuals. Strong agreement between automatic and expert manual quantification is obtained for both EAT and TAT with median Dice score coefficients of 0.823 (inter-quartile range (IQR): 0.779-0.860) and 0.905 (IQR: 0.862-0.928), respectively; with excellent correlations of 0.924 and 0.945 for EAT and TAT volumes. Computations are performed in <6 s on a standard personal computer for one CT scan. Therefore, the proposed method represents a tool for rapid fully automated quantification of adipose tissue and may improve cardiovascular risk stratification in patients referred for routine CT calcium scans.


Figures

Figure 1
Figure 1
Pericardium and adipose tissues in calcium scoring non-contrast CT.
Figure 2
Figure 2
Example of a hidden convolutional unit (HCU). Convolutions are performed on the input to provide feature maps. Each neuron in the feature maps responds only to its receptive field in the input, defined by the kernel size. Activation function is then applied to provide non-linearity in the network. Finally, a pooling layer reduces the dimension of the maps and increases the shift invariance of the feature detection.
Figure 3
Figure 3
Framework of the proposed method. An axial slice is given as input of the first network Net1, which performs 3 simultaneous tasks: (1) slice prediction of being located between heart limits, (2) thoracic mask segmentation and (3) epicardial-paracardial masks segmentation. A second network Net2 is used to perform pericardium line detection after atransformation of the input in cylindrical coordinates. A SSM shape regularization is then performed to obtain the final masksegmentation. A post-processing step, including Hounsfield unit threshold and median filtering, provides the adipose tissue masks.
Figure 4
Figure 4
Multi-task loss evolution during the first fold optimization. Plain and dash lines represent loss of the training and validation datasets, respectively.
Figure 5
Figure 5
Automatic vs. expert TAT quantifications. An excellent agreement was obtained with a high correlation (R=0.945).
Figure 6
Figure 6
Bland-Altman analysis of automatic vs. expert TAT quantifications. The analysis demonstrated a non-significant bias between the two measures (0.12 cm3, p=0.92).
Figure 7
Figure 7
Comparison of automatic (left column) and expert (right column) thoracic fat segmentation. Blue pixels correspond to fat pixels obtained after post-processing the thoracic mask from Net1. Top, middle and bottom rows correspond to superior, median, and inferior parts of the heart, respectively. The DSC was 0.905.
Figure 8
Figure 8
Pericardium defined by Net1 (green) and after SSM regularization (red), compared to the expert delineation (white). While the green line presents a non-reliable shape, the combination of the Net2 and the SSM ensures a smooth pericardium contour closer to the expert delineation.
Figure 9
Figure 9
Automatic vs. expert EAT quantifications. A very high correlation was obtained between both measurements (R=0.926
Figure 10
Figure 10
Bland-Altman analysis of automatic vs. expert EAT quantifications. A non-significant bias of −1.41 cm3 was obtained (p=0.79).
Figure 11
Figure 11
Comparison of automatic (left column) and expert (right column) epicardial (red)/paracardial (green) adipose tissue segmentations. Top, middle and bottom rows correspond to superior, median, and inferior parts of the heart, respectively. The DSC was 0.823.
Figure 12
Figure 12
Axial slice from an outlier case (68-year old male) with BMI 31.1. We observe larger amount of adipose tissue in the superior and anterior part of the heart (yellow arrow). The pericardium is also invisible in this part, which explains the failure of the algorithm to provide a contour (red) close to the expert delineation (white). This pattern is present in most of the outliers in our results.

References

    1. Mahabadi AA, Massaro JM, Rosito GA, Levy D, Murabito JM, Wolf PA, O’Donnell CJ, Fox CS, Hoffmann U. Association of pericardial fat, intrathoracic fat, and visceral abdominal fat with cardiovascular disease burden: the Framingham Heart Study. European Heart Journal. 2009;30(7):850–856. - PMC - PubMed
    1. Mahabadi AA, Reinsch N, Lehmann N, Altenbernd J, Kalsch H, Seibel RM, Erbel R, Mohlenkamp S. Association of pericoronary fat volume with atherosclerotic plaque burden in the underlying coronary artery: a segment analysis, (in eng) Atherosclerosis. 2010 Jul;211(1):195–9. - PubMed
    1. Tamarappoo B, Dey D, Shmilovich H, Nakazato R, Gransar H, Cheng VY, Friedman JD, Hayes SW, Thomson LE, Slomka PJ, et al. Increased pericardial fat volume measured from noncontrast CT predicts myocardial ischemia by SPECT, (in eng) JACC Cardiovasc Imaging. 2010 Nov;3(11):1104–12. - PMC - PubMed
    1. Mazurek T, Zhang L, Zalewski A, Mannion JD, Diehl JT, Arafat H, Sarov-Blat L, O’Brien S, Keiper EA, Johnson AG, et al. Human Epicardial Adipose Tissue Is a Source of Inflammatory Mediators. Circulation. 2003;108:2460–2466. - PubMed
    1. Shimabukuro M, Hirata Y, Tabata M, Dagvasumberel M, Sato H, Kurobe H, Fukuda D, Soeki T, Kitagawa T, Takanashi S, et al. Epicardial adipose tissue volume and adipocytokine imbalance are strongly linked to human coronary atherosclerosis, (in eng) Arterioscler Thromb Vasc Biol. 2013 May;33(5):1077–84. - PubMed

Publication types