. 2019 Jan;23(1):407-415.
doi: 10.1109/JBHI.2018.2810820. Epub 2018 Feb 28.

Accounting for Label Uncertainty in Machine Learning for Detection of Acute Respiratory Distress Syndrome

Accounting for Label Uncertainty in Machine Learning for Detection of Acute Respiratory Distress Syndrome

Narathip Reamaroon et al. IEEE J Biomed Health Inform. 2019 Jan.

Abstract

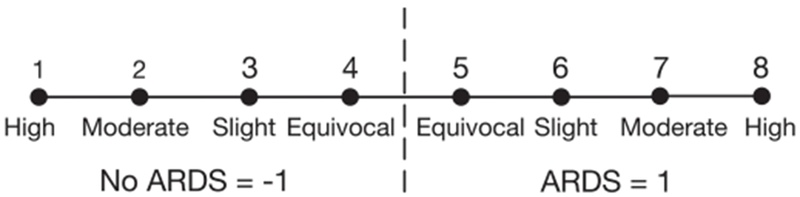
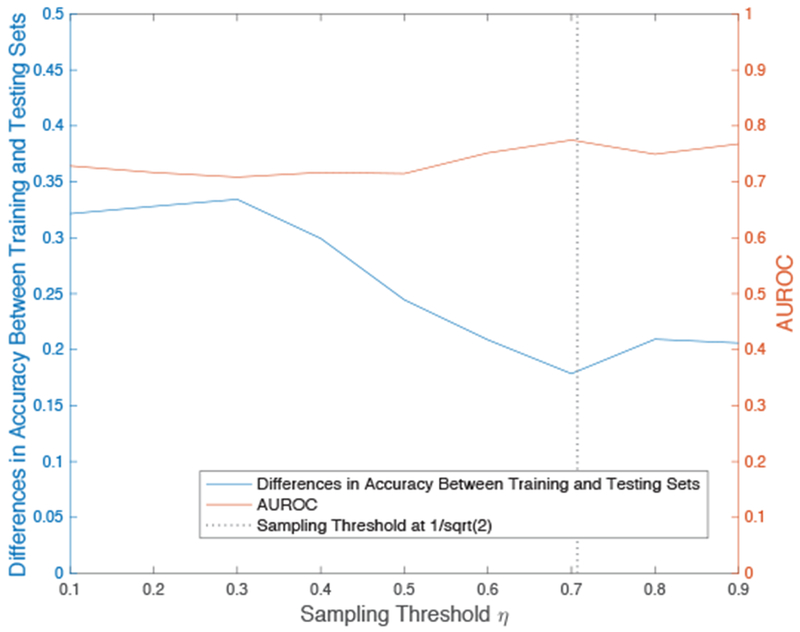
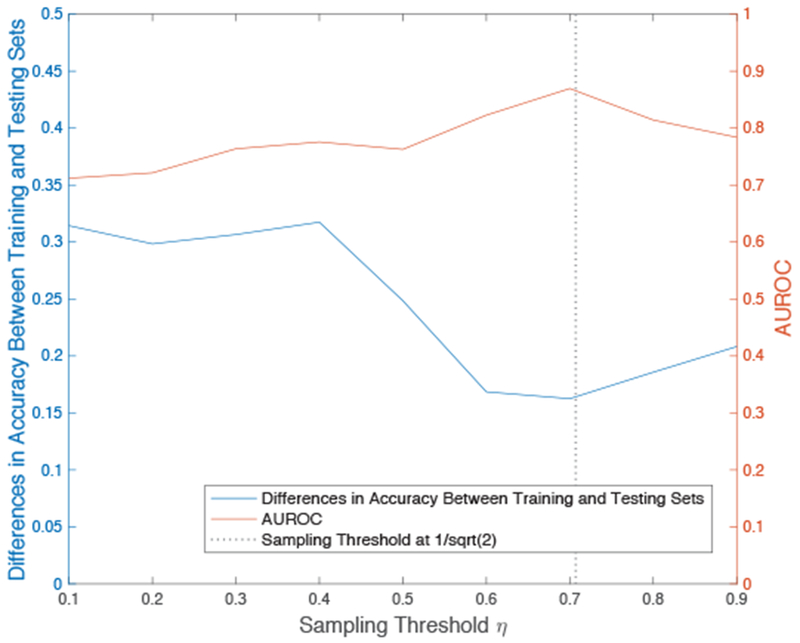
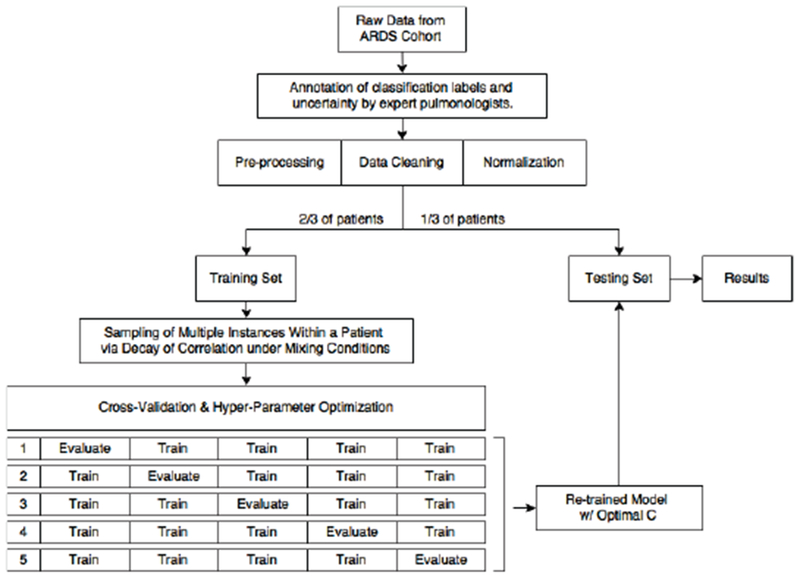
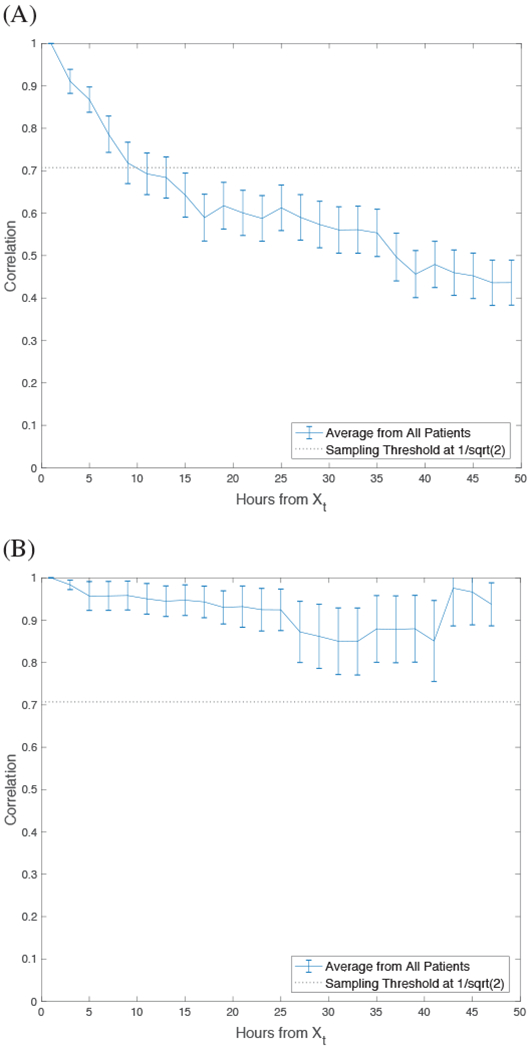
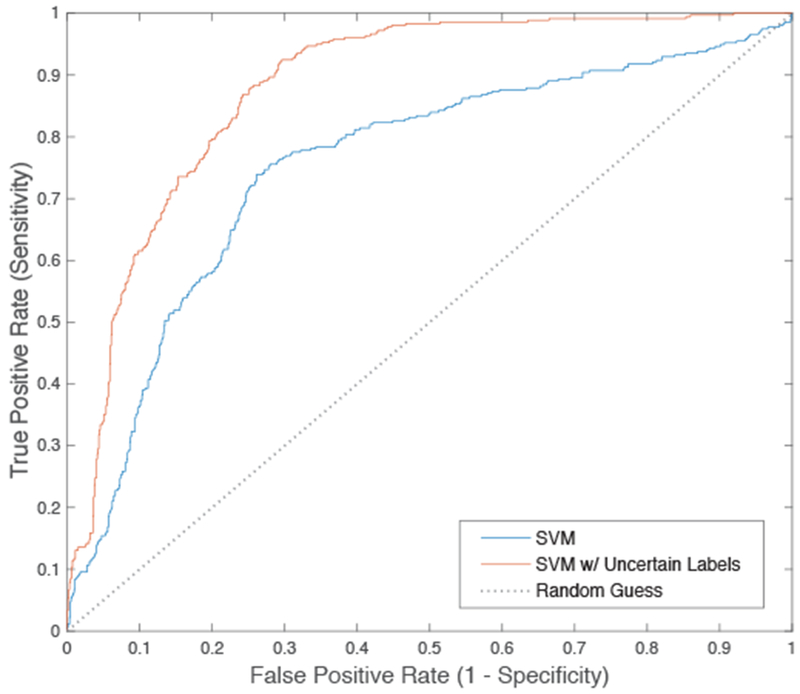
When training a machine learning algorithm for a supervised-learning task in some clinical applications, uncertainty in the correct labels of some patients may adversely affect the performance of the algorithm. For example, even clinical experts may have less confidence when assigning a medical diagnosis to some patients because of ambiguity in the patient's case or imperfect reliability of the diagnostic criteria. As a result, some cases used in algorithm training may be mislabeled, adversely affecting the algorithm's performance. However, experts may also be able to quantify their diagnostic uncertainty in these cases. We present a robust method implemented with support vector machines (SVM) to account for such clinical diagnostic uncertainty when training an algorithm to detect patients who develop the acute respiratory distress syndrome (ARDS). ARDS is a syndrome of the critically ill that is diagnosed using clinical criteria known to be imperfect. We represent uncertainty in the diagnosis of ARDS as a graded weight of confidence associated with each training label. We also performed a novel time-series sampling method to address the problem of intercorrelation among the longitudinal clinical data from each patient used in model training to limit overfitting. Preliminary results show that we can achieve meaningful improvement in the performance of algorithm to detect patients with ARDS on a hold-out sample, when we compare our method that accounts for the uncertainty of training labels with a conventional SVM algorithm.


Figures

Fig. 1:
Fig. 1:
Accounting for uncertainty in a classification label using a clinical expert’s confidence in the diagnosis of ARDS. Critical care trained clinicians were asked to independently review patients’ EHR data and determine if any individuals in the cohort had ARDS, while also rating their confidence of the diagnosis using the following scale: equivocal, slight, moderate, or high.
Fig. 2:
Fig. 2:
Effects of different sampling thresholds on prediction generalizability with SVM. With our sampling strategy, SVM performs very well on the training data at any threshold. We indicate the loss in training accuracy when the same model makes a prediction on a hold-out testing set to properly assess the effects of changing the sampling threshold and empirically determine the value for optimal results.
Fig. 3:
Fig. 3:
Effects of different sampling thresholds on prediction generalizability with SVM and label uncertainty. We confirm that the sampling strategy and threshold effects observed in Figure 2 is maintained when the SVM model is formulated to account for label uncertainty.
Fig. 4:
Fig. 4:
Flowchart of this study’s protocol with 5-fold cross-validation and hyper-parameter optimization using grid search. All samples from the same patient are kept exclusively in either the training or testing set. Hyper-parameter optimization was implemented for separately each model (with and without label uncertainty weight) to give an accurate assessment of performance.
Fig. 5:
Fig. 5:
Average decay of correlation from all patients. Error bars represent standard error of the mean and each point represents correlation in relation to time (hours) from the initial observation sampled on each patient.
Fig. 6:
Fig. 6:
Average decay of correlation from all patients during (A) negative diagnosis of ARDS and (B) positive diagnosis of ARDS. Error bars represent standard error of the mean and each point represents correlation in relation to time (hours) from the initial observation sampled on each patient.
Fig. 7:
Fig. 7:
ROC curve comparing SVM with and without label uncertainty. Performance metrics are reported in Table 1.

References

    1. Rubenfeld GD et al. , Incidence and outcomes of acute lung injury, N Engl J Med, vol. 353(16), pp. 1685–1693. October 2005. - PubMed
    1. Sweeney RM, McAuley DF. Acute respiratory distress syndrome, Lancet, vol. 388(10058), pp. 2416–2430. November 2016. - PMC - PubMed
    1. Bellani G et al. , Epidemiology, Patterns of Care, and Mortality for Patients With Acute Respiratory Distress Syndrome in Intensive Care Units in 50 Countries, JAMA, vol. 315(8), pp. 788–800. February 2016. - PubMed
    1. Clark BJ, Moss M, The Acute Respiratory Distress Syndrome: Dialing in the Evidence? JAMA, vol. 315(8), pp. 759–761. February 2016. - PMC - PubMed
    1. Sjoding MW, Hyzy RC, Recognition and Appropriate Treatment of the Acute Respiratory Distress Syndrome Remains Unacceptably Low, Crit Care Med, vol. 44(8), pp. 1611–1612. August 2016. - PMC - PubMed

Publication types

MeSH terms