. 2018 Nov 1;120(5):2182-2200.
doi: 10.1152/jn.00650.2017. Epub 2018 Jul 11.

Automated in vivo patch-clamp evaluation of extracellular multielectrode array spike recording capability

Affiliations

Automated in vivo patch-clamp evaluation of extracellular multielectrode array spike recording capability

Brian D Allen et al. J Neurophysiol. .

Abstract

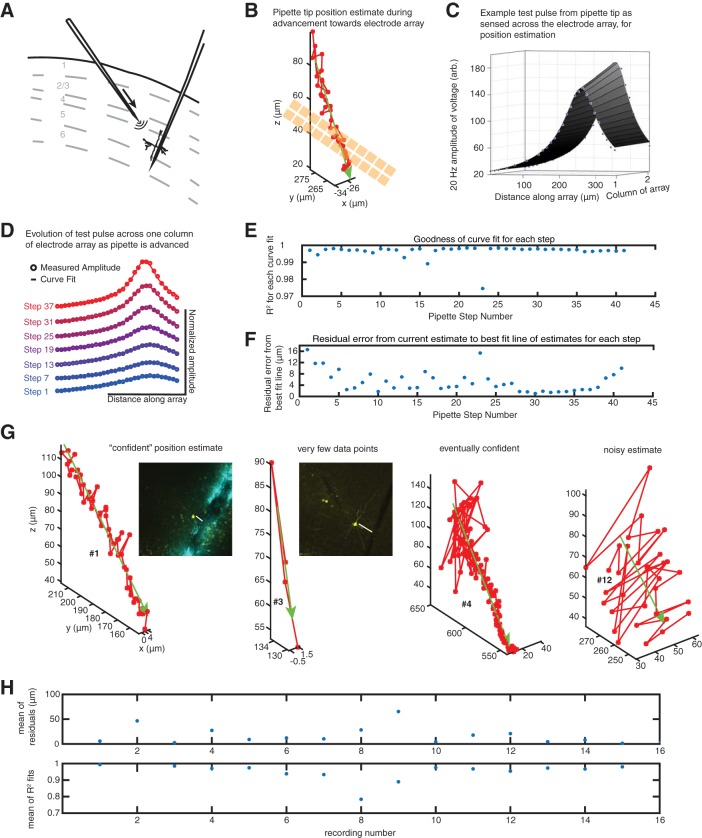
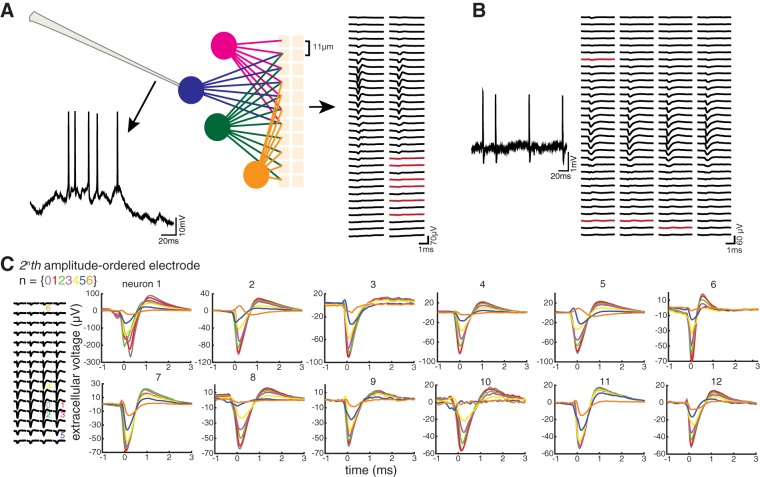
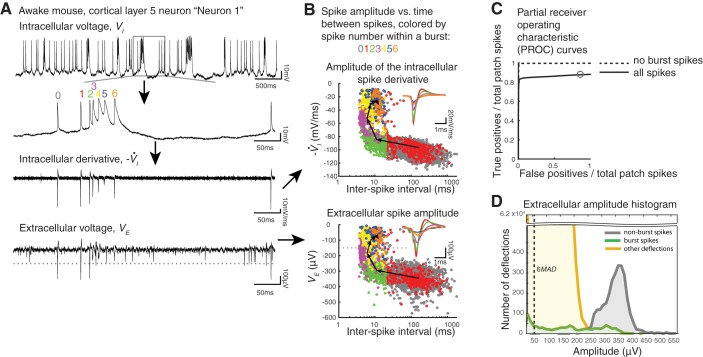
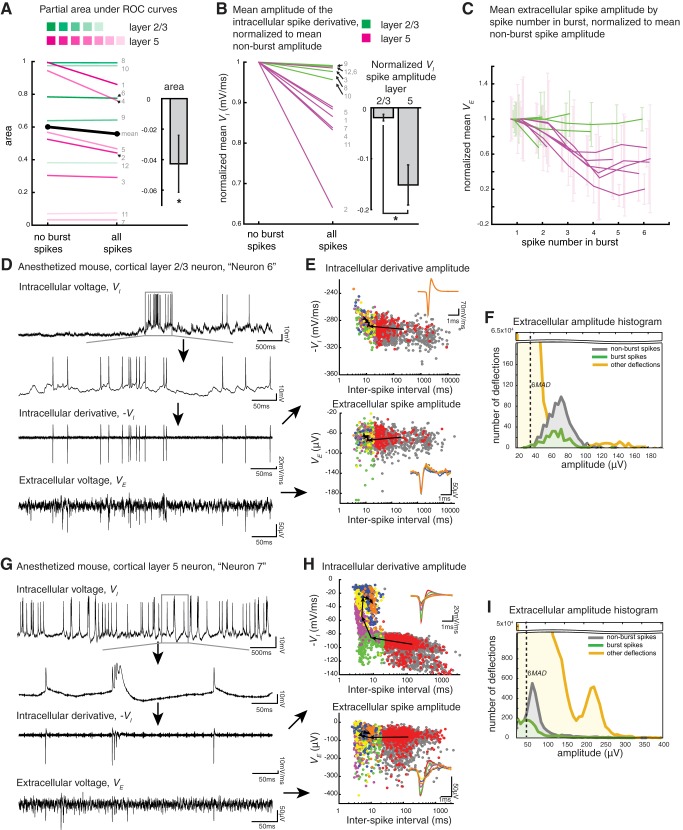
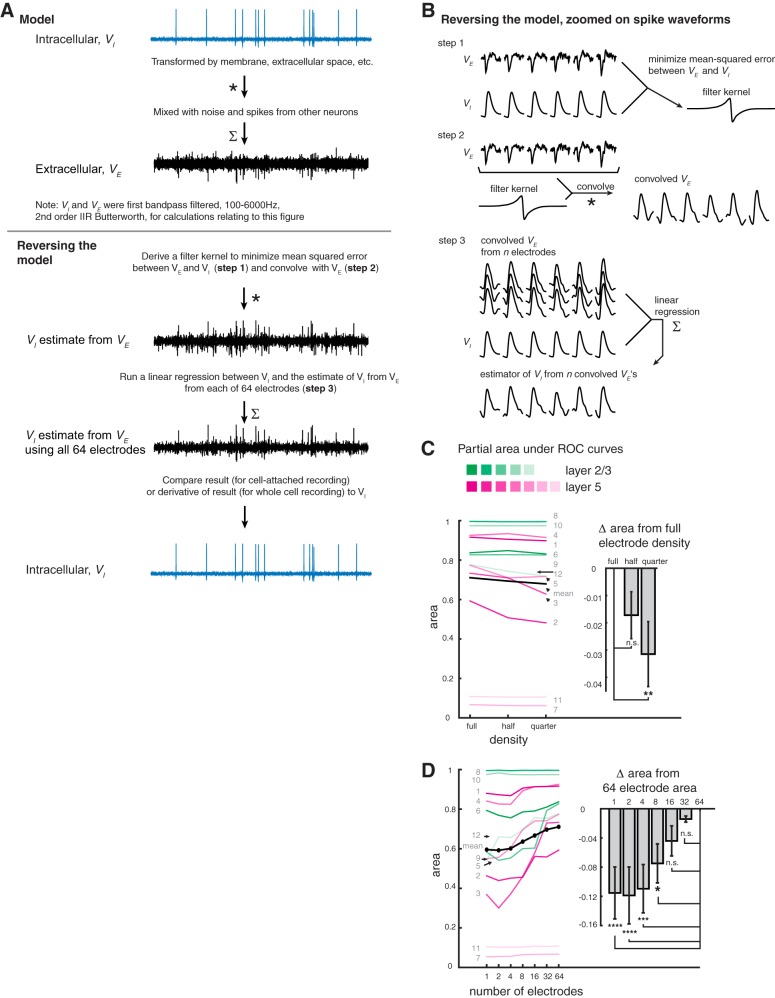
Much innovation is currently aimed at improving the number, density, and geometry of electrodes on extracellular multielectrode arrays for in vivo recording of neural activity in the mammalian brain. To choose a multielectrode array configuration for a given neuroscience purpose, or to reveal design principles of future multielectrode arrays, it would be useful to have a systematic way of evaluating the spike recording capability of such arrays. We describe an automated system that performs robotic patch-clamp recording of a neuron being simultaneously recorded via an extracellular multielectrode array. By recording a patch-clamp data set from a neuron while acquiring extracellular recordings from the same neuron, we can evaluate how well the extracellular multielectrode array captures the spiking information from that neuron. To demonstrate the utility of our system, we show that it can provide data from the mammalian cortex to evaluate how the spike sorting performance of a close-packed extracellular multielectrode array is affected by bursting, which alters the shape and amplitude of spikes in a train. We also introduce an algorithmic framework to help evaluate how the number of electrodes in a multielectrode array affects spike sorting, examining how adding more electrodes yields data that can be spike sorted more easily. Our automated methodology may thus help with the evaluation of new electrode designs and configurations, providing empirical guidance on the kinds of electrodes that will be optimal for different brain regions, cell types, and species, for improving the accuracy of spike sorting. NEW & NOTEWORTHY We present an automated strategy for evaluating the spike recording performance of an extracellular multielectrode array, by enabling simultaneous recording of a neuron with both such an array and with patch clamp. We use our robot and accompanying algorithms to evaluate the performance of multielectrode arrays on supporting spike sorting.

Keywords: action potential; bursting; multielectrode array; patch clamp; spike sorting.


Figures

Fig. 1.
Fig. 1.
A strategy for dual automated patch clamp and extracellular electrode array recordings in vivo. A: schematic of mouse cortical layers (gray dashed lines) with an electrode array inserted perpendicularly to the brain surface (from top right). A patch pipette targets a neuron (from top left) in either layer 2/3 or layer 5, with the goal of having the electrode array and patch pipette colocalized (i.e., recording activity of the same neuron). Curves emanating from pipette represent current emitted from the pipette for sensing on the electrode array. B: pipette tip-to-electrode array distance prediction from computational model. As the pipette is lowered toward the array (gold squares) in discrete 2-um steps, distance is estimated (red circles, with a green best-fit line across data points), shown for an exemplar recording (data in C–F also correspond to this recording). C: 20-Hz amplitude of a voltage pulse from the pipette as sensed across the electrode array (blue dots represent electrodes), and 1/r curve fit (surface plot). Electrode spacing on the array was 11 μm between adjacent electrode centers. D: amplitude (circles) and curve fit (solid lines), illustrated for a single column of the electrode array, as the pipette approaches the array in discrete 2-μm steps. E: goodness of fit for our 1/r model during each step as the pipette approaches the electrode array. F: at each step, a distance between the pipette tip and the electrode with the largest 20-Hz amplitude signal is approximated. Residual error to a best-fit line that estimates the 3-dimensional (3D) trajectory of the pipette tip in space is calculated post hoc (blue dots). G: position estimates, as in ­B, for 4 of the 16 recordings in which the model was used, illustrating varying “confidence” in the model. Number labels (#) correspond to recording number in H. Histology for the 2 recordings in which both the patched neuron was recovered (left) and the track from the electrode array was apparent (2nd from left) are shown, with biocytin-filled neuron in yellow (and DiI from the array in cyan for left experiment). Distances indicated between the neuron and the electrode array are 40 and 75 μm, respectively. H: mean, over all pipette steps, of residuals (top) and mean of R2 fits (bottom) for each of the 16 recordings in which the model was used.
Fig. 2.
Fig. 2.
Colocalized recordings: basic properties. A: voltage trace from a representative patched neuron recorded in the whole cell configuration (left), with a schematic of the patched neuron (blue) and other neurons (magenta, green, yellow) being sensed by an array of close-packed electrodes (gold; in our case, ~9 × 9–μm electrodes spaced ~2 μm apart; lines emanating from neurons representing signal propagation). Right: for each electrode in a 2-column, 64-electrode array, snapshots of bandpass-filtered (2nd-order infinite impulse response IIR Butterworth, 100–6,000 Hz) voltage are triggered off the timing of the peak of the derivative of the spikes of the patched neuron and then averaged. These patch-triggered mean extracellular spikes are displayed in the spatial configuration corresponding to the location of the electrodes in the array. In this analysis, a spike that occurs within 20 ms of another spike is considered to be within a burst (Staba et al. 2002), and later spikes in a burst (from the 2nd one onward) are not included in this average because their waveforms may differ significantly from that of nonburst spikes or the first spike in a burst (Henze et al. 2000). Electrodes that are shorted (i.e., impedance <300 kΩ) or open (i.e., impedance >2 MΩ) are shown in red. B: a representative trace from a patched neuron recorded in the cell-attached configuration (left) and patch-triggered mean extracellular spikes on 128 electrodes of a 4-column, 256-electrode array (right). Shorts and opens are shown in red. C: patch-triggered mean extracellular spikes from the 2n-th electrode among the list of amplitude-ordered electrodes (n = 0–6) from each of the 12 neurons, color-coded as indicated. Amplitude ordering means ranking good (i.e., nonshorted/open) electrodes by their patch-triggered mean extracellular spike amplitudes, from largest to smallest. Neurons are ordered by these aforementioned mean spike amplitudes so that neuron 1 has the greatest amplitude and neuron 12 has the smallest.
Fig. 3.
Fig. 3.
Evaluation of detection and classification of burst spikes via simple thresholding. A: voltage traces from a neuron in layer 5 of the primary visual cortex of an awake, head-fixed mouse (neuron 1 from Fig. 2C). This exemplar neuron had the largest mean extracellular spikes among all our recordings (n = 12 recordings from 7 mice). Top: 5 s of whole cell patch recording (current clamp) of spikes recorded during delivery of visual stimuli (see materials and methods). VI, intracellular voltage. 2nd from top: zoom-in to 500 ms of the top recording containing a burst, with spike number within a burst labeled with numbers and colors. A nonburst spike is labeled with a gray 0. The set of all spikes, for a given neuron, with a specific label (e.g., green 2) is referred to as a “burst spike group.” 2nd from bottom: the negative of the derivative (−I) of the trace immediately above. Bottom: the extracellular voltage (VE) trace (bandpass filtered, 2nd-order infinite impulse response Butterworth, 100–6,000 Hz) from 1 electrode of a colocalized, 256-electrode recording. This electrode exhibited the greatest mean extracellular spike amplitude and is referred to informally as the “closest electrode.” For use in computing partial receiver operating characteristic (PROC) curves later, we plot an example threshold as a gray dotted line (at −150 μV). B: spike amplitude vs. bursting state for the neuron in A. Bottom: spike amplitudes measured on the “closest electrode” (as in bottom trace in A) at the times of patch-clamp-measured spikes, labeled with colors/numbers as in A, plotted vs. time since the previous spike (on a log scale, with spikes of later burst spike groups plotted on top of those of earlier ones). Gray dotted line corresponds to the threshold plotted in A, bottom, and is used to define a particular point on the PROC curve in C. Each black arrow points from the mean (voltage, time) coordinate of a particular burst spike group to the mean of the next burst spike group. Inset: mean extracellular spikes for each burst spike group, color coded as in A, and overlaid (with later burst spike groups on top of earlier ones). Top: as at bottom, but for peaks of the negative of the derivative of the intracellularly measured spikes (as shown in A, 2nd from bottom). C: PROC curve (e.g., true positive rate vs. false positives divided by patch spikes, plotted as a threshold, such as indicated by gray lines in A and B, is systematically varied) for the “closest electrode” recording of the neuron in A. True positives (TPs) correspond to extracellular spikes with amplitude above the threshold and that occur within 1 ms of the times of patch-reported spike times, expressed as a fraction of the total number of patch spikes; false positives (FPs) correspond to the number of detected extracellular spikes that do not occur within 1 ms of a patch spike time, expressed as a ratio to the total number of patch spike times. Gray circle corresponds to the TP and FP values associated with the −150-μV threshold shown in A and B. We generated such curves when all spikes were considered (black line) as well as when bursting spikes (e.g., spikes that were preceded by another spike within 20 ms, in the patch-clamp recording) were eliminated (black dashed line). D: histogram of extracellular voltage deflections greater than the chosen noise floor of 2 times the median absolute deviation (MAD) across the entire recording, with nonburst (gray) and burst spikes (green) of the patched neuron as well as other deflections (yellow).
Fig. 4.
Fig. 4.
Characterization of bursting in cortical cell layers 2/3 and 5. A: partial areas under the partial receiver operating characteristic (PROC) curves (PAUC) for each of the 12 neurons, in the no-burst spikes vs. all spikes conditions, for layer 2/3 (green) and layer 5 neurons (magenta), as well as the mean across all 12 neurons from 7 mice (black). Neuron number, as in Fig. 2C, is shown in gray, and line darkness is determined by the amplitude ranking introduced in Fig. 2C (neurons are rank ordered within a cell layer, and the darkest shade represents the patched neuron with a highest mean spike amplitude on the closest electrode, with decreasing darkness as indicated for smaller spike amplitudes). Inset: PAUC difference (Δ area) between the all-spikes vs. nonburst conditions (mean across neurons; error bar is SE). *P = 0.0432, paired t-test (n = 12 neurons from 7 mice). B: mean amplitude of the intracellular spike derivative, normalized to mean nonburst amplitude for each neuron, in the no-burst spikes vs. all spikes conditions, for layer 2/3 (green) and layer 5 neurons (magenta), with neuron numbers as in A. Inset: normalized intracellular derivative of spike amplitude difference (Δ) between the all-spikes vs. nonburst conditions, for layer 2/3 vs. layer 5 neurons (mean across neurons in each cell layer; error bars are SE). *P = 0.0195, 2-sample t-test between layer 2/3 neurons (n = 5 neurons from 4 mice) and layer 5 neurons (n = 7 neurons from 5 mice). C: change in extracellular spike amplitude by spike number in burst. For each recording, mean extracellular amplitude (VE) is normalized to the mean amplitude of the first spike in the burst and plotted for burst spike numbers 1–6. Values are only plotted if there were at least 5 spikes at that burst number. Errors bars are SD, shifted slightly along the x-axis for better visibility. As in B, layer 2/3 neurons are shown in green and layer 5 neurons in magenta. D–F: as in Fig. 3, A, B, and D, but for a representative (in terms of extracellular spike amplitude) neuron in cortical layer 2/3 of an anesthetized (0.5–1.2% isoflurane) mouse (neuron 6 from Fig. 2C). VI, intracellular voltage; −I, negative derivative of intracellular voltage; 6MAD, 6 times median absolute deviation. G–I: as in C–E, but for a representative cortical layer 5 neuron (neuron 7).
Fig. 5.
Fig. 5.
An algorithm for assessing potential spike sorting performance as a function of electrode density and quantity. A, top: a model in which the intracellular voltage (VI) is transformed by membrane capacitance and resistance, conductance delays, etc., and mixed with noise and spikes from other neurons to produce an extracellular voltage (VE) as sensed on an electrode. Bottom: reversal of the model in A, in which the VE is transformed to better resemble the VI and is unmixed from noise and spikes of other neurons to better approximate VI. Unmixing is performed by linearly regressing the transformed VE against the VI. B: details of the inverted model, zoomed on individual spike waveforms. Top: step 1, a transformation that minimizes the mean squared error between the VE from a single electrode (we will consider each individual electrode in turn) and calculates VI, yielding a filter kernel (shown are 6 spikes from an actual recording for ease of visualization.) Middle: step 2, the VE from the same electrode used in step 1 is convolved with its corresponding convolution filter kernel to create the “convolved VE.” Bottom: step 3, electrodes are ordered by amplitude, as described for Fig. 2C, and the electrodes to be included in the analysis [i.e., 64, 32, or 16 electrodes (full, half, and quarter density, respectively) for C or the first N electrodes for D) are chosen. Steps 1 (top) and 2 (middle) are applied to the voltage of each of these chosen electrodes, and a multiple linear regression is performed between these convolved VEs and the bandpass-filtered patch voltage. The resulting regression coefficients are multiplied by their respective convolved VEs and summed, yielding a single estimator of patch voltage from VEs (step 3, bottom). C: partial areas under the curve (PAUC) for partial receiver operating characteristic s (PROCs) from each neuron, as in Fig. 4A, but thresholding on the derivative of the estimator of patch voltage. Inset: comparison of scenarios when the estimator of patch voltage was generated from the top 64 amplitude-ordered electrodes in a recording as a full set (full density), when every 2nd electrode was skipped (i.e., the 1st, 3rd, 5th, etc., electrodes were included for a total of 32 electrodes; half density), or when 4 electrodes at a time were skipped (i.e., the 1st, 5th, 9th, etc., electrodes were included for a total of 16 electrodes; quarter density). These results and the results in D were generated when all spikes of the patched neuron were included (i.e., not excluding burst spikes). A significant effect of electrode density was observed (repeated-measures one-way ANOVA, F = 5.656, P = 0.0104, n = 12 neurons from 7 mice). The mean PAUC of the full-density group was significantly greater from that of the quarter-density group (mean of full-density area minus mean of quarter-density area, or “mean difference” was 0.03148; Dunnett’s multiple comparisons test, with corrected **P = 0.0054), but not that of the half-density group [mean difference = 0.01722, P = 0.1401, n.s. (not significant, P > 0.05)]. D, left: PAUC values derived from the derivative of the estimator of patch voltage generated from the top N amplitude-ordered electrodes in a recording (individual neurons colored as in C, mean in black). Inset: PAUC differences from the 64-electrode group (light gray, with error bars representing SE of the difference). A significant effect of number of electrodes was observed (repeated-measures one-way ANOVA, F = 8.364, P < 0.0001, n = 12 neurons from 7 mice). The mean PAUC for 64 electrodes was compared with that for N = 32, 16, 8, 4, 2, and 1 electrode(s). The mean differences from subtracting the 2 values, and the P values, are as follows: 0.01407 and 0.9817 (N = 32 electrodes; n.s.), 0.04402 and 0.28332 (N = 16; n.s.), 0.07483 and 0.0149 (N = 8; *P 0.01–0.05), 0.1095 and 0.0002 (N = 4; ***P = 0.0001–0.001), 0.1187 and 0.0001 (N = 2; ****P ≤ 0.0001), and 0.1153 and 0.0001 (N = 1; ****P ≤ 0.001; Dunnett’s multiple comparisons test).

References

    1. Anastassiou CA, Perin R, Buzsáki G, Markram H, Koch C. Cell type- and activity-dependent extracellular correlates of intracellular spiking. J Neurophysiol 114: 608–623, 2015. doi: 10.1152/jn.00628.2014. - DOI - PMC - PubMed
    1. Ballini M, Müller J, Livi P, Chen Y, Frey U, Stettler A, Shadmani A, Viswam V, Jones IL, Jäckel D, Radivojevic M, Lewandowska MK, Gong W, Fiscella M, Bakkum DJ, Heer F, Hierlemann A. A 1024-channel CMOS microelectrode array with 26,400 electrodes for recording and stimulation of electrogenic cells in vitro. IEEE J Solid-State Circuits 49: 2705–2719, 2014. doi: 10.1109/JSSC.2014.2359219. - DOI - PMC - PubMed
    1. Berényi A, Somogyvári Z, Nagy AJ, Roux L, Long JD, Fujisawa S, Stark E, Leonardo A, Harris TD, Buzsáki G. Large-scale, high-density (up to 512 channels) recording of local circuits in behaving animals. J Neurophysiol 111: 1132–1149, 2014. doi: 10.1152/jn.00785.2013. - DOI - PMC - PubMed
    1. Blanche TJ, Spacek MA, Hetke JF, Swindale NV. Polytrodes: high-density silicon electrode arrays for large-scale multiunit recording. J Neurophysiol 93: 2987–3000, 2005. doi: 10.1152/jn.01023.2004. - DOI - PubMed
    1. Buzsáki G. Large-scale recording of neuronal ensembles. Nat Neurosci 7: 446–451, 2004. doi: 10.1038/nn1233. - DOI - PubMed

Publication types

LinkOut - more resources