. 2018 Jul;559(7715):580-584.
doi: 10.1038/s41586-018-0331-8. Epub 2018 Jul 11.

Cryo-EM structures of fungal and metazoan mitochondrial calcium uniporters

Affiliations

Cryo-EM structures of fungal and metazoan mitochondrial calcium uniporters

Rozbeh Baradaran et al. Nature. 2018 Jul.

Abstract

The mitochondrial calcium uniporter (MCU) is a highly selective calcium channel and a major route of calcium entry into mitochondria. How the channel catalyses ion permeation and achieves ion selectivity are not well understood, partly because MCU is thought to have a distinct architecture in comparison to other cellular channels. Here we report cryo-electron microscopy reconstructions of MCU channels from zebrafish and Cyphellophora europaea at 8.5 Å and 3.2 Å resolutions, respectively. In contrast to a previous report of pentameric stoichiometry for MCU, both channels are tetramers. The atomic model of C. europaea MCU shows that a conserved WDXXEP signature sequence forms the selectivity filter, in which calcium ions are arranged in single file. Coiled-coil legs connect the pore to N-terminal domains in the mitochondrial matrix. In C. europaea MCU, the N-terminal domains assemble as a dimer of dimers; in zebrafish MCU, they form an asymmetric crescent. The structures define principles that underlie ion permeation and calcium selectivity in this unusual channel.


Figures

Extended Data Fig. 1 |
Extended Data Fig. 1 |. Structure-based sequence alignment.
The amino acid sequences of the C. europaea, Pyronema omphalodes, D. discoideum, C. elegans, zebrafish (D. rerio) and human MCU are aligned and coloured according to the ClustalW convention (UniProt accession numbers: W2SDE2, U4LFM6, Q54LT0, Q21121, Q08BI9 and Q8NE86, respectively). The secondary structure is indicated with ribbons representing α-helices, solid lines representing structured loop regions, and dashed lines representing disordered regions. The WDXXEP signature sequence is highlighted with a red line. The amino acids drawn as sticks in Fig. 5c that face the vestibule are: Ile198, Ala199, Gly202, Leu206 and Tyr209 from TM1 and Tyr232, Gly235, Leu236, Thr238, Leu239, Tyr243, and Phe246 from TM2; the corresponding amino acids in human MCU are: Val235, Leu236, Gly239, Met243, Gln246, Tyr268, Thr271, Tyr272, Ser274, Ala275, Tyr279 and Phe282, respectively. Basic residues at the matrix boundary of the membrane (for example, Arg193, Arg197, and Arg251 of CeMCU) may interact with phospholipid headgroups.
Extended Data Fig. 2 |
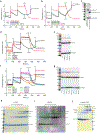
Extended Data Fig. 2 |. Functional analysis of MCU.
a, b, Representative Ca2+ uptake experiments using digitonin-permeabilized MCU/EMRE knockout cells without transfection (red line), or expressing zebrafish MCU and EMRE (black line), or expressing zebrafish MCUΔNTD and EMRE (grey line). Blue arrows indicate additions of 5 μM CaCl2. A decrease in fluorescence following addition of Ca2+ is indicative of Ca2+ uptake (for example, black and grey traces). Ruthenium red (RuRed), a proton ionophore (CCCP), or a Ca2+ ionophore (ETH129) were added as controls towards the end of each experiment as indicated. RuRed prevents Ca2+ uptake, ETH129 demonstrates that the mitochondria are intact, and CCCP demonstrates that Ca2+ uptake is dependent upon the proton gradient. Analogous experiments were repeated six times with similar results. c, Rho-1D4 western blot analysis of the cell lysates from a, demonstrating expression of MCU and EMRE, which were C-terminally tagged with a 1D4 peptide (see Methods). Repeated twice with similar results. d, f, Representative mitochondrial Ca2+ uptake experiments using MCU/EMRE knockout cells for the indicated mutations of human MCU when co-transfected with EMRE (from which the data shown in Fig. 4d are derived, see Methods). Independent experiments were repeated with similar results: n = 8 for wild type, n = 9 for M263A, and n = 3 for the remainder of the mutants. e, g, Full-size western blots of the cell lysates from d and f showing protein expression levels (corresponding to Fig. 4d; detected using a Rho-1D4 antibody). Repeated twice with similar results. h, i, Subunit stoichiometry analysis of MCU proteins using crosslinking. h, Crosslinking of purified CeMCU in the detergent n-dodecyl-β-d-maltoside (DDM). Indicated concentrations of the crosslinker bis(sulfosuccinimidyl) suberate (BS-3) were incubated with purified CeMCU. Analysis is by SDS–PAGE and coomassie stain. Molecular weight standards are located in the first lane and their positions indicated. The calculated molecular weight of CeMCU is 39.6 kDa based upon its amino acid sequence. Repeated three times with similar results. i, Crosslinking of HsMCU expressed in HEK293 membranes. Indicated concentrations of the membrane-permeable crosslinker disuccinimidyl glutarate (DSG) were used and HsMCU was detected by western blot using a C-terminal Rho-1D4 antibody tag (Methods). Molecular weight standards are located in the first lane and their positions indicated. We note that some oligomerization of human MCU was observed without crosslinker; this phenomenon has been observed previously for human MCU. Repeated four times with similar results. j, Crosslinking of purified zebrafish MCU in the detergent digitonin. Indicated concentrations of BS-3 crosslinker were used. Samples were analysed by SDS–PAGE using coomassie stain. Molecular weight standards are located in the last lane and their positions are indicated. Asterisks indicate protein impurities. Repeated twice with similar results.
Extended Data Fig. 3 |
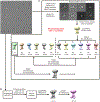
Extended Data Fig. 3 |. Flowchart for cryo-EM data processing of CeMCU.
Details can be found in the Methods.
Extended Data Fig. 4 |
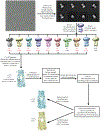
Extended Data Fig. 4 |. Flowchart for cryo-EM data processing of zebrafish MCU.
a, Initial model generation and improvement. b, 3D refinement using the improved initial model from a. Details can be found in the Methods.
Extended Data Fig. 5 |
Extended Data Fig. 5 |. Cryo-EM reconstruction of zebrafish MCU.
a, Orthogonal slices (top) and orthogonal 2D projections (bottom) of the final 3D reconstruction (from cisTEM). b, Angular orientation distribution of the particles used in the final reconstruction. The particle distribution is indicated by different colour shades. c, Gold-standard FSC curve of the final 3D reconstruction. The resolution is ~8.5 Å at the FSC cutoff of 0.143. A thin vertical line indicates that only spatial frequencies to 1/(15 Å) were used to determine particle alignment parameters during refinement in cisTEM.
Extended Data Fig. 6 |
Extended Data Fig. 6 |. Cryo-EM structure determination and density of CeMCU.
a, Orthogonal slices (top) and orthogonal 2D projections (bottom) of the final 3D reconstruction (from cisTEM). b, Angular orientation distribution of the particles used in final reconstruction. The particle distribution is indicated by different colour shades. c, Gold-standard FSC curve of the final 3D reconstruction. The resolution is ~3.2 Å at the FSC cutoff of 0.143. A thin vertical line indicates that only spatial frequencies to 1/(7 Å) were used to determine particle alignment parameters during refinement. d, Local resolution of the map estimated using the blocres program and coloured as indicated. e, Model validation. Comparison of the FSC curves between model and half map 1 (work), model and half map 2 (free), and model and full map are plotted in green, red and blue, respectively. fi, Densities (8σ contours) of α-helical regions of CeMCU are shown in the context of the atomic model with side chains shown as sticks and the backbone as ribbons. j, Stereo representation of the density (8σ contour) of the NTDs, with the interface between chains A and B in the foreground.
Extended Data Fig. 7 |
Extended Data Fig. 7 |. Structure of CeMCU.
a, Ribbon representation of an isolated subunit from Fig. 1c, viewed parallel to the membrane, with the structural features labelled. Disordered regions connecting TM2 and α6 are indicated as dashed lines. b, c, IMS and matrix views of Fig. 1c. d, e, Molecular surface coloured according to electrostatic potential (red, −8 kT e−1; white, neutral; blue, +8 kT e−1). d, Shown in the same orientation as Fig. 1c with approximate membrane boundaries as grey bars. e, IMS view. A green sphere indicates the position of Ca2+ in site 1. f, Overall structure of CeMCU, depicted similarly to Fig. 1. g, Subunit interactions within the TMD. Ribbon representations of TM1 and TM2 from one subunit (green) and TM2 of the neighbouring subunit (red) are shown. Residues participating in van der Waals or hydrogen bonding interactions are shown as sticks; dashed lines indicate hydrogen bonds. Atom colouring: nitrogen, blue; oxygen, red; and sulfur, green. h, Interfaces within the NTDs. The NTDs of subunit A, B and C (green, red and yellow, respectively) are shown in ribbon and surface representations. Each NTD contains six β-strands (β1 through β6) and two α-helices (α1 and α2). There are four interfaces between the NTDs, and these are of two types. Interface 1 (for example, between protomers A and B or C and D in the atomic model) consists of an interaction between β3 of one NTD and the β1–β2 loop of another; this interface buries 2,188 Å of molecular surface in the assembled channel. Interface 2 (for example, between protomers A and D or B and C) is less extensive, burying 1,440 Å total surface area, and involves contacts located near the N-terminal ends of the α1 helices from two NTDs. i, j, Details of interfaces 1 and 2 between NTDs, respectively.
Extended Data Fig. 8 |
Extended Data Fig. 8 |. Comparison with an NMR structure (PDB: 5ID3).
Left, various representations of the cryo-EM structure of CeMCU. The NTD, TM1ext, TM1, TM2 and coiled-coil regions are shown in different colours. Right, structure deduced from NMR studies of C. elegans MCU-ΔNTD (PDB: 5ID3). It is coloured according to the cryo-EM structure using the sequence alignment shown in Extended Data Fig. 1. The boxed regions highlight differences in vicinity of the WDXXEP signature sequence and pore. Pore-lining residues (D225, E228, T231 and Y232; C. europaea numbering) are shown as sticks.
Extended Data Fig. 9 |
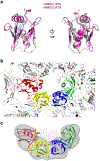
Extended Data Fig. 9 |. Structural comparison of the NTDs of CeMCU, zebrafish MCU and human MCU.
a, An NTD from the cryo-EM structure of CeMCU (red) is superimposed with the crystal structure of an isolated NTD from human MCU (grey, PDB: 5KUG, r.m.s.d. = 2.0 Å). The secondary structure features are indicated; two views are shown. b, Crystal lattice from an X-ray structure of an isolated NTD of human MCU (PDB: 4XTB). Four neighbouring NTDs are coloured and other NTDs are grey. A similar arrangement is present in PDB 5KUG. c. Matrix view of the cryo-EM reconstruction of zebrafish MCU (from Fig. 2d).
Fig. 1 |
Fig. 1 |. Cryo-EM map and overall structure of CeMCU.
a, Slices of a 3D reconstruction generated without imposing symmetry (Extended Data Fig. 3). b, Final 3D reconstruction viewed parallel to the membrane (8σ contour level). Density for the detergent micelle is present at lower contours (for example, Extended Data Fig. 3). Subunits are coloured uniquely. c, Ribbon representation in the same orientation as b, with approximate membrane boundaries as grey bars. IMS, intermembrane space. Disordered regions connecting TM2 and α6 are indicated as dashed lines.
Fig. 2 |
Fig. 2 |. Cryo-EM reconstruction of zebrafish MCU.
a, 2D slices of the 3D reconstruction of zebrafish MCU are shown at the indicated positions. b, Two orthogonal views of the 3D reconstruction viewed parallel to the membrane. Grey bars indicate approximate membrane boundaries. Density attributed to the detergent micelle surrounding the TMD is indicated. c, Matrix view, showing density for four NTDs. The TMD region is removed for clarity. d, Atomic models (PDB: 4XTB) of four NTDs are fit into the density from c (mesh).
Fig. 3 |
Fig. 3 |. Ion pore.
Within a ribbon representation of two subunits of CeMCU is a representation (grey surface) of the minimal radial distance from the centre of the pore to the nearest van der Waals protein contact. Selected amino acids are shown as sticks.
Fig. 4 |
Fig. 4 |. Selectivity filter.
a, Density within the selectivity filter region of CeMCU. The map is contoured at 8σ (blue mesh) and 20σ (magenta mesh) and shown in the context of two TM2 helices (sticks; other regions are omitted for clarity). Green spheres indicate Ca2+ ions in sites 1 and 2; a grey sphere indicates site 3. b, Side view of the selectivity filter region, showing two subunits as ribbons and the WDXXEP signature sequence as sticks. Dashed lines indicate hydrogen bonds and Ca2+ coordination. c, Close up of site 2, oriented approximately 60° from the plane of the membrane, showing all four subunits. d, Mitochondrial Ca2+ uptake by indicated mutants of human MCU relative to wild type (WT) when co-expressed with EMRE (mean ± s.d., independent experiments: n = 8 for wild type, n = 9 for M263A, and n = 3 for the remainder, Extended Data Fig. 2d–g). Western blots demonstrate expression. −ve, untransfected cells.
Fig. 5 |
Fig. 5 |. Membrane interactions.
a, Ordered lipids within the transmembrane region. Density (blue mesh, 8σ contour) is ascribed to a lipid of the outer leaflet and an acyl chain within the lateral membrane openings (fenestrations). The partially transparent molecular surface (grey) reveals a ribbon representation of the channel, in which each subunit is coloured uniquely. b, Close-up view, orthogonal to a, from within the matrix, showing the acyl chain density (site 3 is a green sphere). c, The vestibule is hydrophobic. A slice of the molecular surface shown from a (the portion facing the viewer is removed) is coloured according to electrostatic potential: light grey regions are neutral; red, −8 kT e−1; blue, +8 kT e−1. Green spheres indicate sites 1–3. One subunit is shown as yellow ribbons with amino acids facing the vestibule drawn as sticks.

References

    1. Deluca HF & Engstrom GW Calcium uptake by rat kidney mitochondria. Proc. Natl Acad. Sci. USA 47, 1744–1750 (1961). - PMC - PubMed
    1. Montero M et al. Chromaffin-cell stimulation triggers fast millimolar mitochondrial Ca2+ transients that modulate secretion. Nat. Cell Biol 2, 57–61 (2000). - PubMed
    1. Baughman JM et al. Integrative genomics identifies MCU as an essential component of the mitochondrial calcium uniporter. Nature 476, 341–345 (2011). - PMC - PubMed
    1. De Stefani D, Raffaello A, Teardo E, Szabò I & Rizzuto R A forty-kilodalton protein of the inner membrane is the mitochondrial calcium uniporter. Nature 476, 336–340 (2011). - PMC - PubMed
    1. Chaudhuri D, Sancak Y, Mootha VK & Clapham DE MCU encodes the pore conducting mitochondrial calcium currents. eLife 2, e00704 (2013). - PMC - PubMed

Publication types