. 2018 Jul;559(7714):415-418.
doi: 10.1038/s41586-018-0319-4. Epub 2018 Jul 11.

Resistance-gene-directed discovery of a natural-product herbicide with a new mode of action

Affiliations

Resistance-gene-directed discovery of a natural-product herbicide with a new mode of action

Yan Yan et al. Nature. 2018 Jul.

Abstract

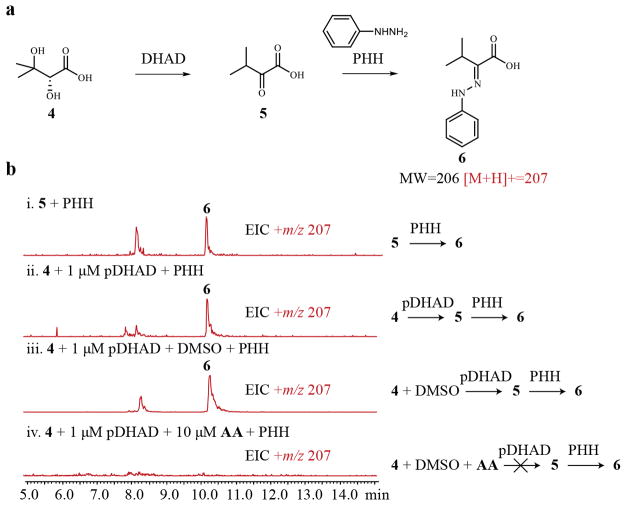
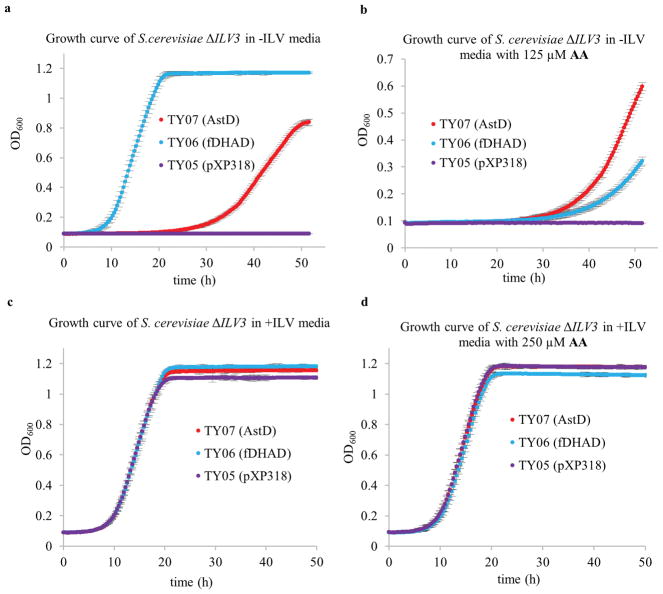
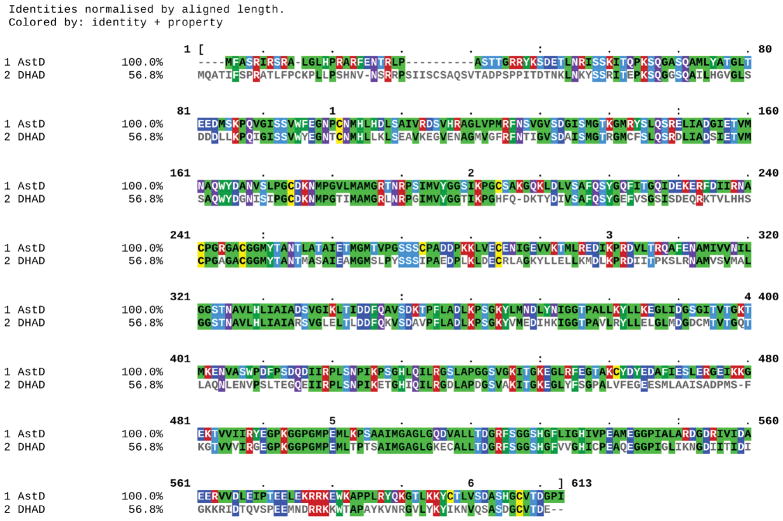
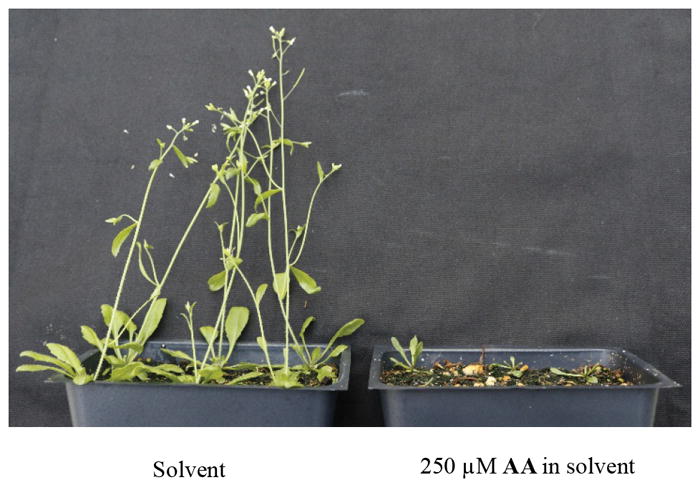
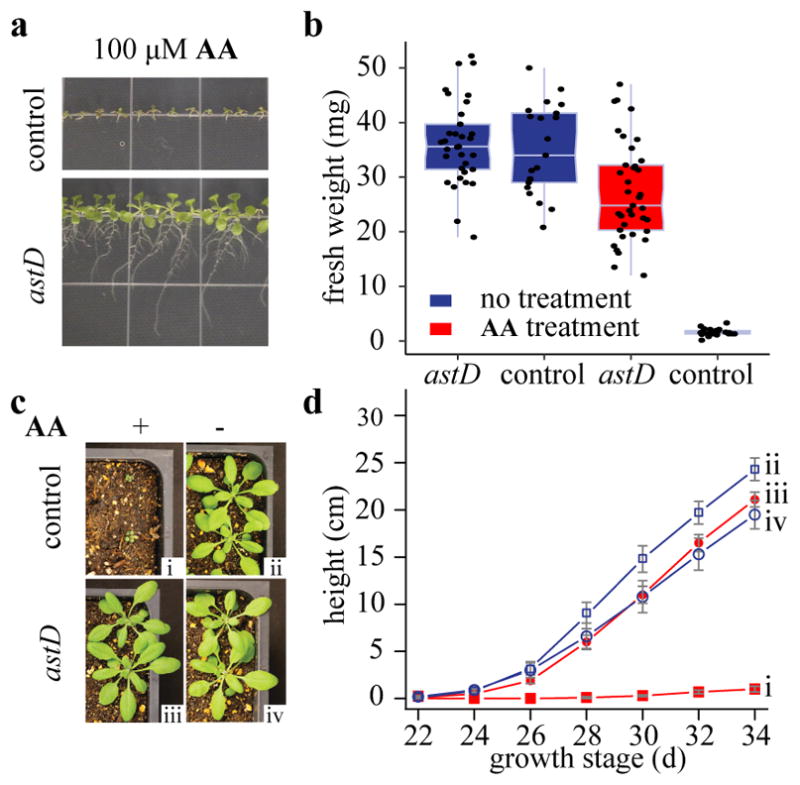
Bioactive natural products have evolved to inhibit specific cellular targets and have served as lead molecules for health and agricultural applications for the past century1-3. The post-genomics era has brought a renaissance in the discovery of natural products using synthetic-biology tools4-6. However, compared to traditional bioactivity-guided approaches, genome mining of natural products with specific and potent biological activities remains challenging4. Here we present the discovery and validation of a potent herbicide that targets a critical metabolic enzyme that is required for plant survival. Our approach is based on the co-clustering of a self-resistance gene in the natural-product biosynthesis gene cluster7-9, which provides insight into the potential biological activity of the encoded compound. We targeted dihydroxy-acid dehydratase in the branched-chain amino acid biosynthetic pathway in plants; the last step in this pathway is often targeted for herbicide development10. We show that the fungal sesquiterpenoid aspterric acid, which was discovered using the method described above, is a sub-micromolar inhibitor of dihydroxy-acid dehydratase that is effective as a herbicide in spray applications. The self-resistance gene astD was validated to be insensitive to aspterric acid and was deployed as a transgene in the establishment of plants that are resistant to aspterric acid. This herbicide-resistance gene combination complements the urgent ongoing efforts to overcome weed resistance11. Our discovery demonstrates the potential of using a resistance-gene-directed approach in the discovery of bioactive natural products.


Figures

Extended Data Figure 1
Extended Data Figure 1. The rationale of resistance-gene directed discovery of a natural herbicide with new mode of action
a, Phylogenetic tree of DHAD among bacteria, fungi and plants. The evolutionary history was inferred by using the Neighbor-Joining method (MEGA7). Units represent the number of amino acid substitutions per site. b, Representatives of small molecules that inhibit DHAD in vitro, but fail to inhibit plant growth. c, Examples of co-localization of biosynthetic gene clusters (BGCs) and targets. The biosynthetic core genes are shown in blue and the self-resistance enzymes (SREs) are shown in red. The blockbuster cholesterol-lowering lovastatin drug targets HMG-CoA reductase (HMGR) in eukaryotes. In the fungus Aspergillus terreus that produces lovastatin, a second copy of HMGR encoded by ORF8 is present in the gene cluster (top). BGC of the immunosuppressant mycophenolic acid from Penicillium sp. contains a second copy of inosine monophosphate dehydrogenase (IMPDH), which represents the SRE to this cluster (bottom).
Extended Data Figure 2
Extended Data Figure 2. Biochemical assays of DHAD functions
a, Assaying DHAD activities in converting the dihydroxyacid 4 into the α-ketoacid 5. Formation of 5 can be detected on HPLC by chemical derivatization using phenylhydrazine (PHH) to yield 6. b, LC-MS traces of the biochemical assays of A. thaliana DHAD (pDHAD). Extracted ion chromatogram (EIC) of positive ion mass of [M+H]+=207 is shown in red. i. The derivatization reaction was validated by using the authentic 5. ii. The bioactivity of pDHAD in converting 4 into 5 was validated. iii. Addition of DMSO to pDHAD enzymatic reaction mixture has no effect. iv. Addition of 10 μM AA to the reaction mixture abolished pDHAD activity. The experiments were repeated independently for 3 times with similar results.
Extended Data Figure 3
Extended Data Figure 3. Inhibition assay of different DHADs using AA
Three DHAD enzymes were assayed, including pDHAD (plant DHAD from A. thaliana), fDHAD (fungal housekeeping DHAD from A. terreus) and AstD (DHAD homolog within ast cluster). IC50 and Ki values of AA were measured based on inhibition percentage at different AA concentrations. Center values are averages, errors bars are s.d.; n = 3 biologically independent experiments. a, Plot of the inhibition percentage of 0.5 μM fDHAD as a function of AA concentration. b, Plot of the inhibition percentage of 0.5 μM pDHAD as a function of AA concentration. c, Plot of the inhibition percentage of 0.5 μM AstD as a function of AA concentration. d, Analysis of inhibitory kinetics of AA on pDHAD using the Lineweaver-Burk method at different concentrations of AA (left). Linear fitting of apparent Michaelis constant (KM,app) as a function of AA concentration yields the inhibition constant (Ki) of AA on pDHAD (right).
Extended Data Figure 4
Extended Data Figure 4. Growth curve of S. cerevisiae ΔILV3 expressing AstD and fDHAD
The genome copy of DHAD encoded by ILV3 was first deleted from Saccharomyces cerevisiae strain DHY ΔURA3 to give UB02. UB02 was then either chemically complemented by growth on ILV (leucine, isoleucine and valine)-containing media or genetically by expressing of fDHAD or AstD episomally (TY06 or TY07, respectively). The empty vector pXP318 was also transformed into UB02 to generate a control strain TY05. The optical density of cell growth under different conditions were plotted as a function of time. Center values are averages, errors bars are s.d.; n = 3 biologically independent experiments. a, Growth curve in ILV dropout media with no AA. b, Growth curve in ILV dropout media with 125 μM AA. c, Growth curve in ILV supplemented media; d, Growth curve in ILV supplemented media with 250 μM AA.
Extended Data Figure 5
Extended Data Figure 5. X-ray Structure of holo-pDHAD and homology model of AstD
a, Superimpositions monomer of holo-pDHAD (PDB: 5ZE4, 2.11 Å) and RlArDHT (PDB: 5J84). The holo structure containing the 2Fe-2S cofactor and Mg2+ ion in the active site. The structure of holo-pDHAD is in white; the crystal structure of RlArDHT is in cyan. b, Superimpositions of holo-pDHAD and homology modeled AstD. The structure of AstD was constructed by homology modeling based on the structure of holo-pDHAD. The structure of holo-pDHAD is in white; the crystal structure of AstD is in green. c, The electron density map of cofactors in the holo structure of pDHAD. White grid: 2Fo-Fc map at 1.2 σ level. Green grid: Fo-Fc positive map at 3.2σ level. Cyan sticks: acetic acid molecule. d, Comparison of the active sites in the crystal structure of pDHAD and the modeled structure of AstD. The cartoon represents superimposed binding sites of pDHAD (white) and AstD (green). The shift of a loop in AstD, where L518 (correspond to V496 in pDHAD) is located, coupled with a larger L198 residue (correspond to I177 in pDHAD) lead to a smaller hydrophobic pocket of AstD than that in pDHAD. e, The surface of binding sites of AstD (left) and pDHAD (right). The smaller hydrophobic channel in modeled AstD cannot accommodate the AA molecule (yellow balls-and-sticks).
Extended Data Figure 6
Extended Data Figure 6. Sequence alignment between pDHAD and AstD
The sequence identity between pDHAD and AstD is 56.8%, whereas the similarity between them is 75.0%. Residues were colored according to their property and similarity.
Extended Data Figure 7
Extended Data Figure 7. Spray assay of AA on A. thaliana
Glufosinate resistant A. thaliana was treated with (right) or without (left) AA in the solvent, which is a commercial glufosinate based herbicide marketed as Finale®. To improve the wetting and penetration, AA was firstly dissolved in ethanol and then added to solvent (0.06 g/L Finale® Bayer Inc. + 20 g/L ethanol) to make 250 μM AA spraying solution. The control plants were treated with solvent containing ethanol only. Spraying treatments began upon the seeds germination, and were repeated once every two days with approximately 0.4 mL AA solution per time per pot for 4 weeks. The picture shown below is taken after one month of treatment. The application rate of AA is approximately 1.6 lb/acre, which is comparable to the commonly used herbicide glyphosate (0.75~1.5 lb/acre). The experiments were repeated independently for 3 times with similar results.
Extended Data Figure 8
Extended Data Figure 8. Specific inhibition of anther development in A. thaliana
Comparison of flower organs between the AA treated (a–c) and non-treated (d–f) Arabidopsis. a compare to d, the AA treated flower shows abnormal pistil elongation due to the lack of pollination. b compare to e, the AA treated flower is missing one stamen. c compare to f, the AA treated anther is depleted of healthy and mature pollen. The experiments were performed twice with similar results.
Extended Data Figure 9
Extended Data Figure 9. Schematic illustration of results from the cross experiment
a, Wild type A. thaliana treated with 250 μM AA was pollinated with pollen from the un-treated plant that carries the glufosinate resistant gene. Offspring was obtained, and inherited the glufosinate resistance from the pollen donor. b, similar as in a, except that the pollen donor was also treated with 250 μM AA. No offspring was obtained from this cross. Similar results were obtained with the treatment of AA at 100 μM.
Fig. 1
Fig. 1
Genome mining of a DHAD inhibitor and biosynthesis of aspterric acid (AA). a, Valine, leucine and isoleucine are produced by two parallel pathways using three enzymatic steps: ALS, KARI, and DHAD. b, A 17 kb gene cluster from A. terreus containing four ORFs, which are also conserved among several fungal species. AstA has sequence homology to sesquiterpene cyclase; AstB and AstC are predicted to be P450 monooxygenases; astD is predicted to encode a DHAD, and is proposed to confer self-resistance in the presence of the NP produced in the cluster. c, HPLC-MS traces of metabolites produced from S. cerevisiae RC01 expressing different ast genes under PADH2 promoter control. i: S. cerevisiae without expression plasmids. ii: S. cerevisiae transformed with plasmids expressing astA and astB produces 2. iii: S. cerevisiae transformed with plasmids expressing astA-C produces AA at a titer of 20 mg/L. The experiments were repeated independently with similar results for 3 times. d, Proposed biosynthetic pathway of AA. AstA cyclizes farnesyl diphosphate (FPP) into (−)-daucane 1, while the P450 enzymes AstB and AstC sequentially transform 1 into 2 and 3 (AA), respectively.
Fig. 2
Fig. 2. Aspterric acid (AA) is a plant growth inhibitor
a, 2-week old Arabidopsis thaliana growing on MS media containing no AA (left) or 50 μM AA (right). The picture shown is representative of 3 replicates. b, Same as in a, except for 2-week old dicot Solanum lycopersicum and monocot Zea mays. The picture shown is representative of 2 replicates. c, Verification of the self-resistance function of AstD. Growth inhibition curve of AA on S. cerevisiae ΔILV3 strains expressing fungal housekeeping fDHAD (blue) or AstD (red) in isoleucine, leucine and valine (ILV) dropout media. The plot shows mean values ± s.d. (error bars); n = 3 biologically independent experiments. d, Crystal structure of the dimeric holo A. thaliana DHAD (pDHAD) containing the cofactor 2Fe-2S cluster and a Mg2+ ion with the docked AA in the active site. One of the pDHAD monomers is show in cyan, whereas the other one is shown in electrostatic surface representation. The docked AA is shown in the inset in spaced-filled model. The hydrophobic portions of AA are surrounded by several hydrophobic residues (white spheres) from both monomers. e, Cross-section electrostatic map of modeled holo-pDHAD in the binding site. Red map: the normalized negatively charged regions; blue map: the normalized positively charged regions; white map: the hydrophobic regions. The docked AA in the active site of pDHAD is shown on the left, while the docked native substrate dihydroxyisovalerate is shown on the right. The docking studies suggest the hydrophobic entrance to the reaction chamber preferentially binds the bulkier, tricyclic AA.
Fig. 3
Fig. 3
AA-resistance of Arabidopsis plants expressing astD transgenes. a, Phenotype of 10-day old A. thaliana with (lower) and without (upper) astD transgene growing on media containing 100 μM AA. Control plants were transformed with a vector that carries the glufosinate ammonium selection marker but no astD transgene. The picture shown is representative of 3 replicates. b, Fresh weight of 3-week old Arabidopsis seedlings growing on media with (red box) and without (blue box) 100 μM AA; Box plots show the median and extend of the 1st to 3rd quartile range, with individual data points overlaid; n = 21 biologically independent experiments. c, glufosinate-resistant Arabidopsis with (lower) and without (upper) astD transgene growing in soil were sprayed with glufosinate ammonium with (left) and without (right) 250 μM AA. i. control sprayed with 250 μM AA + glufosinate ammonium. ii. control sprayed with glufosinate ammonium only. iii. astD transgenic Arabidopsis sprayed with 250 μM AA + glufosinate ammonium. iv. astD transgenic Arabidopsis sprayed with glufosinate ammonium only. The picture shown is representative of 3 replicates. d, Quantification of the height of Arabidopsis treated the same as in c; The plot shows mean values ± s.d. (error bars); n = 12 biologically independent experiments.

Comment in

  • New routes to kill weeds.
    Lei L. Lei L. Nat Plants. 2018 Aug;4(8):509. doi: 10.1038/s41477-018-0227-5. Nat Plants. 2018. PMID: 30076397 No abstract available.

References

    1. Dayan FE, Duke SO. Natural compounds as next generation herbicides. Plant Physiol. 2014;166:1090–1105. - PMC - PubMed
    1. Newman DJ, Cragg GM. Natural products as sources of new drugs from 1981 to 2014. J Nat Prod. 2016;79:629–661. - PubMed
    1. Jon C, Christopher W. Lessons from natural molecules. Nature. 2004;432:829–837. - PubMed
    1. Ziemert N, Alanjary M, Weber T. The evolution of genome mining in microbes - a review. Nat Prod Rep. 2016;33:988–1005. - PubMed
    1. Clevenger KD, et al. A scalable platform to identify fungal secondary metabolites and their gene clusters. Nat Chem Biol. 2017;13:895. - PMC - PubMed

Publication types

MeSH terms