. 2018 Jul;559(7715):564-569.
doi: 10.1038/s41586-018-0322-9. Epub 2018 Jul 11.

Evolution of a central neural circuit underlies Drosophila mate preferences

Affiliations

Evolution of a central neural circuit underlies Drosophila mate preferences

Laura F Seeholzer et al. Nature. 2018 Jul.

Abstract

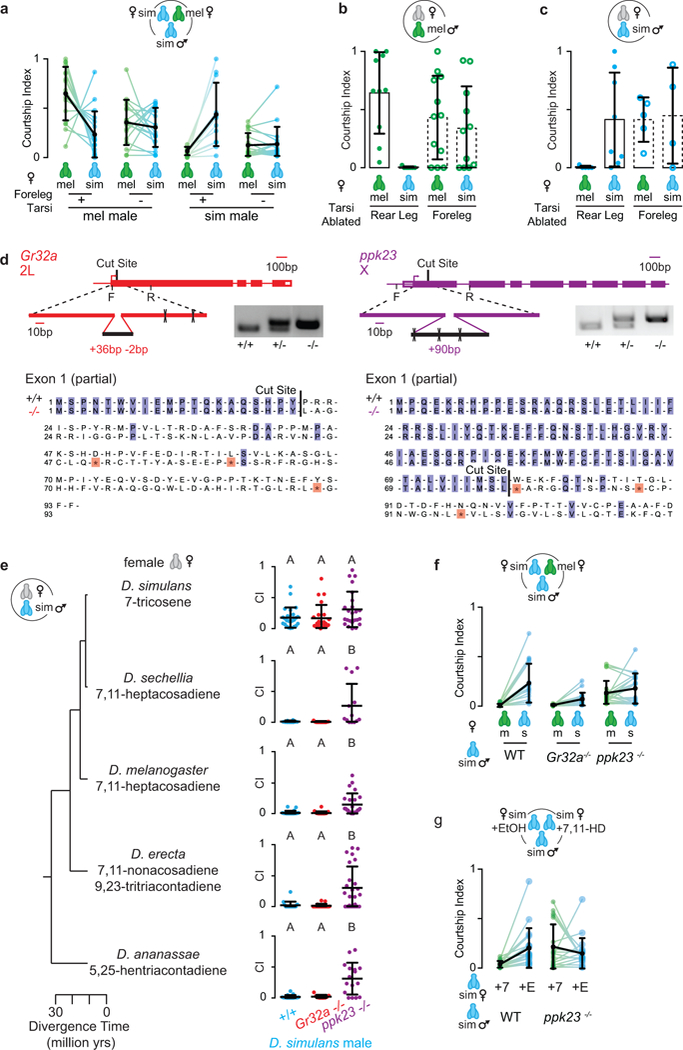
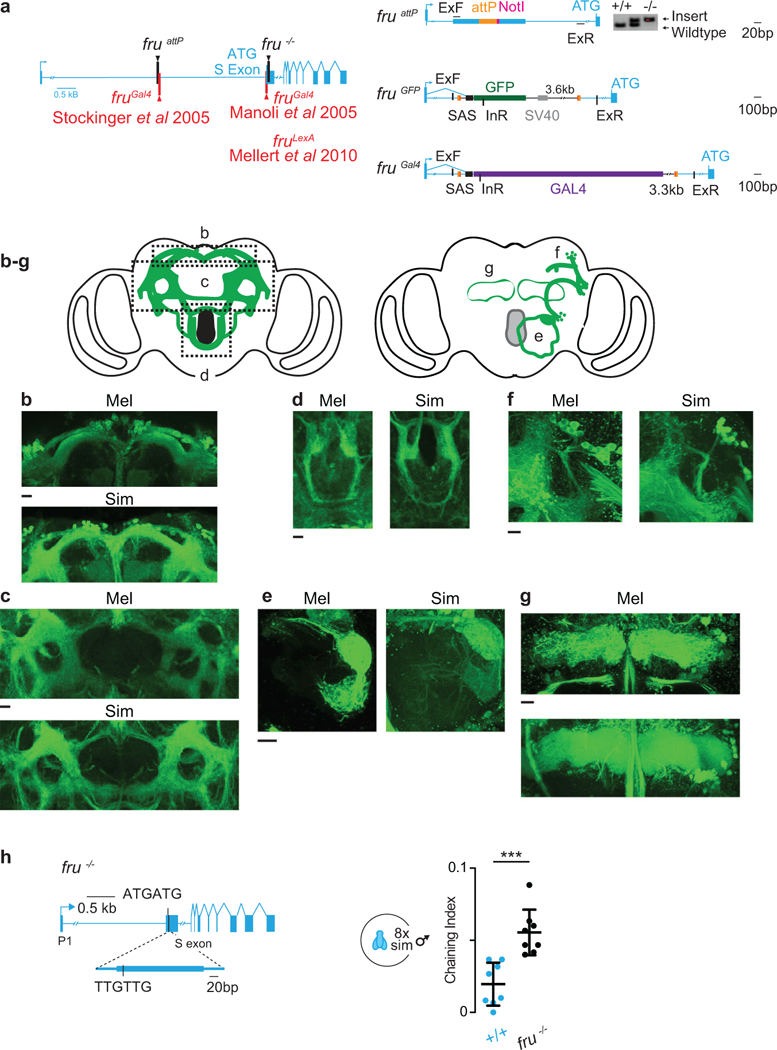
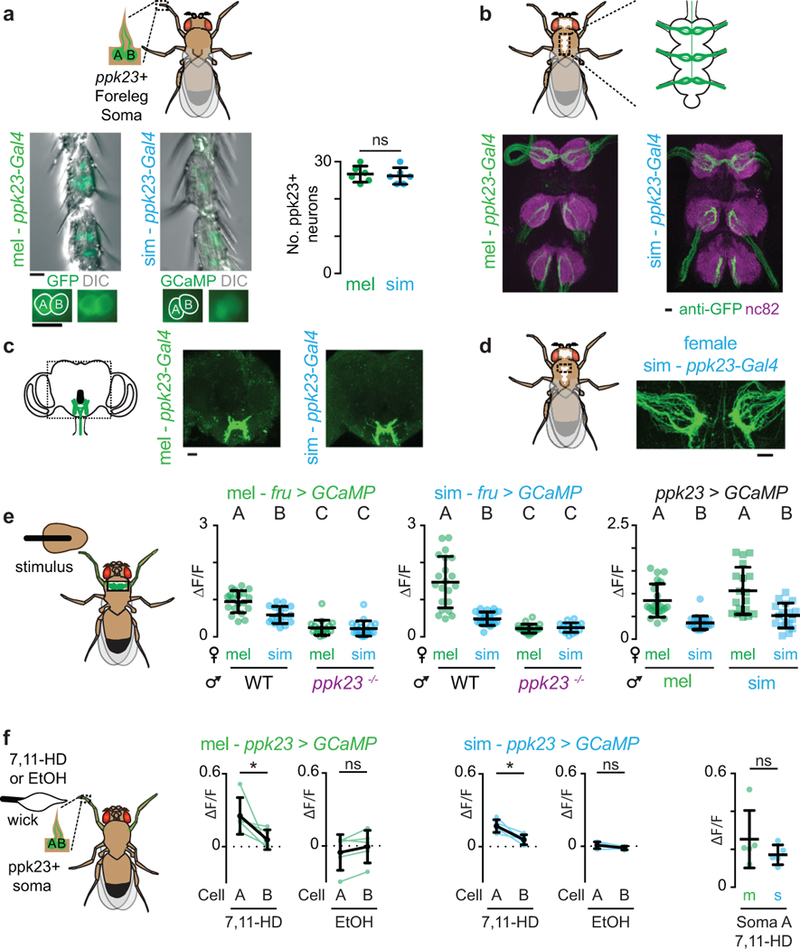
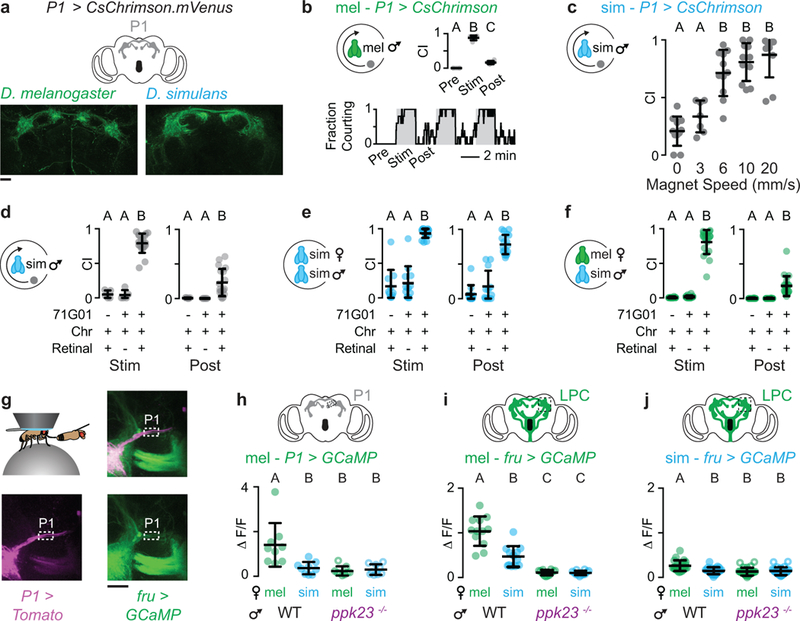
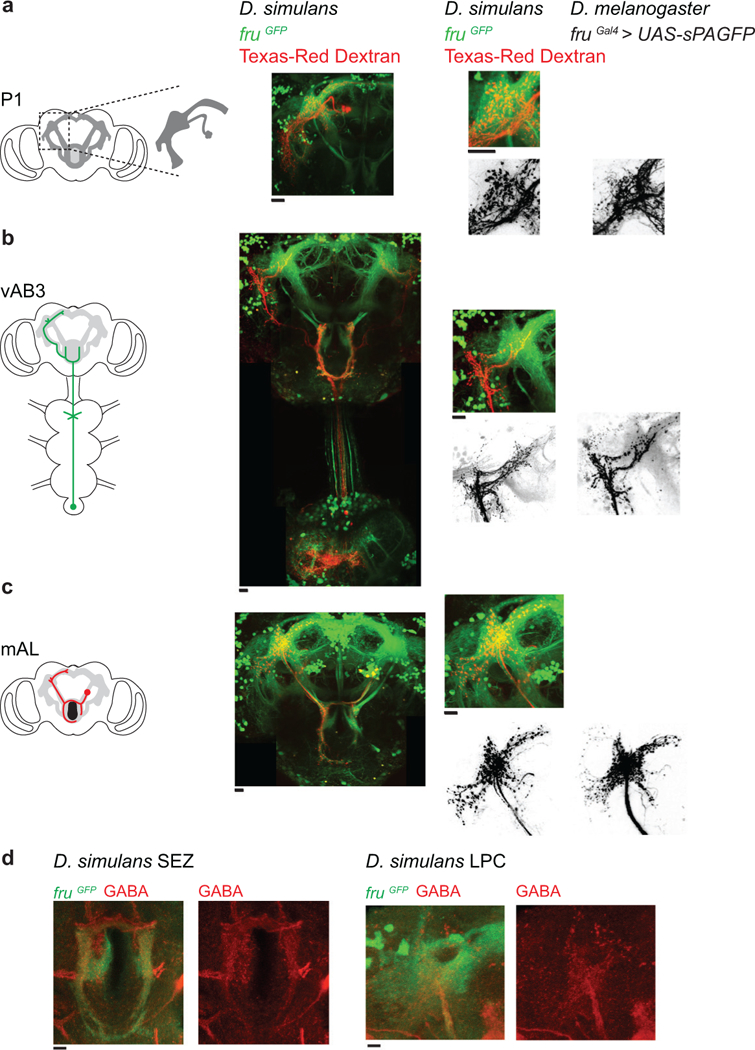
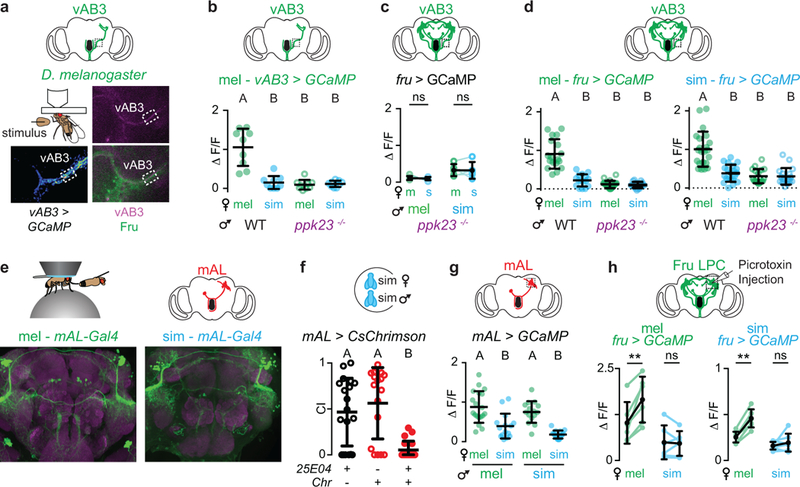
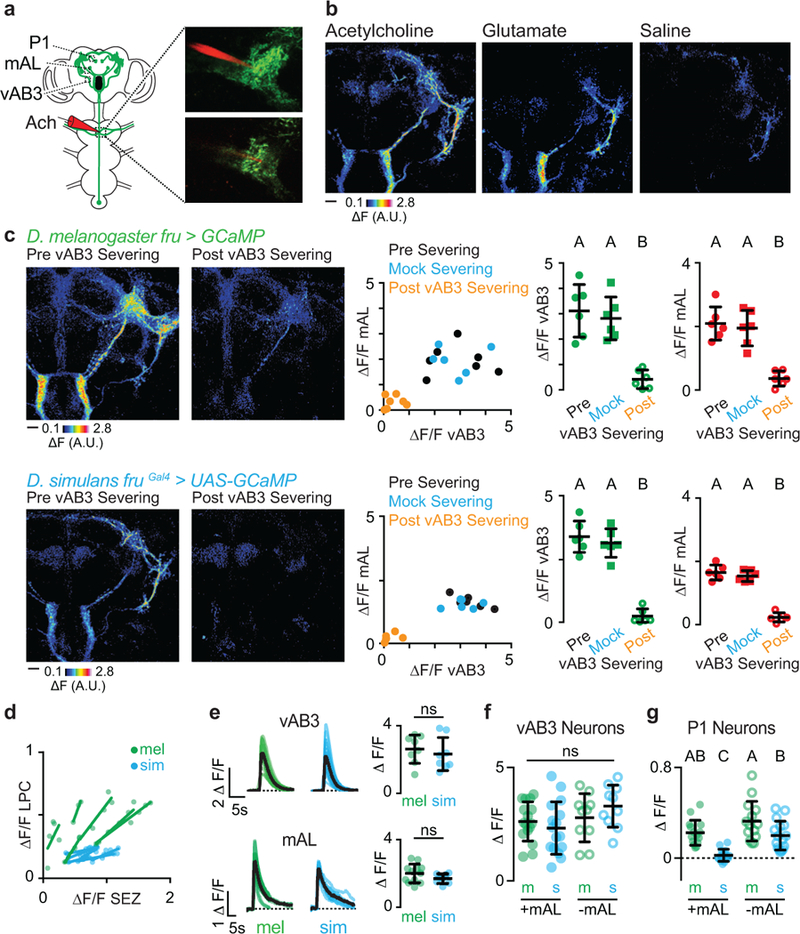
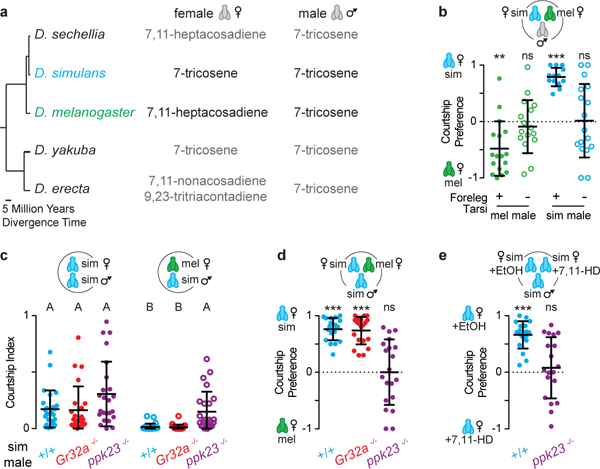
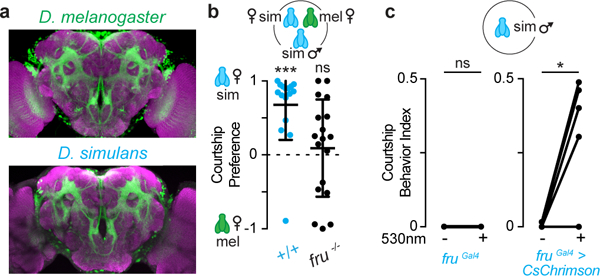
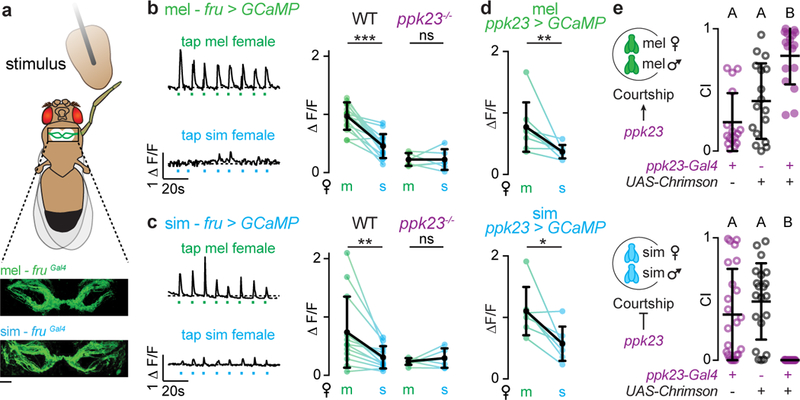
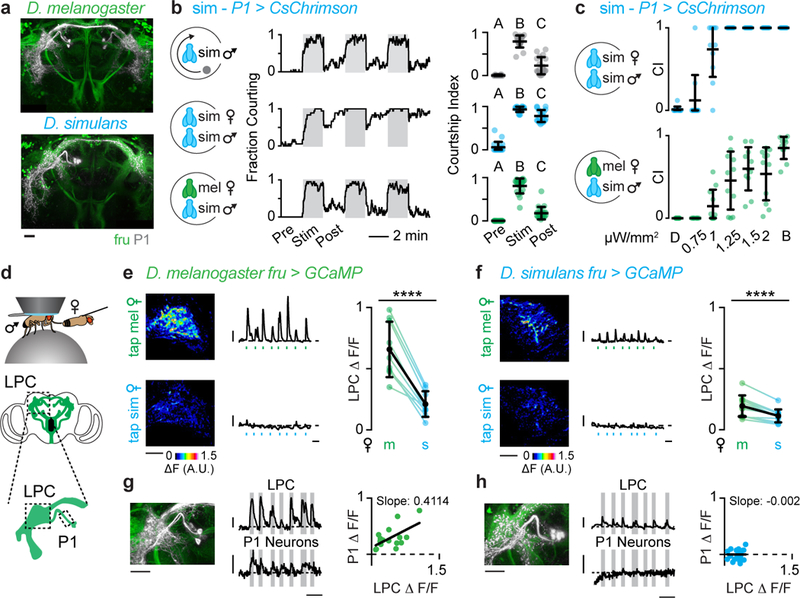
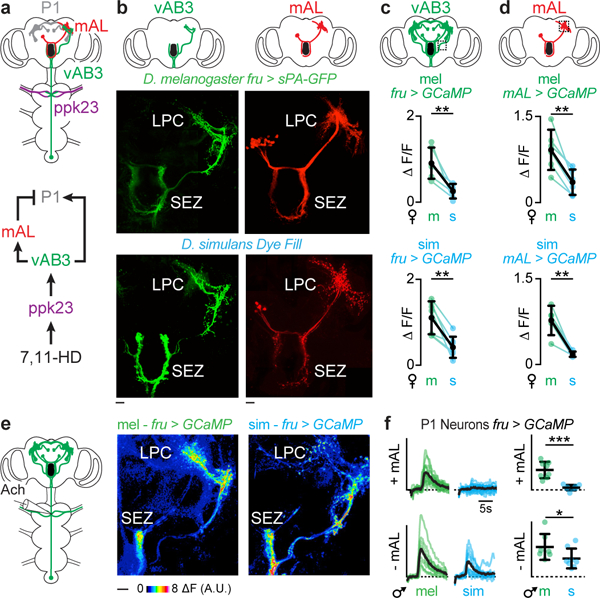
Courtship rituals serve to reinforce reproductive barriers between closely related species. Drosophila melanogaster and Drosophila simulans exhibit reproductive isolation, owing in part to the fact that D. melanogaster females produce 7,11-heptacosadiene, a pheromone that promotes courtship in D. melanogaster males but suppresses courtship in D. simulans males. Here we compare pheromone-processing pathways in D. melanogaster and D. simulans males to define how these sister species endow 7,11-heptacosadiene with the opposite behavioural valence to underlie species discrimination. We show that males of both species detect 7,11-heptacosadiene using homologous peripheral sensory neurons, but this signal is differentially propagated to P1 neurons, which control courtship behaviour. A change in the balance of excitation and inhibition onto courtship-promoting neurons transforms an excitatory pheromonal cue in D. melanogaster into an inhibitory cue in D. simulans. Our results reveal how species-specific pheromone responses can emerge from conservation of peripheral detection mechanisms and diversification of central circuitry, and demonstrate how flexible nodes in neural circuits can contribute to behavioural evolution.


Figures

Extended Data Figure 1:
Extended Data Figure 1:. Pheromone regulation of D. simulans courtship.
Mutant males and males lacking foreleg tarsi still court, but display altered courtship preferences. a, Courtship indices of males with foreleg tarsi intact (+) or surgically removed (−). Data is replotted from Fig. 1b. b, c, Courtship indices of D. melanogaster (b) and D. simulans (c) males with either foreleg tarsi or rear leg tarsi ablated towards D. melanogaster or D. simulans females. d, Schematic of CRISPR/Cas9-induced mutations (top) in Gr32a (left) and ppk23 (right) gene loci. Cas9 was targeted by gRNA to the first exon (cut site) of Gr32a or ppk23. Cleaved DNA was repaired by non-homologous end-joining resulting in a 36 bp insertion/2 bp deletion in the Gr32a coding sequence and 90 bp insertion into the ppk23 coding sequence. Both indels resulted in in-frame stop codons (bottom, * highlighted red in resulting amino acid sequence). Forward (F) and reverse (R) genotyping primers are marked with a line. e, Courtship indices towards females of different Drosophila species by wild-type (+/+), Gr32a−/− and ppk23−/− D. simulans males. f, Courtship indices of D. simulans males towards D. melanogaster and D. simulans females in preference assays. Data is replotted from Fig. 1d. g, Courtship indices of D. simulans males towards D. simulans female perfumed with 7,11-HD (7, green) or ethanol (E, EtOH, blue). Data is replotted from Fig. 1e. e, Kruskal-Wallis test, different letters mark significant differences. Black bars and dots: mean and s.d. Lines connect courtship indices of the same male towards the different female targets in a preference assay. Since the male can only court one female at a time, the paired points are inherently interdependent on each other, thus inappropriate for statistical analysis. See Supplemental Table 1 for details of statistical analyses.
Extended Data Figure 2:
Extended Data Figure 2:. Anatomic and functional conservation of Fru+ neurons.
a, Schematic of chromosomal location of fruattP and fru−/− integration sites in D. simulans and previously generated fruGal4 and fruLexA transgenes in D. melanogaster (left). Schematic of attP oligo integrated into the fru intron to generate fruattP allele and subsequent integration of attB plasmids (right). ExF and ExR are primers located in the genome and InR is a primer located inside the transgene. b-g, Maximum intensity confocal (b-d) and two-photon stacks (e-g) of anatomically defined regions of Fru+ neuropil in D. melanogaster fruGal4>UAS-GCaMP6s and D. simulans fruGFP males: lateral protocerebral complex (b, c), suboesophageal zone (d), antennal lobe (e), lateral horn and DC1 neural tract and soma (f) and mushroom body γ-lobes (g). h, Generation of D. simulans fru−/− by integrating an oligo that deleted codons 1 and 2 of the first exon, introducing a frameshift mutation. i, Male-male chaining indices of wild-type (+/+) and fru−/− males. Paired t-test,Bars: mean and s.d. Scale bar: 10 μm. See Supplemental Table 1 for details of statistical analyses.
Extended Data Figure 3:
Extended Data Figure 3:. Conserved anatomy and functional tuning of ppk23+/Fruitless+ foreleg sensory neurons.
a-c, ppk23 promoter expression in D. melanogaster and D. simulans males in forelegs (a), ventral nerve cord (b, VNC) and brain (c). Green: GFP. Grey: DIC. Magenta: neuropil counterstain. a, Number of ppk23+ sensory neuron soma in the first three tarsal segments of the foreleg (middle right). d, ppk23 neuron innervation in the first thoracic ganglion of the VNC of D. simulans females. ppk23+ sensory neurons display a characteristic sexually dimorphic expression pattern in the ventral nerve cord where they do not cross the midline in females, but do in males. e, Schematic of VNC imaging preparation (left). Functional responses evoked by individual taps of a female abdomen in Fru+ neurons (middle) and ppk23+ neurons (right) in the VNC of wild-type (WT) and ppk23−/− D. melanogaster and D. simulans males. Data replotted from Fig. 3b-d. f, Schematic of paired ppk23+ somatic imaging preparation (left) and functional responses of the paired neurons (cell A and B, see methods) within a sensory bristle stimulated with 7,11-HD or ethanol (middle). Comparison of 7,11-HD responses in ppk23+ soma across species (right). a, unpaired t-test, e, Kruskal-Wallis test, different letters mark significant differences, and f, paired and unpaired t-tests. Scale bars represent 10 μm. See Supplemental Table 1 for details of statistical analyses.
Extended Data Figure 4:
Extended Data Figure 4:. Behavioral and functional analysis of P1 neurons.
a-f, Anatomy (a) and optogenetic behavioral manipulations (b-f) of P1 neurons using 71G01-Gal4 to drive the expression of CsChrimson. b, Courtship indices (top, right) towards a rotating magnet by D. melanogaster males pre-, during, and post-P1 neuron stimulation. Fraction of male flies courting (bottom, grey boxes: bright light illumination, see methods). c, Courtship indices towards a magnet moving at different speeds during optogenetic P1 neuron stimulation in D. simulans males. d-f, Comparison of courtship indices towards magnet (d), D. simulans female (e), or D. melanogaster female (f) by D. simulans males of denoted genotypes, fed, or not fed retinal. g, In vivo preparation used to measure pheromone responses in the P1 neurons (top left) and overlay of the Fru+ (green) neurons and fasciculated P1 neuron processes (magenta). White box indicates approximate ROI imaged to measure P1 responses. h-j, Functional responses evoked by individual taps of a female abdomen in P1 neurons (h) and Fru+ neurons in the LPC (i, j) of wild-type (WT) and ppk23−/− D .melanogaster and D. simulans males (data replotted from Fig. 4 e, f). b, d-f, h-j, Kruskal-Wallis test and c, One-way ANOVA). Black bars: mean and s.d. See Supplemental Table 1 for details of statistical analyses.
Extended Data Figure 5:
Extended Data Figure 5:. Anatomy of P1, vAB3 and mAL neurons in D. simulans and D. melanogaster males.
a-c, Detailed anatomic images of P1 neurons (a), vAB3 neurons (b) and mAL neurons (c). Cartoon of neural anatomy (left), Texas-Red dextran dye-fill (red) in D. simulans fruGFP (green) males (middle-left), magnified view of labeled neurons in the lateral protocerebral complex (LPC) showing dye-filled neurons (red) and Fru+ neurons (green) or just dye-filled neurons (black, middle-right) and photo-activated neurons in D. melanogaster LPC (black, right). d, Antibody staining of D. simulans Fru+ neurons (anti-GFP, green) with anti-GABA (red) in the SEZ and LPC demonstrating that mAL neurons are GABAergic and thus inhibitory. Scale bars: 10 μm.
Extended Data Figure 6:
Extended Data Figure 6:. Pheromone responses in central neurons of D. melanogaster and D. simulans males.
a, Schematic of in vivo preparation used to measure pheromone responses in vAB3 processes in the brain (top). Representative fluorescence increase of vAB3 responses in D. melanogaster male evoked by tapping a D. melanogaster female (bottom left). GCaMP was expressed in vAB3 neurons using the AbdB-Gal4 driver. Anatomy of fasciculated vAB3 processes co-labeled by fruGal4 (green) and AbdB-Gal4 (magenta) in the same in vivo preparation used for imaging (right). White box indicates approximate ROI analyzed for functional imaging. b-d, Functional responses evoked by the taste of female pheromones in the vAB3 processes of wild-type (WT) and ppk23−/− males. b, Functional responses evoked by individual taps in vAB3 neurons in D. melanogaster labeled using AbdB-Gal4. c, Average responses of vAB3 neurons in ppk23−/− D. melanogaster and D. simulans males in response to the taste of D. melanogaster (m) and D. simulans (s) females. GCaMP was expressed in vAB3 neurons using fruGal4. d, Functional responses evoked by individual taps in vAB3 neurons in wild type and ppk23−/− mutant males. Data replotted from Fig. 5c and Extended Data Fig. 6c. e, Expression of 25E04-Gal4 > UAS-GCaMP (green) with neuropil counterstain (magenta) in the brains of D. melanogaster (left) and D. simulans (right) males. f, Courtship indices towards conspecific females during optogenetic activation of mAL neurons in D. simulans males with parental controls. g, Functional responses evoked by individual taps in mAL neurons. Data replotted from Fig. 5d. h, Average ΔF/F responses in Fru+ neurons of the LPC evoked by the taste of a female before and after local injection of picrotoxin, a GABA receptor antagonist, into the LPC. In males of both species, application of picrotoxin increased responses only to D. melanogaster female stimuli. Lines connect average functional responses in the same male towards the different female targets. b, d, f, g, Kruskal-Wallis test, different letters mark significant differences, and c, h, paired t-test. Black bars: mean and s.d. See Supplemental Table 1 for details of statistical analyses.
Extended Data Figure 7:
Extended Data Figure 7:. Functional responses of Fru+ neurons to direct vAB3 stimulation in D. melanogaster and D. simulans males.
a, Schematic and representative image depicting direct stimulation of vAB3 neurons by iontophoresis of neurotransmitter onto their dendrites within the ventral nerve cord (VNC). Maximum intensity Z-projection (top) and single Z-plane (bottom) showing electrode placement in VNC. Electrode is filled with neurotransmitter and Texas-red dye (red) to allow precise targeting in the Fru+ neuropil (green). b, Representative multi-plane fluorescence increase of Fru+ brain neurons in D. simulans males when the VNC is stimulated with acetylcholine (left), glutamate (middle) and saline (right) iontophoresis. c, To test the necessity of vAB3 in propagating signals from the VNC to higher brain, we compared response profiles in the brain before severing vAB3 (black), after severing a nearby Fru+ axon (mock control, blue) and then after severing vAB3 axons (orange) in D. melanogaster males (top) and D. simulans males (bottom). Representative multi-plane fluorescence increase of Fru+ neurons (left) shows the loss of evoked functional responses in the brain after severing vAB3. Graph (middle) depicts relationship between average ΔF/F responses in vAB3 and mAL. Average ΔF/F responses of vAB3 (green) and mAL (red) neurons evoked by vAB3 stimulation, before and after severing vAB3. Responses were lost in both neural populations in both species after vAB3 was severed but not in the mock control. d, Relationship of functional responses in the SEZ and LPC of D. melanogaster and D. simulans males evoked by direct vAB3 stimulation. Dots on graph represent different stimulation intensities and lines connect responses of individual D. melanogaster (green) and D. simulans (blue) males. e, Response of vAB3 (top) and mAL (bottom) axon tracts in response to vAB3 stimulation in D. melanogaster (green) and D. simulans (blue) males. Coloured lines represent single stimulations and black lines represent average. Peak ΔF/F plotted (right) with coloured dots representing average response per animal and black bars representing mean and s.d. f, g, Comparison of vAB3-evoked responses in D. melanogaster and D. simulans males in vAB3 neurons (f) and P1 neurons (g) before (+) and after (−) mAL severing. c, f, g, Kruskal-Wallis test, different letters mark significant differences and e, unpaired t-test. Scale bars: 10 μm. See Supplemental Table 1 for details of statistical analyses.
Figure 1:
Figure 1:. Pheromone regulation of D. simulans courtship.
a, Predominant cuticular hydrocarbons of related species. b, Courtship preferences of D. melanogaster and D. simulans males with foreleg tarsi intact (+) or removed (−). c, d, Courtship indices (c) or preference indices (d) of wild-type (+/+), Gr32a−/−, and ppk23−/− D. simulans males offered D. simulans and/or D. melanogaster females. e, Preference indices of wild-type or ppk23−/− D. simulans males offered D. simulans females perfumed with ethanol (EtOH) or 7,11-HD. b, d, e, one-sample t-test. c, Kruskal-Wallis test. Bars: mean and s.d. See Supplemental Table 1 for details of statistical analyses.
Figure 2:
Figure 2:. Fruitless plays a conserved role in male courtship
a, Fru+ neurons (green) with neuropil counterstain (magenta) in brains of D. melanogaster and D. simulans males. Scale bar: 30 μm.​ b, Courtship preferences of wild-type (+/+) and fru−/− D. simulans males. c, Fraction of time solitary males displayed courtship behaviors with or without optogenetic stimulation of fru+ neurons. b, one-sample t-test, c, Wilcoxon matched-pairs signed rank test. Bars: mean and s.d. See Supplemental Table 1 for details of statistical analyses.
Figure 3:
Figure 3:. Conserved pheromonal tuning of ppk23+/Fru+ foreleg sensory neurons.
a, Schematic of ventral nerve cord preparation used for imaging with Fru+ foreleg sensory neurons expressing GCaMP. b, c, Functional responses of Fru+ foreleg afferents in D. melanogaster (b) or D. simulans (c) males evoked by the taste of a D. melanogaster (m) or D. simulans (s) female. Representative activity traces with time of taps indicated (left) and average ΔF/F in wild-type and ppk23−/− males (right). d, Functional responses (average ΔF/F) of ppk23+ foreleg afferents evoked by the taste of a D. melanogaster (m) or D. simulans (s) female. e, Courtship indices (CI) towards conspecific females during optogenetic stimulation of ppk23+ neurons in D. melanogaster and D. simulans males. b-d, Wilcoxon matched-pairs test, d, Kruskal-Wallis test. Black bars and dots: mean and s.d. Scale bar: 10 μm. See Supplemental Table 1 for details of statistical analyses.
Figure 4:
Figure 4:. Divergent pheromone responses in courtship-promoting P1 neurons.
a, P1 neurons (grey) innervate the Fru+ (green) lateral protocerebral complex (LPC). b, c, Optogenetic stimulation of P1 neurons in D. simulans males. b, Courtship towards a rotating magnet (top), D. simulans female (middle), or D. melanogaster female (bottom). Fraction of flies courting (left, grey boxes: illumination with bright light). Courtship indices (CI) pre-, during, and post-stimulation (right). c, Courtship indices of D. simulans males towards D. simulans (top) and D. melanogaster females (bottom) in dim (D) or bright (B) white light or indicated 627 nm illumination. d, In vivo preparation used for functional GCaMP imaging (top) and cartoon of Fru+ neurons (bottom, regions imaged outlined). e, f, Functional responses of Fru+ neurons in the LPC of D. melanogaster (e) and D. simulans (f) males evoked by tapping D. melanogaster (m) and D. simulans (s) females. Representative GCaMP fluorescence increase upon stimulation (left). Representative activity traces with time of stimulating taps indicated (middle). Average ΔF/F for individual males (right). g, h, Simultaneously recorded activity of LPC and P1 neurons in D. melanogaster (g) and D. simulans (h) males evoked by the taste of a D. melanogaster female. Magnified P1 neuron anatomy (left, same images as in a). Representative activity traces (middle, grey bars indicate taps) and relationship between responses evoked by individual taps in LPC and P1 neurons (right). b, c, Kruskal-Wallis test, e, f, paired t-test and g, h, linear regression. Black bars and dots: mean and s.d. Scale bars: 10 μm. Scale bars for activity traces: vertical, 0.25 ΔF/F, horizontal, 10s. See Supplemental Table 1 for details of statistical analyses.
Figure 5:
Figure 5:. Differential propagation of ascending pheromone signals to P1 neurons.
a, Schematic of Fru+ circuit that processes 7,11-HD. b, Anatomy of vAB3 and mAL neurons in D. melanogaster and D. simulans. SEZ: suboesophageal zone, LPC: lateral protocerebral complex. Scale bars: 10 μm. c, d, Average ΔF/F for individual males evoked by D. melanogaster (m) and D. simulans (s) females in vAB3 (c) and mAL (d) neurons. e, Representative GCaMP fluorescence increase in Fru+ neurons evoked by direct vAB3 stimulation. f, P1 neuron responses to vAB3 stimulation before (top) and after (bottom) mAL severing in D. melanogaster (green) and D. simulans (blue) males. Coloured lines: individual stimulations, black lines: average (left). Graph plots peak ΔF/F per animal (right). Scale bars for functional responses: 0.6 ΔF/F. c, d, paired t-test, f, unpaired t-test. Bars: mean and s.d. See Supplemental Table 1 for details of statistical analyses.

Comment in

References

    1. Lim MM et al. Enhanced partner preference in a promiscuous species by manipulating the expression of a single gene. Nature 429, 754–757 (2004). - PubMed
    1. McGrath PT et al. Parallel evolution of domesticated Caenorhabditis species targets pheromone receptor genes. Nature 477, 321–325 (2011). - PMC - PubMed
    1. Weber JN, Peterson BK & Hoekstra HE Discrete genetic modules are responsible for complex burrow evolution in Peromyscus mice. Nature 493, 402–405 (2013). - PubMed
    1. Ding Y, Berrocal A, Morita T, Longden KD & Stern DL Natural courtship song variation caused by an intronic retroelement in an ion channel gene. Nature 536, 329–332 (2016). - PubMed
    1. Hey J & Kilman RM Population genetics and phylogenetics of DNA sequence variation at multiple loci within the Drosophila melanogaster species complex. Mol. Biol. Evol. 10, 804–822 (1993). - PubMed

Publication types

MeSH terms

LinkOut - more resources