. 2018 Jul;559(7714):405-409.
doi: 10.1038/s41586-018-0326-5. Epub 2018 Jul 11.

Reprogramming human T cell function and specificity with non-viral genome targeting

Affiliations

Reprogramming human T cell function and specificity with non-viral genome targeting

Theodore L Roth et al. Nature. 2018 Jul.

Abstract

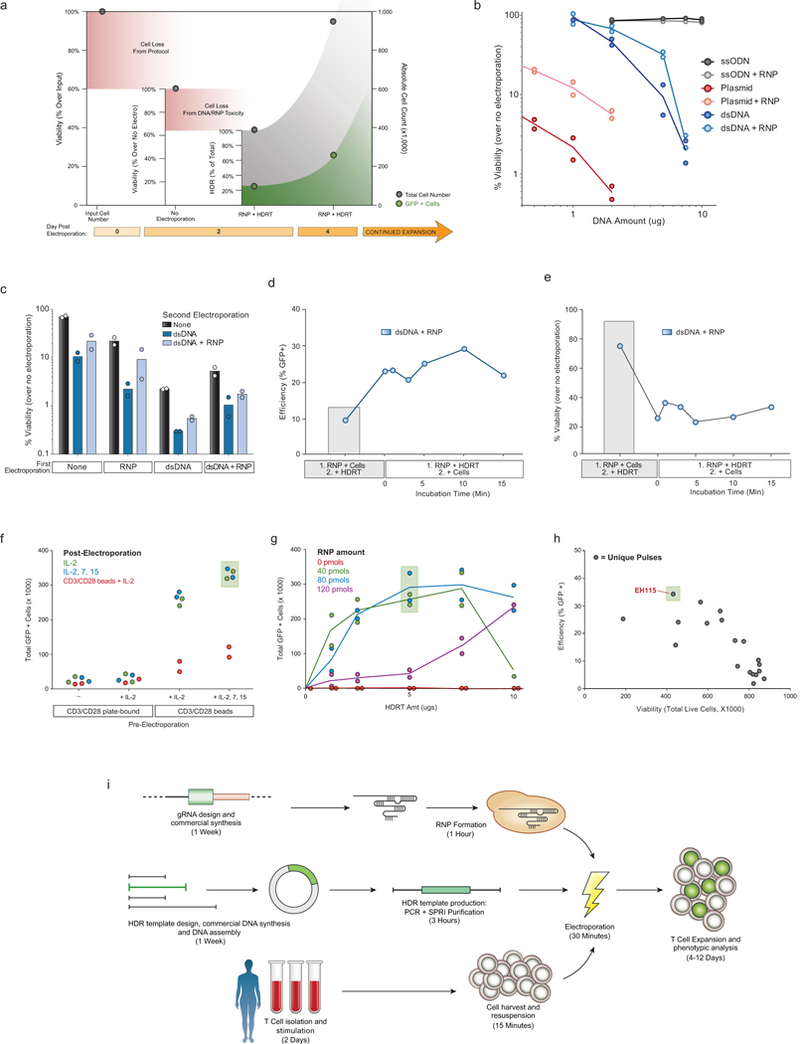
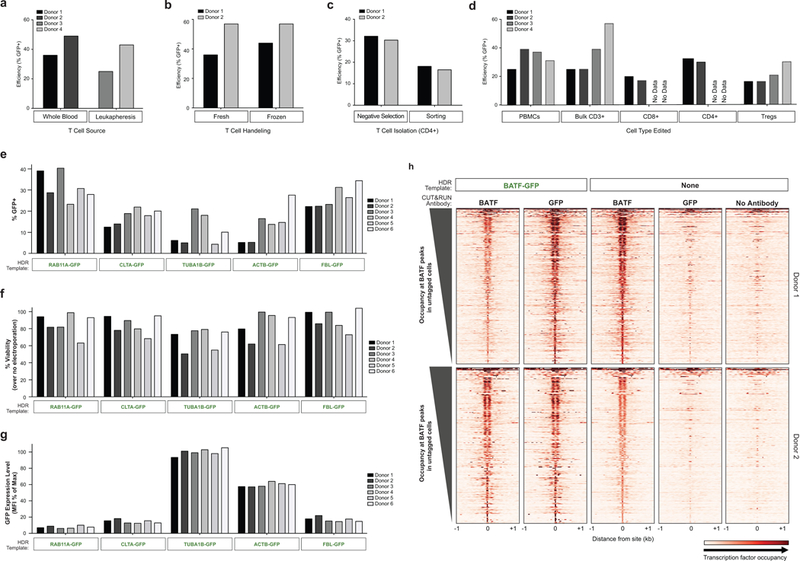
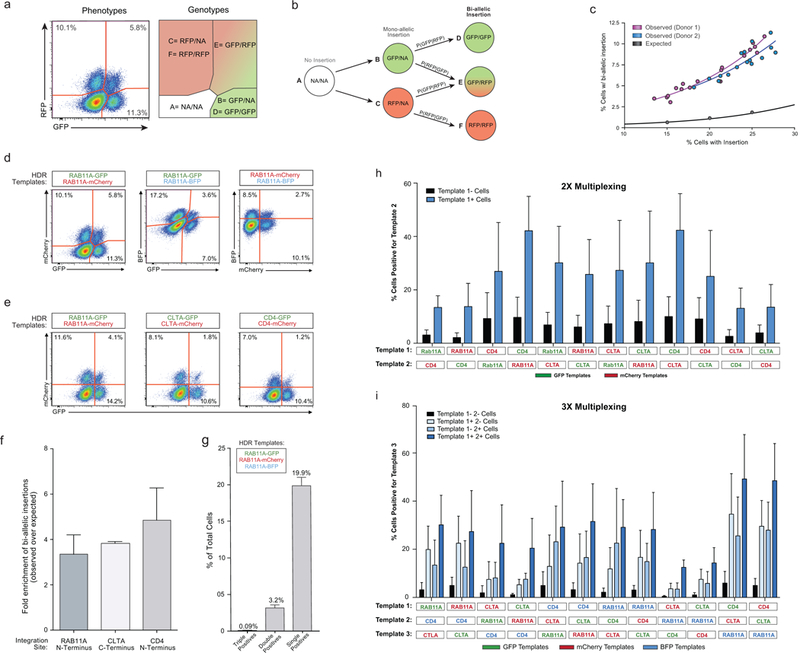
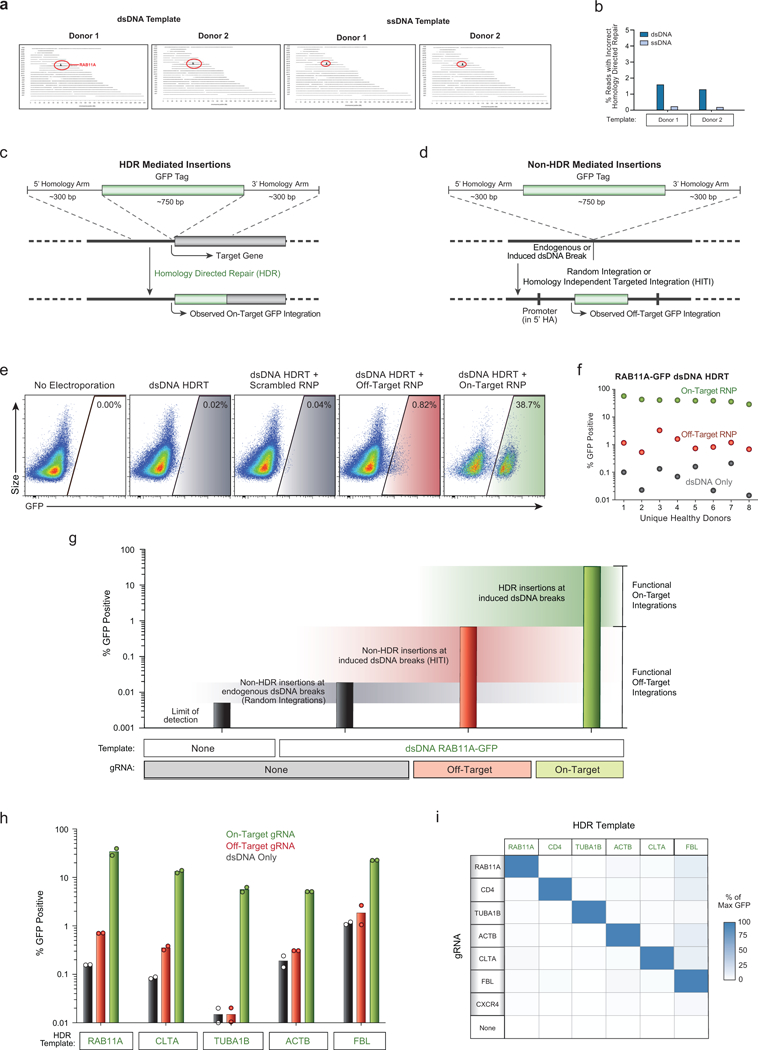
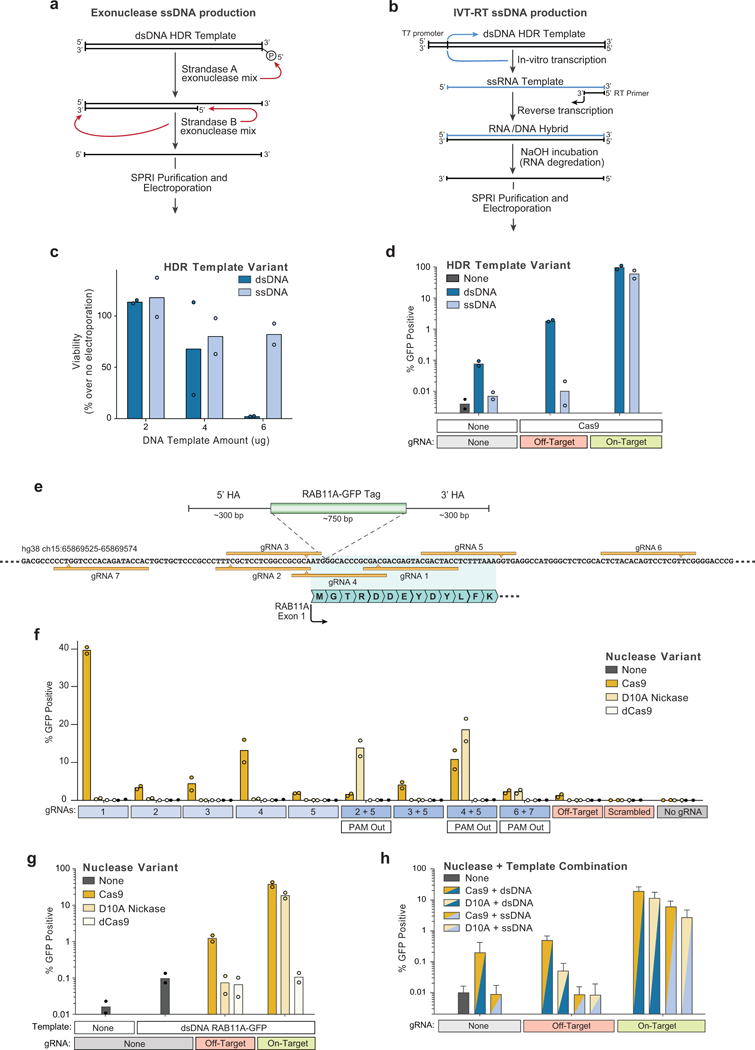
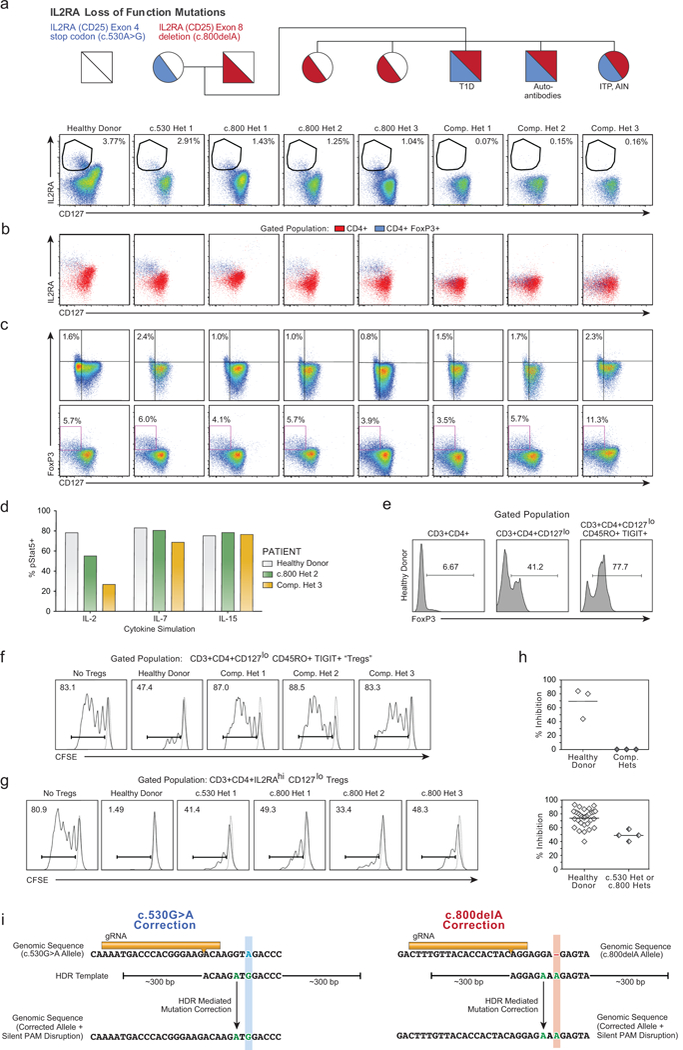
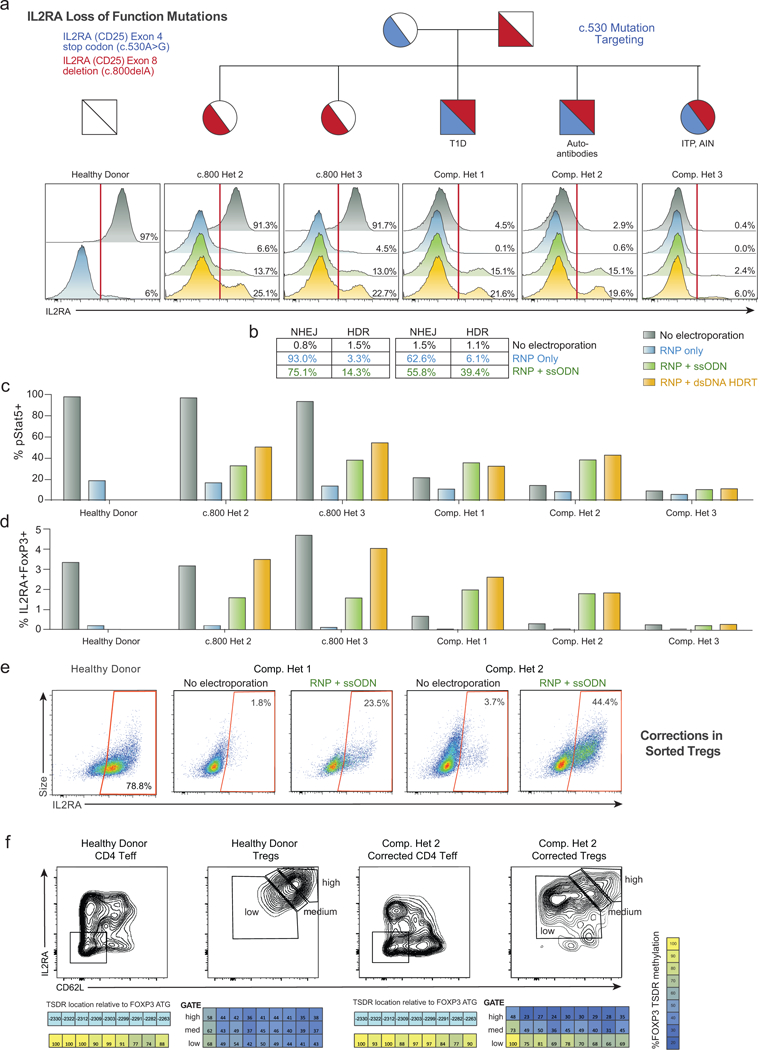
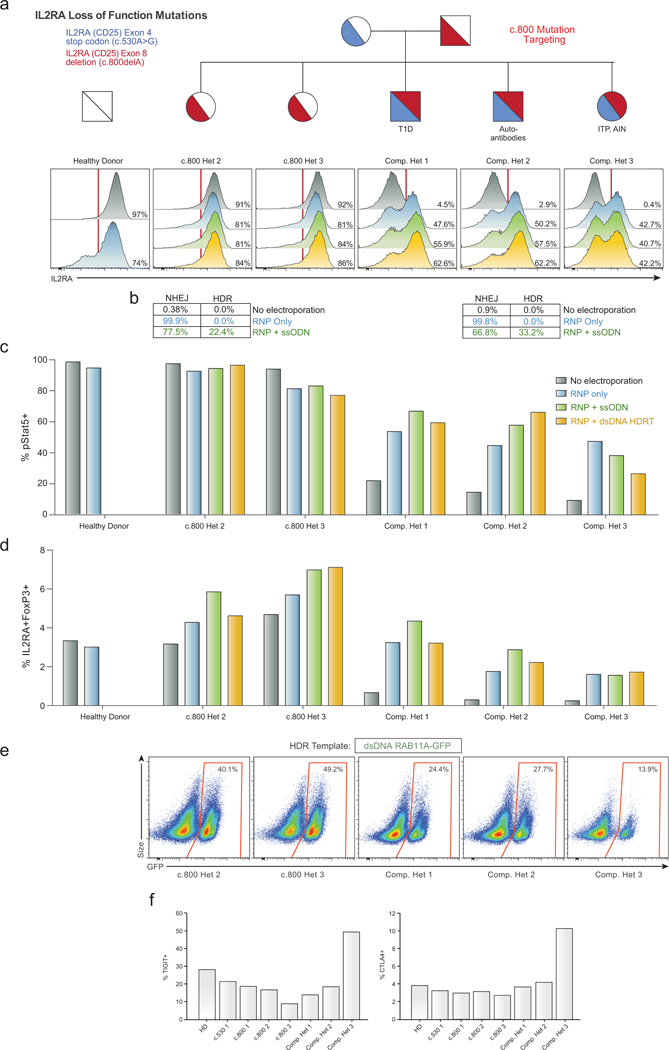
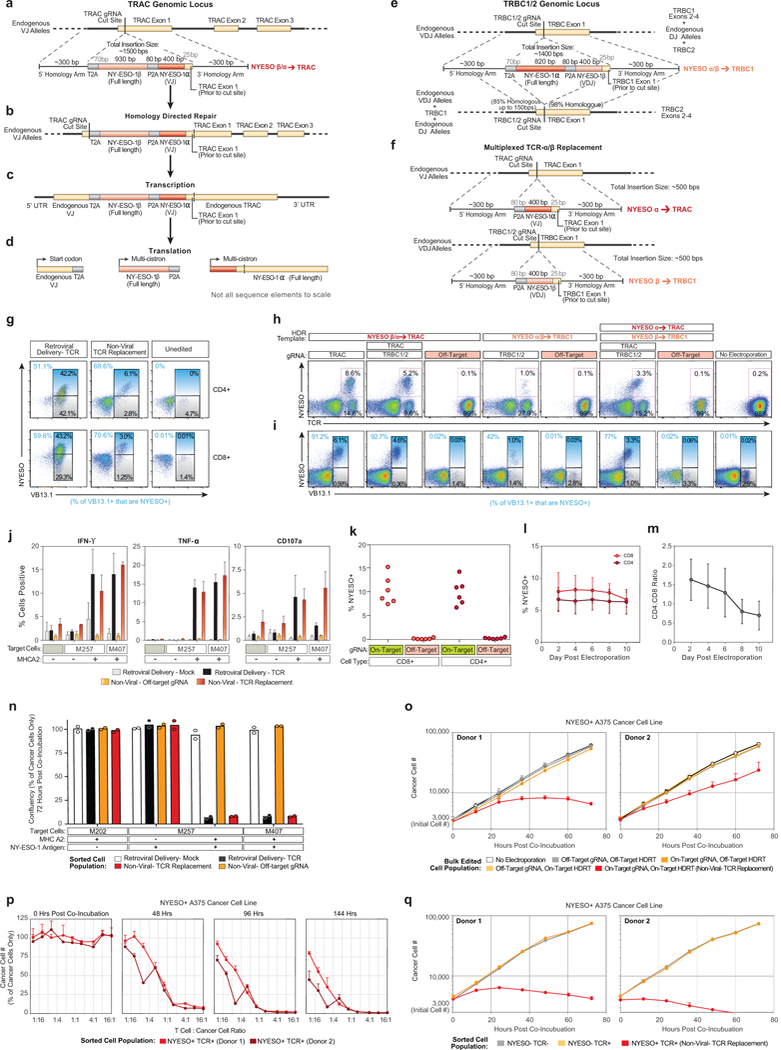
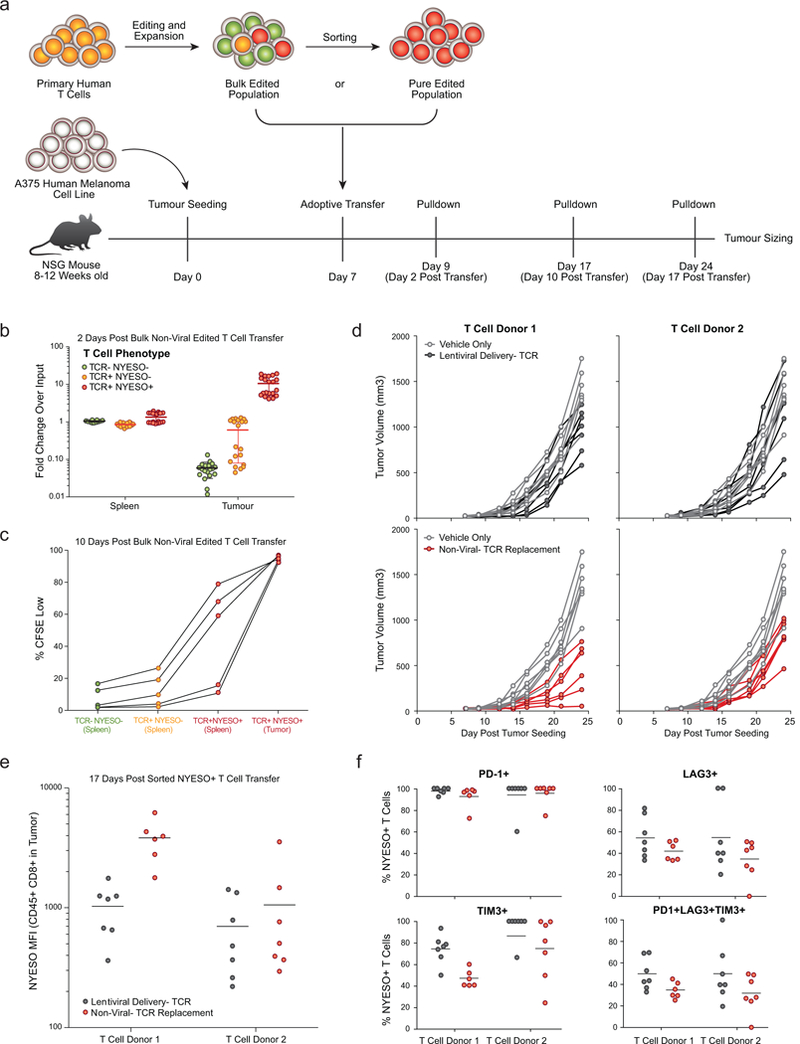
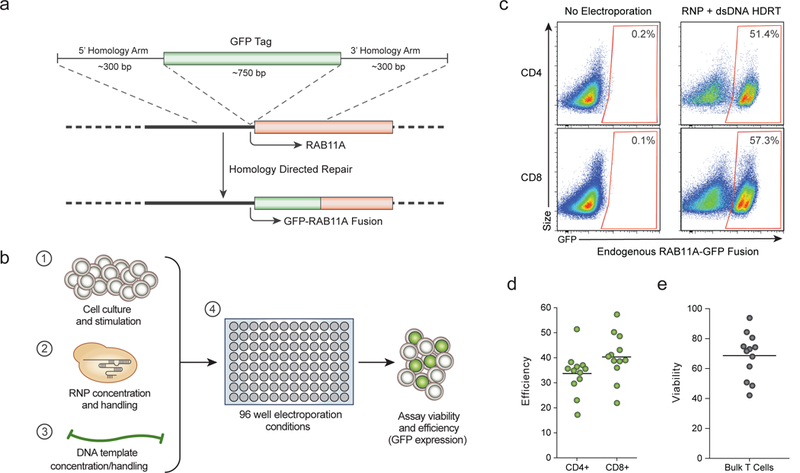
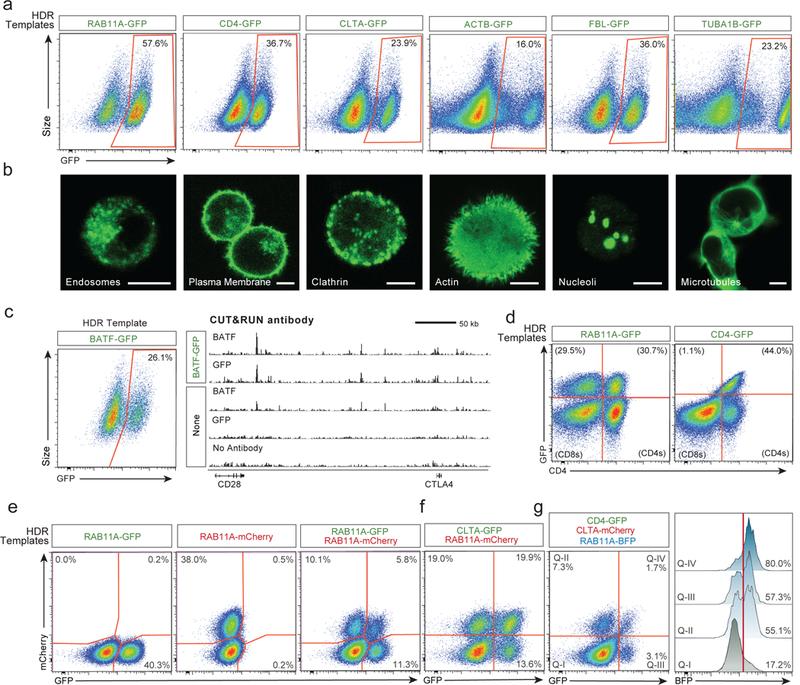
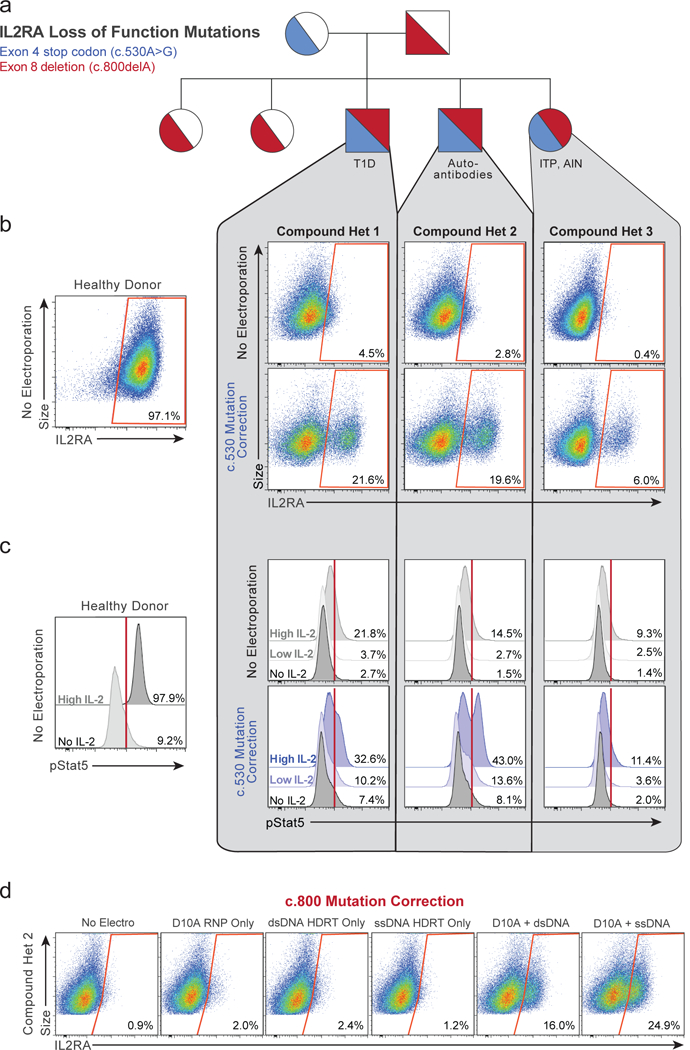
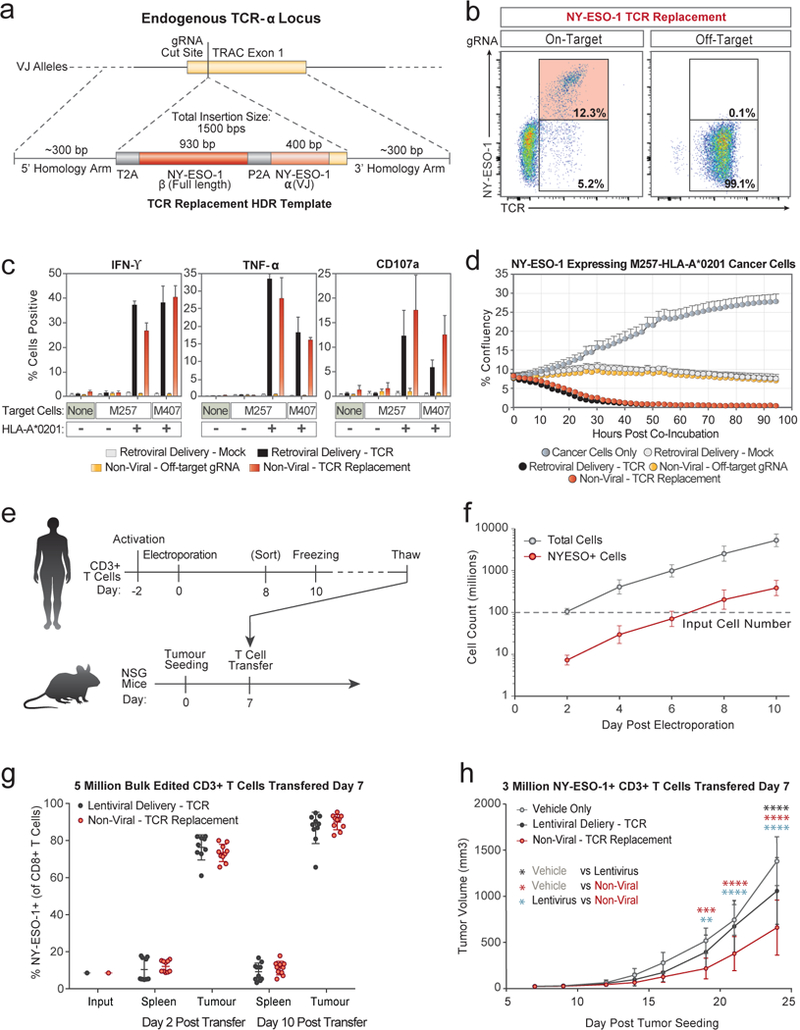
Decades of work have aimed to genetically reprogram T cells for therapeutic purposes1,2 using recombinant viral vectors, which do not target transgenes to specific genomic sites3,4. The need for viral vectors has slowed down research and clinical use as their manufacturing and testing is lengthy and expensive. Genome editing brought the promise of specific and efficient insertion of large transgenes into target cells using homology-directed repair5,6. Here we developed a CRISPR-Cas9 genome-targeting system that does not require viral vectors, allowing rapid and efficient insertion of large DNA sequences (greater than one kilobase) at specific sites in the genomes of primary human T cells, while preserving cell viability and function. This permits individual or multiplexed modification of endogenous genes. First, we applied this strategy to correct a pathogenic IL2RA mutation in cells from patients with monogenic autoimmune disease, and demonstrate improved signalling function. Second, we replaced the endogenous T cell receptor (TCR) locus with a new TCR that redirected T cells to a cancer antigen. The resulting TCR-engineered T cells specifically recognized tumour antigens and mounted productive anti-tumour cell responses in vitro and in vivo. Together, these studies provide preclinical evidence that non-viral genome targeting can enable rapid and flexible experimental manipulation and therapeutic engineering of primary human immune cells.


Figures

Extended Data Figure 1:
Extended Data Figure 1:. Development of non-viral genome targeting in primary human T cells.
a, Except where explicitly noted otherwise, we use viability to refer to the number of live cells in an experimental condition (expressed as a %) relative to an equivalent population that went through all protocol steps except for the actual electroporation (No electroporation control). We use the term efficiency to refer to the percentage of live cells in a culture expressing the “knocked in” exogenous sequence (such as GFP). Finally, the total number of cells positive for the desired modification was calculated by multiplying the efficiency by the absolute cell count. Methodological changes that maximized efficiency were not always optimal for the total number of positive cells, and vice-versa. b, Double-stranded (ds)DNA, both circular (plasmid) and linear, when electroporated into primary human T cells, caused marked loss in viability with increasing amounts of template. Co-delivery of an RNP caused less reduction in viability post electroporation. Of note, in these experiments no loss in viability was seen with short single-stranded (ss)DNA oligo donor nucleotides (ssODNs). c, RNPs must be delivered concurrently with DNA to see increased viability. T cells from two donors were each electroporated twice with an eight-hour rest in between electroporations. While two electroporations so closely interspersed caused a high degree of cell death, delivery of the RNP and linear dsDNA template could be delivered separately. Initial RNP electroporation did not protect from the loss of viability if dsDNA was delivered alone in the second round of electroporation. d, We determined whether the order of adding reagents influenced targeting efficiency and viability. In wells where the RNP and the DNA HDR template were mixed together prior to adding the cells (1. RNP + HDRT; 2. + Cells), there was a marked increase in targeting efficiency. e, Note, with the high concentration of dsDNA used in these experiments, viability was higher if the RNP and cells were mixed first and the DNA template was added immediately prior to electroporation (1. RNP + Cells; 2. + HDRT). Taken together, these data likely suggest that pre-incubation of the RNP and HDR template, even for a short period, increased the amount of DNA HDR template delivered into the cell, which increased efficiency but decreased viability. However, viability after RNP and dsDNA HDR template pre-incubation was still higher than was observed with dsDNA HDR template electroporation by itself (b). 5 μg of dsDNA HDR temple was used in (c-e). f, Primary human T cells were cultured for 2 days using varying combinations of anti-CD3/CD28 T cell receptor (TCR) stimulation and cytokines prior to electroporation of RAB11A targeting RNP and HDR template, followed by varying culture conditions post-electroporation. g, Among the RNP and HDR template concentrations tested here, optimal GFP insertion into RAB11A was achieved at intermediate concentrations of the RNP and dsDNA HDRT. h, Arrayed testing of electroporation pulse conditions showed that, in general, conditions yielding higher HDR efficiency decreased viability. EH115 was selected to optimize efficiency, while still maintaining sufficient viability. i, Diagrammatic timeline of non-viral genome targeting. Approximately one week is required to design, order from commercial suppliers, and assemble any novel combination of genomic editing reagents (gRNA and the HDR template). Two days prior to electroporation, primary human T cells isolated from blood or other sources (Extended Data Fig. 2) are stimulated. dsDNA HDR templates can be made easily by PCR followed by a SPRI purification to achieve a highly concentrated and pure product suitable for electroporation. On the day of electroporation, the gRNA (complexed with Cas9 to form an RNP), the HDR template, and harvested stimulated T cells are mixed and electroporated, a process taking approximately 1.5 hours. After electroporation, engineered T cells can be readily expanded for an additional 1-2 weeks. Viability was measured 2 days following electroporation and GFP expression was measured at day 4. Graphs display mean (b, c, g, h) and/or individual donor values (b-h) in n=2 independent healthy donors (b-h). For d, e, and h one representative donor is shown.
Extended Data Figure 2:
Extended Data Figure 2:. Non-viral genome targeting is consistent across T cell types and reproducible across target loci.
a, Efficient genome targeting was accomplished with a variety of T cell processing and handling conditions that are used with current manufacturing protocols for cell therapies. Non-viral genome targeting of a RAB11A-GFP fusion protein using a linear dsDNA HDR template was performed in bulk CD3+ T cells isolated from either whole blood draws or by leukapheresis. b, Targeting was similar either using bulk CD3+ T cells fresh after isolation or after cryopreservation (stored in liquid nitrogen and thawed prior to initial activation). c, CD4+ T cells isolated by fluorescent activated cell sorting (FACS) showed detectable GFP+ cells indicative of efficient editing, albeit at lower rates than targeting in CD4+ cells isolated by negative selection (potentially due to the added cellular stress of sorting). d, Using the same optimized non-viral genome targeting protocol (Methods), a variety of T cell types could be successfully edited, including peripheral blood mononuclear cells, without any selection (T cell culture conditions cause preferential growth of T cells from PBMCs). Sorted T cell subsets CD8+, CD4+, and CD4+IL2RA+CD127lo regulatory T cells (Tregs) could be successfully targeted with GFP integration. PBMCs were cultured for two days identically to primary T cells (Methods). Bulk CD3+ T cells were isolated by negative enrichment. The electroporations in panel d used only 2 μg of dsDNA HDR template, a concentration that was later found to be less efficient than the final 4 μg (contributing to the lower efficiencies seen compared to Fig. 1d). RAB11A-GFP template was used with on-target gRNA was used in a-d. e, Four days after electroporation of different GFP templates along with a corresponding RNP into primary CD3+ T cells from six healthy donors, GFP expression was observed across both templates and donors. f, High viability post-electroporation was similarly seen across target loci. g, The fusion tagged proteins produced by integrating GFP into specific genes localized to the subcellular location of their target protein (Fig. 2b), and were also expressed under the endogenous gene regulation, allowing protein expression levels to be observed in living primary human T cells. Note how GFP tags of the highly expressed cytoskeletal proteins TUBA1B (beta tubulin) and ACTB (beta actin) show consistently higher levels of expression compared to the other loci targeted across six donors. GFP mean fluorescent intensity (MFI) was calculated for the GFP+ cells in each condition/donor, and normalized as a percentage of the maximum GFP MFI observed in the experiment. h, Gene fusions not only permitted the imaging and analysis of expression of endogenous proteins in live cells, but also could be used for biochemical targeting of specific proteins. For example, ChIP-Seq, and more recently CUT & RUN, have been widely used to map transcription factor binding sites; however, these assays are often limited by the availability of effective and specific antibodies. As a proof-of-principle we used anti-GFP antibodies to perform CUT & RUN in primary T cells where the endogenous gene encoding BATF, a critical transcription factor, had been targeted to generate a GFP-fusion. Binding sites identified with anti-GFP CUT & RUN closely matched the sites identified with an anti-BATF antibody. Anti-BATF, anti-GFP, and no antibody heatmaps of CUT&RUN data obtained from primary human T cell populations electroporated with GFP-BATF fusion HDR template (untagged cells were not electroporated). Aligned CUT&RUN binding profiles for each sample were centered on BATF CUT&RUN peaks in untagged cells and ordered by BATF peak intensity in untagged cells. Experiment (h) was performed in two independent healthy donors.
Extended Data Figure 3:
Extended Data Figure 3:. Bi-allelic and multiplexed non-viral genome targeting.
a, We wanted to confirm that we could generate cells with genome insertions in both alleles and quantify the frequency of bi-allelic modifications. Targeting the two alleles of the same gene with two distinct fluorophores would provide a way to quantify and enrich cells with bi-allelic gene modifications. The possible cellular phenotypes and genotypes when two fluorescent proteins are inserted into the same locus are displayed. Importantly, the number of cells that express both fluorescent proteins underestimates the percentage of cells with bi-allelic integrations because some cells will have inserted either GFP or mCherry on both alleles. We constructed a model to account for bi-allelic integrations of the same fluorescent protein (Supplementary Note 1). b, Diagram of bi-allelic integration model. The total percentage of cells with bi-allelic HDR integrations must be the sum of genotypes D, E, and F. While the proportion of cells with genotype E (dual fluor positives) is immediately apparent from the phenotypes, genotypes D and F are not. Our model allow for the de-convolution of the multiple genotypes in the single fluor positive phenotypes, and thus an estimation of the true percentage of cells bi-allelic for HDR. c, The observed level of bi-allelic integrations was higher in cells that acquired at least one integration than would be expected by chance. Individual points represent replicates where the combination of the genes encoding the fluorescent proteins was varied (either GFP + mCherry, GFP + BFP, or mCherry + BFP) as was the amount of the HDR template (3 to 6 μg). d, Bi-allelic HDR analysis was applied across a variety of fluorophore permutations inserted into the RAB11A locus. e, Dual fluorescence bi-allelic integrations were seen across target loci. f, The data also suggest that cells with one mono-allelic integration were more likely to have also undergone a second targeted bi-allelic integration, and this effect was observed across three genomic loci. While the total percentage of cells with an insertion varied with the efficiency of each target site, the fold enrichment in the observed percentage of homozygous cells over that predicted by random chance was largely consistent across loci. g, Co-delivery of three fluorescent-tags targeting the RAB11A locus resulted in only a few cells that expressed all three fluorophores, consistent with a low rate of off-target integrations. As a maximum of two targeted insertions are possible (at the locus’ two alleles; assuming a diploid genome), no cells positive for all three loci should be observed (triple positives). Indeed, while large numbers of single fluorophore integrations were observed (single positives), as well as cells positive for the various permutations of two fluorophores (double positives), there was a ~30 fold reduction in the number of triple positive cells compared to double positives. All flow cytometric analysis of fluorescent protein expression shown here was performed 4 days following electroporation. h, Multiplex editing of combinatorial sets of genomic sites would support expanded research and therapeutic applications. We tested whether multiple HDR templates could be co-delivered along with multiple RNPs to generate primary cells in which more than one locus was modified. Primary human T cells with two modifications were enriched by gating on the cells that had at least one modification, and this effect was consistent across multiple combinations of genomic loci. HDR template permutations from a set of six dsDNA HDR templates (targeting RAB11A, CD4, and CLTA; each site with GFP or RFP) were electroporated into CD3+ T cells isolated from healthy human donors. Four days after electroporation of the two indicated HDR templates along with their two respective on-target RNPs, the percentage of cells positive for each template was analysed by gating on cells either positive or negative for the other template. Not only was two-template multiplexing possible across a variety of template combinations, but gating on cells positive for one template (Template 1+ Cells, Blue) yielded an enriched population of cells more likely to be positive for the second template compared to cells negative for the first (Template 1- Cells, Black). 2 μg of each template, along with 30 pmols of each associated RNP, were electroporated for dual multiplexing experiments. i, We were also able to achieve triple gene targeting and could significantly enrich for cells that had a third modification by gating on the cells with two targeted insertions, an effect again consistent across target genomic loci. 1.5 μg of each template (4.5 μg total) were electroporated together with 20 pmols of each corresponding RNP (60 pmols total). Graphs display mean and standard deviation in n=4 (f-i) independent healthy donors. Other experiment (c-e) were performed in two independent healthy donors.
Extended Data Figure 4:
Extended Data Figure 4:. Examination of off-target integrations with non-viral genome targeting.
a, Results of targeted locus amplification (TLA) sequencing. No off-target integration sites were identified (assays limit of detection ~1% of alleles) with either a dsDNA or ssDNA HDR template in two healthy donors. The on-target RAB11A locus on chromosome 15 is indicated in red. b, The frequency of one observed incorrect HDR mediated integration at the target locus was reduced using a long ssDNA HDR template in two human blood donors (Supplementary Note 2). c, Diagram of HDR mediated insertions at the N-terminus of a target locus. The homology arms specify the exact sequence where the insert (a GFP tag in this case) will be inserted, allowing for scarless integration of exogenous sequences. Because a GFP fusion protein is created, GFP fluorescence will be seen as a result of the on-target integration, which is dependent on an RNP cutting adjacent to the integration site. d, dsDNA can be integrated via homology-independent repair mechanisms at off-target sites through either random integration at naturally occurring dsDNA breaks, or potentially at induced double stranded breaks, such as those at the off-target cut sites of the RNP. This effect can be harnessed to allow for targeted integration of a dsDNA sequence at a desired induced dsDNA break in quiescent cell types which lack the ability to do HDR, but crucially the entire sequence of the dsDNA template is integrated, including any homology arms. In the case that the homology arms contain a promoter sequence (such as for N-terminal fusion tags), these off target integrations can drive observable expression of the inserted sequence without the desired correct HDR insertion. e, We looked for unintended non-homologous integrations with the non-viral system using an N-terminal GFP-RAB11A fusion construct that contained the endogenous RAB11A promoter sequence within its 5’ homology arm. This construct could express GFP at off-target integration sites, which allowed us to assay for off-target events at the single cell level using flow cytometry. Inclusion of a gRNA designed to cut a genome region that is not the homologous region to the targeting sequence can be used to infer integration at an off-target cut site. f, While efficient GFP expression depended on pairing the HDR template with the correct gRNA targeting that site, rare GFP+ cells were observed when dsDNA HDR templates were delivered either alone (~0.1%) or with an “off target” Cas9 RNP (~1%). g, Quantification of different types of functional off-target integrations. The increase in the percentage of fluorescent cells over the limit of detection when the template alone is electroporated likely represents random integrations at naturally occurring dsDNA breaks (although cut-independent integration at the homology site is also possible in theory). Not every off-target integration will yield fluorescent protein expression, but the relative differences in functional off-target expression between different templates and editing conditions can be assayed. Inclusion of an RNP targeting CXCR4 (Off-Target) dramatically increased the observed off-target homology-independent integrations, likely through a homology independent insertion event. As expected, efficient GFP expression as expected was only seen with the correct gRNA sequence and HDR mediated repair. Bars represent observed GFP+ percentages from T cells from one representative donor electroporated with the indicated components. h, Comparisons of on-target GFP expression vs functional off-target integrations across five templates reveal HDR is highly specific, but that off-target integrations can be observed at low frequencies. i, A matrix of gRNAs and HDR templates were electroporated into CD4+ T cells from two healthy donors. The average GFP expression as a percentage of the maximum observed for a given template is displayed. Across six unique HDR templates and gRNAs, on-target HDR mediated integration was the by far most efficient. One HDR template, a C-terminal GFP fusion tag into the nuclear factor FBL, had consistently higher off-target expression across gRNAs, potentially due to a gene-trap effect as the 3’ homology arm for FBL contains a splice-site acceptor followed by the final exon of FBL leading into the GFP fusion. n=2 (a, b, h, i) or n=8 (e, f) independent healthy donors.
Extended Data Figure 5:
Extended Data Figure 5:. Non-viral genome targeting using long ssDNA HDR templates and a Cas9 nickase.
a, Long single-stranded (ss)DNA templates have potential to reduce homology-independent integrations while preserving on-target efficiency. One method to generate long ssDNA templates involves a two-step selective exonuclease digestion that specifically degrades one strand of a PCR product that has been labelled by 5’ phosphorylation, which can be easily added to a PCR primer prior to amplification. b, We also applied a second ssDNA production method based on sequential in vitro transcription (IVT) and reverse transcription (RT) reaction. A PCR product with a short T7 promoter appended serves as an IVT template to produce a ssRNA product. Following annealing of an RT primer and reverse transcription, an RNA/DNA hybrid can formed which can be transformed into a long ssDNA template by incubation in sodium hydroxide, which selectively degrades the RNA strand. c, At 4 days post-electroporation, varying concentrations of a long ssDNA HDR templates (~1.3 kb) did not show the decreased viability observed in CD3+ T cells electroporated with a linear dsDNA HDR template of the same length. d, Electroporation of a ssDNA HDR template reduced off-target integrations to the limit of detection (i.e. comparable to levels seen with no template electroporated) both with no nuclease added and at induced off-target dsDNA breaks (Off-target gRNA + Cas9). e, Diagram of the genomic locus containing the first exon of RAB11A. Use of spCas9 with an individual guide RNA (gRNA 1, “On-Target” in d) along with a dsDNA HDR template integrating a GFP in frame with RAB11A directly after the start codon results in efficient GFP expression (Fig. 1d). Use of a Cas9 nickase (D10A variant) with two gRNAs may reduce the incidence of off-target genome cutting. f, A series of individual gRNAs as well as dual gRNA combinations were tested for GFP insertion efficiency at the RAB11A N-terminal locus. As expected, no gRNAs showed appreciable levels of GFP insertion when using a nuclease dead Cas9 (dCas9). Multiple individual gRNAs that cut adjacent to the insertion site showed GFP integration when used with Cas9, but none were as efficient as gRNA 1. The D10A nickase showed little to no GFP integration with individual guides, but multiple two-guide combinations showed efficient GFP integration. Only in gRNA combinations where the two PAM sequences were directed away from each other (PAM Out) was GFP integration seen. g, GFP integration efficiencies as presented in (f) but graphed on a logarithmic scale reveal lower levels of functional off-target integrations when using the D10A nickase compared to spCas9 (with an individual “off-target” gRNA, targeting CXCR4), likely due to the requirement for the D10A nickase to have two gRNAs bound in close proximity to induce a dsDNA break. h, Long ssDNA templates (~1.3kb) could be successfully combined with Cas9 nickases (D10A) for targeted integration, similar to linear dsDNA templates. Here, long ssDNA HDR templates with D10A nickase showed lower efficiencies of GFP integration at the RAB11A site, but this appeared to be site specific; the combination of long ssDNA and D10A appeared to have higher efficiencies compared to dsDNA and Cas9 at a different site (Fig. 3d). n=2 (c, d, f, g) or n=3 (h) independent healthy donors with mean (c, d, f-h) and standard deviation (h).
Extended Data Figure 6:
Extended Data Figure 6:. Reduced Treg frequencies and function in subjects with two loss of function IL2RA mutations.
a, CD4+ T cells from a healthy donor and all family members, including IL2RA heterozygotes (c.530 het 1, c.800 hets 1-3) as well as compound heterozygous children (Comp. Hets 1-3), with loss-of-function IL2RA mutations were analysed by flow cytometry to assess the presence of IL2RAhiCD127lo Tregs. b, In healthy donors and individuals with only one IL2RA mutation, CD4+FoxP3+ T cells are predominantly IL2RAhiCD127lo. In the compound heterozygotes, a CD127loCD4+FoxP3+ population is present, but does not express high levels of IL2RA. c, Clinical phenotyping performed at two separate sites showed that compound heterozygotes have CD127loFoxP3+ cells. d, Deficiency in IL2RA surface expression in compound heterozygote 3 led to aberrant downstream signalling as measured by phosphorylated (p)Stat5 expression after stimulation with IL-2, but not IL-7 or IL-15. e, Due to the inability to sort IL2RAhi Tregs from the IL2RA-deficient compound heterozygotes, FoxP3+ cells were enriched from CD4+ using an alternate gating strategy that employed the surface markers CD127loCD45RO+TIGIT+. Intracellular FoxP3 staining of T cells from the indicated gated population is shown. f, While these CD3+CD4+CD127loCD45RO+TIGIT+ potential “Tregs” were highly enriched for FoxP3 and showed some suppressive capacity when cultured with CFSE-labelled stimulated responder T cells (Tresps) from healthy donors, CD3+CD4+CD127loCD45RO+TIGIT+ from the compound heterozygotes showed no suppressive ability. Stimulated Tresp population (Solid curves), non-stimulated Tresp (Dashed curve). g, Correction of either IL2RA mutation in the compound heterozygotes individually would still leave the other mutation, leaving the cells as single heterozygotes. To confirm that such a potential correction would result in some level of functional suppression, we assessed the suppressive ability of CD4+IL2RAhiCD127lo Tregs from the c.530 and c.800 single heterozygote family members as in (f). h, Dot plot summaries of Treg suppressive ability in cells from healthy donors [n=3 with single (top) or twelve (bottom) technical replicates], IL2RA-deficient compound heterozygotes (f, n=3 total patients) and IL2RA+/− c.530 or c.800 heterozygotes (g, n=4 total patients). While CD3+CD4+CD127loCD45RO+TIGIT+ “Tregs” from compound heterozygotes showed no suppressive ability, conventional CD4+IL2RAhiCD127lo Tregs from the single heterozygote family members showed some suppressive capacity, consistent with their lack of a pronounced clinical phenotype compared to the compound hets. Thus, correcting functional IL2RA expression on the surface of FOXP3+ T cells from these patients may represent a viable approach for developing an ex vivo gene therapy. Mean value is displayed. i, Initial genetic testing of the proband (Supplementary Note 3) using an in-house targeted next-generation sequencing multi-gene panel of over 40 genes known to be involved in monogenic forms of diabetes was negative. Subsequent exome sequencing in the trio of proband and parents revealed two causative mutations in the IL2RA gene. The mother possessed a single heterozygous mutation (c.530G>A) in exon 4 of IL2RA, resulting in a premature stop codon. The father possessed a single heterozygous mutation (c.800delA) in exon 8 of IL2RA, resulting in a frameshift mutation leading to a 95 amino acid long run-on. Sanger sequencing confirmed that the proband was a compound heterozygote with both mutations. A gRNA was designed to cut adjacent to the site of each mutation, 8 bps away for c.530 mutation (Blue), and 7 bps away for c.800 (Red). For each mutation, an HDR template was designed including the corrected sequence (Green) as well as a silent mutation in a degenerate base to disrupt the PAM sequence (“NGG”) for each guide RNA. Displayed genomic regions (not to scale) for c.530 mutation site (hg38 ch10:6021526-6021557) and c800 mutation site (hg38 ch10:6012886-6012917).
Extended Data Figure 7:
Extended Data Figure 7:. HDR mediated correction of IL2RA c.530A>G loss of function mutation.
a,Unlike the gRNA targeting the c.800delA mutation at the C-terminus of IL2RA (Extended Data Fig. 8), the gRNA targeting the c.530A>G mutation (causing a stop codon in an interior exon) results in substantial (~90%) loss of IL2RA cell surface expression in a healthy donor and single heterozygotes (c.800 Het 2 and 3) 2 days following electroporation of the RNP alone (Blue) into CD3+ T cells. While starting from a very small IL2RA+ percentage, this reduction was observed in all three compound heterozygotes, potentially because a small amount of protein can be surface expressed from the c.800delA allele. This reduced IL2RA expression could be partially rescued by inclusion of an ssODN HDR template (Green) and even more substantially rescued using a large dsDNA HDR template (Yellow). Both template types contained the corrected sequence, a silent mutation to remove the gRNA’s PAM sequence, and either 60 bp (ssODNs) or ~300 bp (large dsDNA) homology arms (Extended Data Fig. 6i). b, Amplicon sequencing of the c.530 site in select patients shows the correlation between IL2RA cell surface expression and genomic correction. Small numbers of reads in the “No Electroporation” and “RNP only” conditions were called as HDR, potentially due to small amounts of cross-well contamination. c, Increased phosphorylated (p)Stat5 in response to IL-2 stimulation (200 U/mL) 7 days following electroporation in CD3+ T cells from compound heterozygote patients undergoing HDR mediated mutation correction compared to no electroporation or RNP only controls. pStat5+ cells correlated with increased IL2RA surface expression. d, Similarly, increased proportions of IL2RA+FoxP3+ cells are seen 9 days following electroporation in the HDR correction conditions in compound heterozygote patients. Lower percentages of correction were seen when targeting the c.530 mutation for HDR correction in compound heterozygote 3, potentially due altered cell-state associated with the patient’s disease or the patient’s immunosuppressive drug regimen (Supplementary Table 4). e, Mutation correction was possible in sorted Treg-like cells from the affected patients. CD3+CD4+CD127loCD45RO+TIGIT+ “Tregs”, a population highly enriched for FoxP3+ cells (Extended Data Fig. 6e), identified without the traditional Treg IL2RA surface marker (absent due to the causative mutations), were FACS sorted and underwent correction of the c.530A>G mutation using a Cas9 nuclease and short ssDNA HDR template (ssODN). After 12 days in culture, during which time the cells expanded >100 fold, greater than 20% (compound het 1) and 40% (compound het 2) of targeted cells expressed IL2RA on their surface, demonstrating functional correction and expansion of a therapeutically relevant cell type. In these experiments, expansion was less robust for cells from compound het 3. f, After 12 days in culture, corrected “Treg” cells from compound het 2, and a female healthy control, were sorted based on IL2RA and CD62L expression. Methylation of the TSDR (Treg-specific demethylated region) of FOXP3 intron 1 was analyzed in the indicated sorted cell populations by bisulfite sequencing (Epigendx). Due to X-chromosome inactivation, incomplete demethylation is observed in the control Treg populations from the female healthy donor. The sorted IL2RA-high CD62L-high population of corrected “Tregs” showed increasing TSDR demethylation, whereas similarly edited and expanded CD4+ T effector cells (Teff) did not show substantial TSDR demethylation in the healthy donor or in corrected cells from compound heterozygote 2. All electroporations were performed according to optimized non-viral genome targeting protocol (Methods). For ssODN electroporations, 100 pmols in 1 μL water were electroporated.
Extended Data Figure 8:
Extended Data Figure 8:. HDR and non-HDR mediated correction of IL2RA c.800delA frameshift loss-of-function mutation.
a,Histograms of IL2RA surface expression in CD3+ T cells in all children from a family carrying two loss-of-function IL2RA mutations, including three compound heterozygotes that express minimal amounts of IL2RA on the surface of the T cells (No electroporation, Grey). Two days following electroporation of an RNP containing a gRNA for the site of one of the two mutations, a one base pair deletion in the final exon of IL2RA (c.800delA) causing a run-on past the normal stop codon, CD3+ T cells from a healthy donor and single hets (c.800 Het 2 and 3) showed slight increases in IL2RA- cells (RNP only, Blue). This modest reduction is potentially due to the gRNA targeting the C-terminus of the protein where small indels may cause less pronounced loss of surface protein expression. Surprisingly, the RNP alone resulted in IL2RA surface expression in almost 50% of edited T cells in all three compound heterozygotes. In cells from two of the compound heterozygous children, increases in the percent of cells with IL2RA correction compared to RNP only could be achieved by inclusion of an ssODN HDR template sequence with the mutation correction (RNP+ssODN, Green), and further increased at this site when using a longer dsDNA HDR template to correct the mutation (RNP + dsDNA HDRT, Yellow) (Extended Data Fig. 6i). b, Amplicon sequencing was performed in select targeted patient cells. c, Stat5 phosphorylation (pStat5) in response to high dose IL-2 stimulation (200 U/mL) in targeted CD3+ T cells following 7 days of expansion post-electroporation. Increased numbers of pStat5+ cells correlated with increased IL2RA surface expression (a). d, Following 9 days of expansion post-electroporation, intracellular FoxP3 staining revealed an increased proportion of IL2RA+ FoxP3+ cells in CD3+ T cells compared to no electroporation controls. Electroporations were performed according to optimized non-viral genome targeting protocol (Methods). For ssODN electroporations, 100 pmols in 1 μL water were electroporated. e, Flow cytometric analysis of GFP expression 6 days following electroporation of a positive HDR control RAB11A-GFP dsDNA HDR template into CD3+ T cells from the indicated patients revealed lower GFP expression in the three compound heterozygotes compared to their two c.800 heterozygote siblings. Compared to a cohort of twelve healthy donors similarly edited (Fig. 1d), both c.800 heterozygotes as well as compound het 1 and 2 were within the general range observed across healthy donors, whereas compound het 3 had lower GFP expression than any healthy donor analysed. Of note, in compound het 3 HDR mediated correction at the c.530 mutation was substantially lower than the other two compound heterozygotes (Fig. 3b). IL2RA surface expression after electroporation of the c.800delA targeting RNP alone was similar though. Compared to HDR-mediated repair, NHEJ mediated frameshift correction at c.800delA may be less dependent on cell proliferation, consistent with compound het 3 being the only compound heterozygous patient on active immunosuppressants at the time of blood draw and T cell isolation (Supplementary Note 3). f, Altered cell-state associated with the patient’s disease could also contribute to diminished HDR rates. TIGIT and CTLA4 expression levels in non-edited, isolated CD4+ T cells from each indicated patient was measured by flow cytometry. Consistent with altered cell states and or/ cell populations, cells from compound het 3 had a distinct phenotype, with increased TIGIT and CTLA4 expression compared both to healthy donors, the single heterozygous family members, as well the other two compound heterozygous siblings.
Extended Data Figure 9:
Extended Data Figure 9:. Endogenous TCR replacement strategy and functional characterization.
a-d, Schematic description of HDR template for endogenous TCR replacement by in-frame integration of a new TCR-β chain and a new variable region of a TCR-α chain at the TCR-α locus and the new TCR’s subsequent transcription and translation. e, HDR template for endogenous TCR replacement at the TCR-β locus. f, Multiplexed integration of a new TCR-α at the TCR-α locus and a new TCR-β at the TCR-β locus. Detailed description of TCR replacement strategy in Supplementary Note 4. g, TCR mispair analysis after retroviral delivery or non-viral TCR replacement of an NY-ESO-1 specific TCR in gated CD4+ or CD8+ T cells. With viral introduction of the new TCR, an infected cell will potentially express at least four different TCRs (new TCR-α + new TCR-β; new TCR-α + endogenous TCR-β; endogenous TCR-α and new TCR-β; endogenous TCR-α + endogenous TCR-β). Staining for the specific beta chain in the new introduced TCR (VB13.1) along with MHC-peptide multimer (NYESO) can provide a rough estimate of TCR mispairing by distinguishing between cells that predominantly expressed the introduced TCR (VB13.1+ NYESO+; new TCR-α + new TCR-β) vs those that expressed predominantly one of the potential mispaired TCRs (VB13.1+ NYESO-; endogenous TCR-α + new TCR-β). h, i, TCR replacement by targeting an entire new TCR into TRAC (a-d, also possible with a multiplexed knockout of TCR-β), an entire new TCR into TRBC1/2 (f), or multiplexed replacement with a new TCR-α into TRAC and a new TCR-β into TRBC1/2. j, Functional cytokine production was observed selectively following antigen exposure in gated CD4+ T cells, similarly to gated CD8+ T cells (Fig. 4c). k, Non-viral TCR replacement was consistently observed at four days post electroporation in both CD8+ and CD4+ T cells across a cohort of six healthy blood donors. l, In a second cohort of six additional healthy blood donors, 100 million T cells from each donor were electroporated with the NY-ESO-1 TCR replacement HDR template and on-target gRNA/Cas9 (Fig. 4f). The percentage of CD4+ and CD8+ T cells that were NY-ESO-1 TCR+ was consistent over ten days of expansion following electroporation. m, Over 10 days of expansion following non-viral genome targeting, CD8+ T cells showed a slight proliferative advantage over CD4+ T cells. n, The indicated melanoma cell lines were co-incubated with the indicated sorted T cell populations at a ratio of 1:5 T cells to cancer cells. At 72 hours post co-incubation the percent cancer cell confluency was recorded with by automated microscopy (where nuclear RFP marks the cancer cells). T Cells expressing the NY-ESO-1 antigen specific TCR, either by retroviral transduction (Black) or by non-viral knock-in endogenous TCR replacement (Red) both showed robust target cell killing only in the target cancer cell lines expressing both NY-ESO-1 and the HLA-A*0201 class I MHC allele. o, To ensure that target cell killing by non-viral TCR replacement T cells (Red) was not due to the either the gRNA or the HDR template used for TCR replacement alone, a matrix of on/off target gRNAs and on/off target HDR templates was assayed for target cell killing of the NY-ESO-1+ HLA-A*0201+ A375 cancer cell line (off-target gRNA and HDRT were specific for RAB11A-GFP fusion protein knock-in). Only cells with both the on-target gRNA as well as the on-target HDR template demonstrated target cell killing. p, Sorted NY-ESO-1+ TCR+ cells from a bulk T cell edited population (on-target gRNA, on-target HDR template) showed a strong dose-response effect for target cancer cell killing. Within 48 hours T cell to cancer cell ratios of 2:1 and greater showed almost complete killing of the target cancer cells. By 144 hours, T cell to cancer cell ratios of less than 1:16 showed evidence of robust target cell killing. q, Target cell killing by non-viral TCR replacement T cells was due specifically to the NY-ESO-1-recognizing TCR+ cell population observed by flow cytometry after non-viral TCR replacement (Fig. 4b). Starting with the bulk edited T cell population (all of which had been electroporated with the on-target gRNA and HDR template), we separately sorted three populations of cells: the NY-ESO-1+TCR+ cells (non-virally replaced TCR) (red), the NY-ESO-1-TCR- cells (TCR knockout) (grey), and the NY-ESO-1-TCR+ cells (those that retained their native TCR but did not have the NY-ESO specific knock-in TCR) (orange). Only the sorted NY-ESO-1+ TCR+ population demonstrated target cell killing (4:1 T cell to cancer cell ratio). One representative donor from n=2 (g, j) or n=3 (h, i) independent healthy donors with mean and standard deviation of technical triplicates (j). Mean and standard deviations of n=6 independent healthy donors (l, m) or of four technical replicates for n=2 independent healthy donors (o-q) are shown. Mean and individual values for n=2 independent healthy donors (n).
Extended Data Figure 10:
Extended Data Figure 10:. In vivo functionality of T cells with non-viral TCR replacement.
a,Diagram of in vivo human antigen specific tumour xenograft model. 8 to 12 week old NSG mice were seeded with 1×10⁶ A375 cells (human melanoma cell line; NY-ESO-1 antigen+ and HLA-A*0201+) subcutaneously in a shaved flank. Primary human T cells edited to express an NY-ESO-1 antigen specific TCR were generated (either through lentiviral transduction or non-viral TCR replacement), expanded for 10 days following transduction or electroporation, and frozen. Either a bulk edited population was used (b,c) or a NY-ESO-1 TCR+ sorted population (d-f) was used. At seven days post tumour seeding, T cells were thawed and adoptively transferred via retro-orbital injection. b, Two days following transfer of 5×10⁶ bulk non-virally targeted T cells (~10% TCR+ NYESO-1+ (Red), ~10% TCR+ NYESO-1- (Orange), and ~80% TCR- NYESO-1- (Green), see Fig 4b), NY-ESO-1+ non-virally edited T cells preferentially accumulated in the tumour vs. the spleen. n=5 mice for each of four human T cell donors. c, Ten days following transfer of 5×10⁶ bulk non-virally targeted CFSE labeled T cells, NYESO-1 TCR+ cells showed greater proliferation than TCR- or TCR+NYESO-1- T cells, and showed greater proliferation (CFSE Low) in the tumour than in the spleen. At ten days post transfer TCR- and TCR+NYESO- T cells were difficult to find in the tumour (Fig 4g). d, Individual longitudinal tumour volume tracks for data summarized in Fig 4h. 3×10⁶ sorted NY-ESO-1 TCR+ T cells generated either by lentiviral transduction (Black) or non-viral TCR replacement (Red) were transferred on day 7 post tumour seeding and compared to vehicle only injections until 24 days post tumour seeding. Note that the same data for vehicle control data are shown for each donor in comparison to lentiviral delivery (above) and non-viral TCR replacement (below). e,f, In these experiments, seventeen days following T cell transfer (d), non-virally TCR replaced cells appeared to show greater NY-ESO-1 TCR expression and lower expression of exhaustion markers. Transfer of both lentivirally transduced and non-viral TCR replaced cells showed significant reductions in tumour burden on day 24. In this experimental model, non-viral TCR replacement showed further reductions compared to the lentiviral transduction (Fig. 4h), potentially due to knockout of the endogenous TCR, endogenous regulation of the new TCR’s expression, some difference in the cell populations amenable to non-viral vs lentiviral editing, or confounding variables in cell handling between lentiviral transduction and non-viral genome targeting. n=4 (b), n=2 (d-f), or n=1 (c) independent healthy donors in 5 (b, c) or 7 mice (d-f) per donor with mean (b, e, f) and standard deviation (b).
Figure 1:
Figure 1:. Efficient non-viral genome targeting in primary human T cells.
a, HDR mediated integration of a GFP fusion tag to the housekeeping gene Rab11A. b, Development and optimization of non-viral genome targeting for both cell viability and HDR efficiency. c, Insertion of a GFP fusion into the endogenous RAB11A gene using non-viral targeting in primary human CD4+ and CD8+ T cells. d, Average efficiency with the RAB11A-GFP HDR template was 33.7% and 40.3% in CD4+ and CD8+ cells respectively. e, Viability (number of live cells relative to non-electroporated control) after non-viral genome targeting averaged 68.6%. Efficiency and viability were measured 4 days following electroporation. Mean of n=12 independent healthy donors displayed (d-e). See also Extended Data Fig 1.
Figure 2:
Figure 2:. Individual and multiplexed modification of endogenous T cell genes.
a, Non-viral genome targeting with GFP-fusion constructs into multiple endogenous genes. b, Confocal microscopy of live human T cells electroporated with the indicated HDR templates confirmed fusion-protein localization. Scale = 5 μm. c, GFP fused to the endogenous transcription factor BATF enabled genome-wide binding analysis (CUT&RUN) using anti-GFP or anti-BATF antibodies. d, RAB11A-fusions produced GFP positive CD4+ and CD8+ cells, whereas the CD4-fusions were selectively expressed in CD4+ cells. e, Bi-allelic non-viral genome targeting of two distinct fluorescent proteins into the same locus. f, Multiplexed non-viral genome targeting of HDR templates into two separate genomic loci. g, Simultaneous targeting of three distinct genomic loci. Cells positive for one (Q-II, Q-III) or two integrations (Q-IV), were highly enriched for a third HDR integration. One representative donor displayed from n=6 (a), n=4 (b, d-g), or n=2 (c) independent healthy donors. See also Extended Data Figs 2, 3.
Figure 3:
Figure 3:. Monogenic autoimmune mutations corrected by non-viral genome targeting.
a, Pedigree of family with monogenic immune disease caused by compound heterozygous mutations in IL2RA (Supplementary Table 4). b, Correction of c.530A>G IL2RA mutation by non-viral genome targeting in three compound heterozygous siblings rescued IL2RA cell surface expression on CD3+ T cells 2 days following electroporation. c, 7 days after non-viral genome targeting, targeted unselected CD3+ T cells showed increased phosphorylation levels of Stat5 upon IL-2 stimulation compared to non-targeted controls. d, Non-viral genome targeting corrected the c.800delA mutation using D10A nickase and a long ssDNA HDR template. IL2RA surface expression measured after 9 days of ex-vivo expansion following electroporation (2 days following re-stimulation). n=3 compound heterozygous patients per correction. See also Extended Data Figs 6, 7, 8.
Figure 4:
Figure 4:. Replacement of the endogenous TCR by non-viral genome targeting.
a, Schematic of HDR template used to replace the endogenous TCR. b, Non-viral genome targeting successfully replaced the endogenous TCR with the NY-ESO-1 antigen specific 1G4 TCR. c, Antigen-specific cytokine production and degranulation in CD8+ T cells with the replaced TCR. d, Antigen-specific target cell killing by CD8+ T cells with the replaced TCR. e, Melanoma tumour mouse xenograft model. f, Scalability of non-viral replacement of the endogenous TCR for adoptive cell therapy. g, Preferential in vivo localization of NY-ESO-1 TCR+ T cells to the tumour. h, Tumour growth following adoptive transfer of NY-ESO-1 TCR+ non-virally or lentivirally modified or vehicle alone (saline). One representative donor from n=6 (b) or n=2 (c, d) independent healthy donors with mean and standard deviation of technical triplicates (c, d). n=6 (f) or n=2 (g, h) independent healthy donors in 5 (g) or 7 mice (h) with mean and standard deviation (f-h). **P<0.01, ***P<0.001, ****P<0.0001 (Two Way ANOVA with Holm-Sidak’s multiple comparisons test). See also Extended Data Figs 9, 10.

References

    1. Sadelain M, Rivière I & Riddell S Therapeutic T cell engineering. Nature 545, 423–431 (2017). - PMC - PubMed
    1. Rosenberg SA & Restifo NP Adoptive cell transfer as personalized immunotherapy for human cancer. Science (80-. ). 348, 62–68 (2015). - PMC - PubMed
    1. Verhoeyen E, Costa C & Cosset F-L Lentiviral vector gene transfer into human T cells. Methods Mol. Biol. 506, 97–114 (2009). - PubMed
    1. Eyquem J et al. Targeting a CAR to the TRAC locus with CRISPR/Cas9 enhances tumour rejection. Nature 543, 113–117 (2017). - PMC - PubMed
    1. Hale M et al. Homology-Directed Recombination for Enhanced Engineering of Chimeric Antigen Receptor T Cells. Mol. Ther. - Methods Clin. Dev. 4, 192–203 (2017). - PMC - PubMed

Publication types

Substances