. 2018 Jul 10;24(2):429-440.
doi: 10.1016/j.celrep.2018.06.042.

NAD+ Depletion Triggers Macrophage Necroptosis, a Cell Death Pathway Exploited by Mycobacterium tuberculosis

Affiliations

NAD+ Depletion Triggers Macrophage Necroptosis, a Cell Death Pathway Exploited by Mycobacterium tuberculosis

David Pajuelo et al. Cell Rep. .

Abstract

Mycobacterium tuberculosis (Mtb) kills infected macrophages by inhibiting apoptosis and promoting necrosis. The tuberculosis necrotizing toxin (TNT) is a secreted nicotinamide adenine dinucleotide (NAD+) glycohydrolase that induces necrosis in infected macrophages. Here, we show that NAD+ depletion by TNT activates RIPK3 and MLKL, key mediators of necroptosis. Notably, Mtb bypasses the canonical necroptosis pathway since neither TNF-α nor RIPK1 are required for macrophage death. Macrophage necroptosis is associated with depolarized mitochondria and impaired ATP synthesis, known hallmarks of Mtb-induced cell death. These results identify TNT as the main trigger of necroptosis in Mtb-infected macrophages. Surprisingly, NAD+ depletion itself was sufficient to trigger necroptosis in a RIPK3- and MLKL-dependent manner by inhibiting the NAD+ salvage pathway in THP-1 cells or by TNT expression in Jurkat T cells. These findings suggest avenues for host-directed therapies to treat tuberculosis and other infectious and age-related diseases in which NAD+ deficiency is a pathological factor.

Keywords: MLKL; NAD(+); RIPK3; TNT; cell death; mitochondria; necroptosis; toxin; tuberculosis.


Conflict of interest statement

DECLARATION OF INTERESTS

The authors declare no competing interests.

Figures
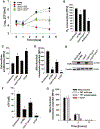
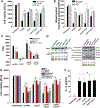
Figure 1.
Figure 1.. The NAD+ Glycohydrolase Activity of TNT Is Important for Intracellular Replication and Indirectly Damages Mitochondria and Inhibits Their Function
(A-F) THP-1 cells were infected with Mtb strains at an MOI of 10:1 and analyzed 48 hr after infection (B-F) or at the indicated time points. (A) Viable intracellular bacterial count (colony-forming units [CFUs] per milliliter). (B) Oxygen consumption was measured with the oxygen-sensitive fluorescent probe p-iso-thiocyanatophenyl, a derivative of platinum(II)-coproporphyrin-I. (C) Extracellular acidification was measured with the pH-sensitive fluorescent probe Eu3+ chelate CS370-diethylenetriaminepentaacetic acid (DTPA)-hydrazide. (D) Mitochondrial membrane potential was analyzed by using a JC-1 dye-based fluorescent probe. (E) Mitochondrial cytochrome c (CytC) release into the cytosol. (F) Cellular ATP concentration was measured with a luminescent ATP detection assay kit. (G) Purified mitochondria from THP-1 cells were incubated in 20 mM Tris and 200 mM NaCl at pH 7.6 with 1 μg of purified WT or non-catalytic mutant (TNTh792n q822k)TNT protein and analyzed for mitochondrial membrane potential status by using a JC-1 dye-based fluorescent probe. Antimycin A (10 μM), inhibitor of complex III of the electron transport chain; carbonyl cyanide-4-(trifluoromethoxy)phenylhydrazone (FCCP) and carbonyl cyanide m-chlorophenyl hydrazone (CCCP) (4 μM), uncouplers of oxidative phosphorylation; β-actin, loading control. Data are represented as mean ± SEM. *p < 0.05, calculated using one-way ANOVA with Dunnett’s correction compared with uninfected (B-F) or non-treated (G) conditions. See Figures S1 and S2 for related data.
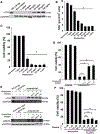
Figure 2.
Figure 2.. TNT Induces Necroptosis in Macrophages Infected with Mtb
THP-1 cells were treated (when indicated) with 10 μM of GSK’872 or necrosulfonamide (NSA) and infected with Mtb strains at an MOI of 10:1 for 48 hr. (A) Cell viability was measured as the total ATP content with a luminescent ATP detection assay kit. (B) Mitochondrial membrane potential was analyzed by using a JC-1 dye-based fluorescent probe. (C) Increase of Mtb intracellular growth (CFUs per milliliter) from 4 hr to 48 hr post-infection. (A-C) *p < 0.05, calculated using one-way ANOVA with Dunnett’s correction compared with non-treated conditions. (D) Western blot for pMLKL (phospho S358), pro- and cleaved caspase-1, pro- and cleaved cas-pase-3, and cleaved caspase-8 in the whole-cell lysates of THP-1 cells infected with Mtb strains. Protein levels relative to uninfected samples (and adjusted fortotal protein loading) were quantitated by densitometry and are represented as the fold increase for the pMLKL panel. (E) Bone marrow-derived macrophages were isolated from mice on a C57BL/6J (Ripk3−/−,Mlkl−/−, Ripk3-Mlk−/− and Casp-3−/−) or mixed C57BL/ 6J-C57BL/6N (Casp-1−/− and Casp-11−/−) genetic background and infected with Mtb strains at an MOI of 10:1, and cell viability (measured as the total ATP content with a luminescent ATP detection assay kit) was analyzed 48 hr post-infection. Statistical analysis (*p < 0.05, calculated using one-way ANOVA with Dunnett’s correction) was performed on each Mtb infection group (uninfected and infected with each Mtb strain) independently. For each infection group, statistical significance was determined between WT C57BL/ 6J mouse macrophages and derived knockouts. (F) Levels of IL-1 β detected by ELISA in supernatants from THP-1 cells infected with Mtb strains at an MOI of 10:1 for 48 hr. *p < 0.05, calculated using one-way ANOVA with Dunnett’s correction compared with the uninfected condition. (G) Data are represented as mean ± SEM. See Figures S3-S5 for related data.
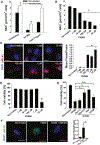
Figure 3.
Figure 3.. TNT Induces Necroptosis in Jurkat T Cells
Expression of TNT in the Jurkat T cell line containing an integrated Tet-regulated TNT expression cassette (Jurkat J655-TNT) was induced with doxycycline for 24 hr. The Jurkat T cell line J644 was included as a control. When indicated, cells were treated with 10 μM of necrostatin-1 s (Nec-1s), GSK’872, or necrosulfonamide. (A) Western blot for TNT (purified specific polyclonal antibody) and GAPDH (loading control) in the whole-cell lysates of Jurkat J655-TNT cells induced with the indicated doxycycline concentrations. Purified WT TNT protein (Figure S2) was included as a control. (B) NAD+ levels of Jurkat J655-TNT cells induced with the indicated doxycycline concentrations. (C) Cell viability measured by trypan blue staining of Jurkat J655-TNT cells induced with the indicated doxycycline concentrations. (D) Cell viability measured by trypan blue staining of Jurkat J644 and J655-TNT cells induced with 1 μg/mL doxycycline in the presence of the RIPK3 and MLKL inhibitors GSK’872 and necrosulfonamide, respectively, and the RIPK1 inhibitor Nec-1 s. (E) Western blot for TNT (purified specific poly clonal antibody), pMLKL (monoclonal pMLKL antibody, phospho S358) and GAPDH (loading control) in the whole-cell lysates of Jurkat J644 and J655-TNT cells induced with 1 μg/mL doxy-cycline or treated with TNF-α, cycloheximide, and zVAD-fmk (T/C/Z) (Cho et al., 2009). Purified WT TNT protein (Figure S2) was included as control. (F) Cell viability measured by trypan blue staining of Jurkat J655-TNT cells induced with 1 μg/mL doxycycline plusthe PARP inhibito rolaparib at the indicated concentrations. *p < 0.05, calculated using one-way ANOVA with Dunnett’s correction compared with the non-treated (B and C) or indicated (D and F) conditions (N.S., not significant). Data are represented as mean ± SEM.
Figure 4.
Figure 4.. NAD+ Depletion Triggers Necroptosis in THP-1 Cells
(A) NAD+ levels of THP-1 cells treated with nicotinamide (5 mM) and infected with Mtb strains at an MOI of 10:1 for 48 hr. (B) NAD+ levels of THP-1 cells treated with the indicated concentrations of FK866 for 6 hr. (C) Immunofluorescence for pMLKL (monoclonal pMLKL antibody, red, phospho S358) and nuclei (DAPI, blue) in THP-1 cells treated with the indicated concentrations of FK866 for 6 hr. Scale bars, 10 μm. Mean pixels per frame analysis of captured images was determined using ImageJ. (D) Cell viability measured by trypan bluestaining of THP-1 cells treated with the indicated concentrations of FK866 for 6 hr. (E) Cell viability measured by trypan blue staining in THP-1 cells treated with 10 μM of FK866, Nec-1s, GSK’872, necrosulfonamide, or R7050 for 6 hr. (F) Immunofluorescence for pMLKL (monoclonal pMLKL antibody, green, phospho S358) and nuclei (DAPI, blue) in THP-1 cells treated with 10 mM of FK866 and/or GSK’872 for 6 hr. Scale bars, 10 μm. Mean pixels per frame analysis of captured images was determined using ImageJ. Data are represented as mean ± SEM. *p < 0.05, calculated using one-way ANOVA with Dunnett’s correction compared with the non-treated (A-D) or the indicated (E and F) conditions.
Figure 5.
Figure 5.. TNT-Dependent Mitochondrial Toxicity Can Be Rescued by NAD+ Replenishment and Enhancement and Protection of Mitochondrial Function
THP-1 cells were pretreated with nicotinamide (5 mM), resveratrol (RSV, 100 μΜ), CoenzymeQ10 (CoQ10,100 μΜ) or cyclosporin A (CsA, 5 μΜ), infected with Mtb strains at an MOI of 10:1, and analyzed after 48 hr. (A) Mitochondrial membrane potential was measured using a JC-1 dye-based fluorescent probe. (B) Cell viability was measured as the total ATP content with a luminescent ATP detection assay kit. (C) Increase of Mtb intracellular growth (CFUs per milliliter) from 4 to 48 hr post-infection. Data are represented as mean ± SEM. *p < 0.05, calculated using one-way ANOVA with Dunnett’s correction compared with non-treated conditions. See Figures S4 and S5 for related data.
Figure 6.
Figure 6.. Mechanism of TNT-Mediated Cell Death of Macrophages Infected with Mtb
After phagocytosis by macrophages, Mtb permeabilizes the phagosomal membrane, enabling TNT to translocate to the cytosol. The enzymatic activity of TNT hydrolyzes cellular NAD+ to nicotinamide (NAM) and ADP-ribose (ADPr). Depletion of the cytosolic NAD+ pool induces three major molecular events. RIPK63 senses lower NAD+ levels and/or increased levels of its degradation products and phosphorylates MLKL (pathway 1), which then forms oligomeric pores in host cell membranes and induces necrotic death (Wang et al., 2014). RIPK3 also migrates, together with Bcl-XL, to mitochondria (pathway 2), prevents caspase-8 activation, and induces formation of the mitochondrial permeability transition (MPT) pore, depolarizing mitochondria (Zhao et al., 2017). The third pathway is a consequence of the connection of the cytosolic and mitochondrial NAD+ pools, as shown previously (Cambronne et al., 2016). Depleting cytosolic NAD+ also strongly reduces NAD+ levels in mitochondria, compromising the electron transport chain (ETC) and ATP synthesis. Dashed lines indicate unknown molecular mechanisms.

Similar articles

Cited by

References

    1. Andreu N, Phelan J, de Sessions PF, Cliff JM, Clark TG, and Hibberd ML (2017). Primary macrophages and J774 cells respond differently to infection with Mycobacterium tuberculosis. Sci. Rep 7, 42225. - PMC - PubMed
    1. Behar SM, Divangahi M, and Remold HG (2010). Evasion of innate immunity by Mycobacterium tuberculosis: is death an exit strategy? Nat. Rev. Microbiol 8, 668–674. - PMC - PubMed
    1. Behar SM, Martin CJ, Booty MG, Nishimura T, Zhao X, Gan HX, Divangahi M, and Remold HG (2011). Apoptosis is an innate defense function of macrophages against Mycobacterium tuberculosis. Mucosal Immunol. 4, 279–287. - PMC - PubMed
    1. Butler RE, Krishnan N, Garcia-Jimenez W, Francis R, Martyn A, Mendum T, Felemban S, Locker N, Salguero FJ, Robertson B, and Stewart GR (2017). Susceptibility of Mycobacterium tuberculosis-infected host cells to phospho-MLKL driven necroptosis is dependent on cell type and presence of TNFα. Virulence 8, 1820–1832. - PMC - PubMed
    1. Cadieux N, Parra M, Cohen H, Maric D, Morris SL, and Brennan MJ (2011). Induction of cell death after localization to the host cell mitochondria by the Mycobacterium tuberculosis PE_PGRS33 protein. Microbiology 157, 793–804. - PMC - PubMed

Publication types

MeSH terms

LinkOut - more resources