. 2018 Jul 10;24(2):453-462.
doi: 10.1016/j.celrep.2018.06.021.

Accommodation of Helical Imperfections in Rhodobacter sphaeroides Argonaute Ternary Complexes with Guide RNA and Target DNA

Affiliations

Accommodation of Helical Imperfections in Rhodobacter sphaeroides Argonaute Ternary Complexes with Guide RNA and Target DNA

Yiwei Liu et al. Cell Rep. .

Abstract

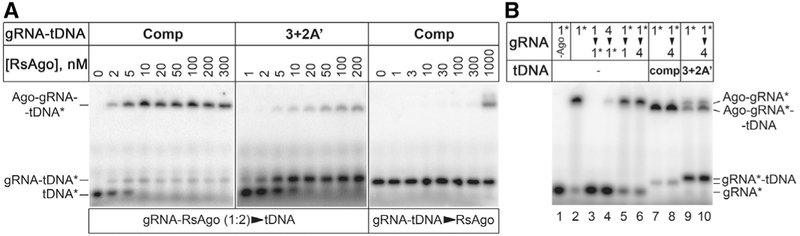
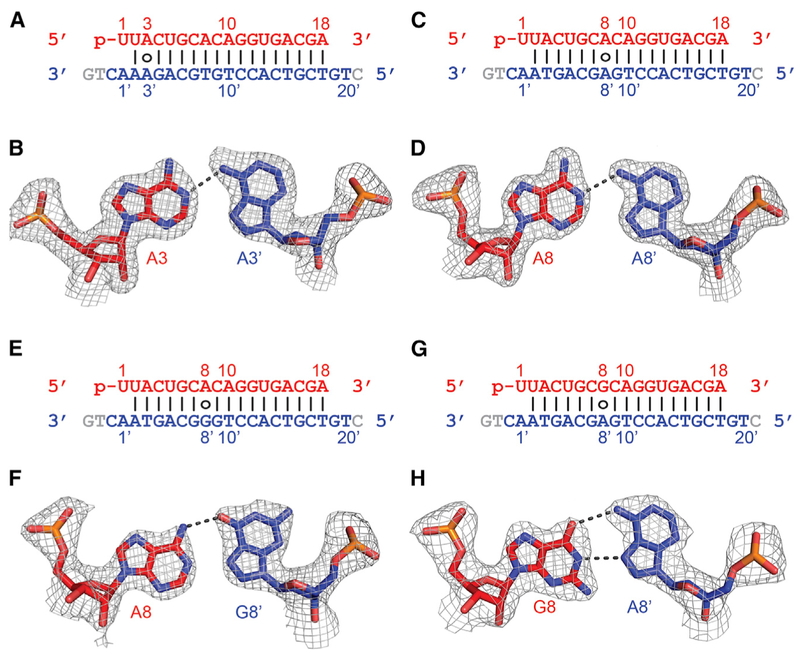
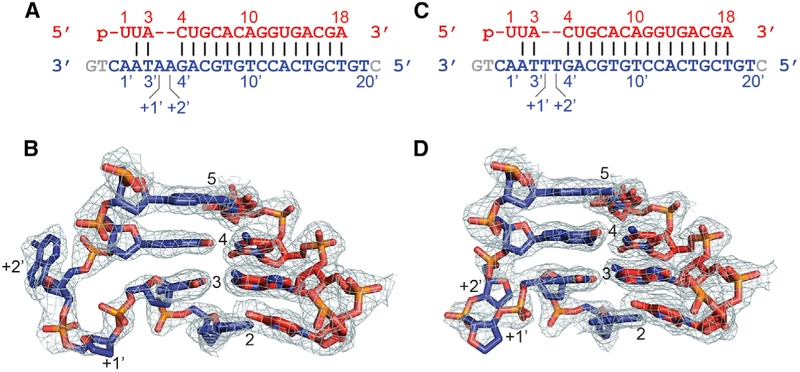
Prokaryotic Argonaute (Ago) proteins were recently shown to target foreign genetic elements, thus making them a perfect model for studies of interference mechanisms. Here, we study interactions of Rhodobacter sphaeroides Ago (RsAgo) with guide RNA (gRNA) and fully complementary or imperfect target DNA (tDNA) using biochemical and structural approaches. We show that RsAgo can specifically recognize both the first nucleotide in gRNA and complementary nucleotide in tDNA, and both interactions contribute to nucleic acid binding. Non-canonical pairs and bulges on the target strand can be accommodated by RsAgo with minimal perturbation of the duplex but significantly reduce RsAgo affinity to tDNA. Surprisingly, mismatches between gRNA and tDNA induce dissociation of the guide-target duplex from RsAgo. Our results reveal plasticity in the ability of Ago proteins to accommodate helical imperfections, show how this might affect the efficiency of RNA silencing, and suggest a potential mechanism for guide release and Ago recycling.

Keywords: RNA-DNA heteroduplex; Rhodobacter sphaeroides Argonaute; RsAgo; guide RNA; non-canonical base pairs and bulges; target DNA.


Figures

Figure 1.
Figure 1.. Structure of RsAgo Bound to gRNA and tDNA
(A) The domain architecture of RsAgo color-coded by domains. (B) The sequence and pairing alignments of 5′-phosphorylated 18-mer gRNA (in red) and 24-mer tDNA (in blue); the nucleotides not observed in the structure are shown in gray. (C and D) 2.1 Å structure of the ternary complex of RsAgo with gRNA and tDNA. The nucleic acid is in a stick representation, while the protein is in a ribbon (C) and a surface (D) representation.
Figure 2.
Figure 2.. Intermolecular Interactions in the Structure of RsAgo Bound to gRNA and tDNA
(A) Schematic listing of the intermolecular contacts in the complex. Hydrogen-bonding, electrostatic and hydrophobic or stacking interactions of protein residues with the bases (rectangles), backbone sugar (pentagons), and phosphate (circles) groups of the gRNA (in red) and tDNA (in blue) are indicated. Protein residues are color-coded by domains. (B) Intermolecular contacts between the gRNA (in red) and tDNA (in blue) strands with residues within the Ago protein in the complex. (C) Positioning of the target strand in the putative catalytic pocket of the PIWI domain in the complex. The putative catalytic residues Gly529, Glu569, His605, and Glu746 are labeled and shown in stick representation. The G9′-T10′-C11′ segment of the target strand is also labeled. Note the positioning of Glu569 in the “unplugged” conformation.
Figure 3.
Figure 3.. Recognition Features of MID-PIWI Pockets in the Structure of RsAgo Bound to gRNA and tDNA and Analysis of RsAgo Interactions with gRNA
(A and B) Positioning of the 5′-pU1pU2 segment of the guide strand in the MID-PIWI domain in the ternary complex. The guide RNA segment is shown in a stick representation, while the protein is shown in a ribbon representation in (A) and in a surface representation in (B). A bound Mg2+ is shown by a purple ball. Hydrogen bonds are shown by dashed lines. (C and D) Positioning of the A1′-A2′ segment of the target strand in the MID-PIWI domain of the complex. The target DNA segment is shown in a stick representation, while the protein is shown in a ribbon representation in (C) and in a surface representation in (D). (E) Sequences of gRNAs used in the binding experiments with wild-type (WT) and R754A RsAgo variants. The apparent Kd values for each gRNA are shown on the right; fold-changes relative to the WT RsAgo are indicated in bold. Means and SDs from three to five independent experiments are shown. (F) Binding of the 5′-U and 5′-A gRNA3 variants by WT and R754A RsAgo. In each experiment, the binding is shown relative to the binding observed at the maximal RsAgo concentration.
Figure 4.
Figure 4.. Apparent Affinities of gRNA-Loaded RsAgo to tDNAs Containing Mismatches at Various Positions
The plot shows apparent Kd values for the binding of complementary and mismatched DNA targets, schematically shown below. The y axis is in the logarithmic scale, and the red line indicates the 5-fold level of the Kd,app value for fully complementary tDNA (1U-A′). The sequences of all oligonucleotides with corresponding Kd values are shown in Figure S4. The data are means and SDs from three to five independent measurements.
Figure 5.
Figure 5.. Analysis of Ternary Complex Formation by Native Gel Electrophoresis
(A) Titration of labeled tDNA with increasing amounts of the preformed gRNA-RsAgo complex (1:2 ratio, RsAgo concentrations are shown at the top) for either fully complementary (“Comp,” left) or 3+2A′ (middle) targets. Titration of preformed gRNA-tDNA duplex with RsAgo (right). (B) Formation of binary and ternary complexes containing labeled gRNA1*. The components were mixed as described in the text; gRNA1 and gRNA4 are indicated as “1” and “4.” The arrowheads indicate the order of addition of the labeled and unlabeled competitor gRNAs; the competitor gRNAs were added either before or 5 min after mixing of RsAgo and gRNA1*, followed by the addition of tDNA (when indicated) and incubation for 20 min at 30°C. The concentrations of gRNA1*, competitor gRNAs, and RsAgo were 20 nM, 1 μM, and 40 nM; tDNA was added to 40 nM. Positions of free nucleic acids and binary and ternary complexes are shown on the sides of the gels. The labeled components in each experiment are indicated with asterisks.
Figure 6.
Figure 6.. Pairing Alignments of A•A′, A•G′, and G•A′ Non-canonical Pairs within the Seed Segment in the Complex of RsAgo with gRNA and tDNA
(A) Sequence alignment of the gRNA-tDNA showing the position of the A3•A3′ non-canonical pair. (B) Pairing alignment of the cis Watson-Crick A3(anti)•Hoogsteen A3′(syn) pair in the ternary complex. The 2Fo-Fc omit electron density map is contoured at 1.0σ. (C) Sequence alignment of the gRNA-tDNA showing the position of the A8•A8′ non-canonical pair. (D) Pairing alignment of the cis Watson-Crick A8(anti)•Hoogsteen A8′(syn) pair in the ternary complex. The 2Fo-Fc omit electron density map is contoured at 1.0σ. (E) Sequence alignment of the gRNA-tDNA showing the position of the A8•G8′ non-canonical pair. (F) Pairing alignment of the cis Watson-Crick A8(anti)•Hoogsteen G8′(syn) pair in the ternary complex. The 2Fo-Fc omit electron density map is contoured at 1.0σ. (G) Sequence alignment of the gRNA-tDNA showing the position of the G8•A8′ non-canonical pair. (H) Pairing alignment of the cis Watson-Crick G8(anti)•Hoogsteen A8′(syn) pair in the ternary complex. The 2Fo-Fc omit electron density map is contoured at 1.0σ.
Figure 7.
Figure 7.. Looping Out of A-A and T-T Bulges on the DNA Target Strand within the Seed Segment in the Complex of RsAgo with gRNA and tDNA
(A) Sequence of the gRNA-tDNA showing the position of the A′(+1)-A′(+2) bulge between residues 3′ and 4′ on the tDNA strand. (B) Structure of the gRNA-tDNA duplex in the vicinity of the looped out A′(+1)-A′(+2) bulge in the ternary complex. The 2Fo-Fc electron density is contoured at 1.0σ. (C) Sequence of the gRNA-tDNA showing the position of the T′(+1)-T′(+2) bulge between residues 3′ and 4′ on the tDNA strand. (D) Structure of the gRNA-tDNA duplex in the vicinity of the looped out T′(+1)-T′(+2) bulge in the ternary complex. The 2Fo-Fc electron density is contoured at 1.0σ.

Similar articles

Cited by

References

    1. Bartel DP (2004). MicroRNAs: genomics, biogenesis, mechanism, and function. Cell 116, 281–297. - PubMed
    1. Bartel DP (2009). MicroRNAs: target recognition and regulatory functions. Cell 136, 215–233. - PMC - PubMed
    1. Boland A, Tritschler F, Heimstädt S, Izaurralde E, and Weichenrieder O (2010). Crystal structure and ligand binding of the MID domain of a eukaryotic Argonaute protein. EMBO Rep. 11, 522–527. - PMC - PubMed
    1. Dahlgren C, Zhang HY, Du Q, Grahn M, Norstedt G, Wahlestedt C, and Liang Z (2008). Analysis of siRNA specificity on targets with double-nucleotide mismatches. Nucleic Acids Res. 36, e53. - PMC - PubMed
    1. Doxzen KW, and Doudna JA (2017). DNA recognition by an RNA-guided bacterial Argonaute. PLoS One 12, e0177097. - PMC - PubMed

Publication types