

Occupational exposure to high-frequency electromagnetic fields and brain tumor risk in the INTEROCC study: An individualized assessment approach
- PMID: 29996112
- PMCID: PMC8851381
- DOI: 10.1016/j.envint.2018.06.038
Occupational exposure to high-frequency electromagnetic fields and brain tumor risk in the INTEROCC study: An individualized assessment approach
Abstract
Introduction: In 2011, the International Agency for Research on Cancer classified radiofrequency (RF) electromagnetic fields (EMF) as possibly carcinogenic to humans (group 2B), although the epidemiological evidence for the association between occupational exposure to RF-EMF and cancer was judged to be inadequate, due in part to limitations in exposure assessment. This study examines the relation between occupational RF and intermediate frequency (IF) EMF exposure and brain tumor (glioma and meningioma) risk in the INTEROCC multinational population-based case-control study (with nearly 4000 cases and over 5000 controls), using a novel exposure assessment approach.
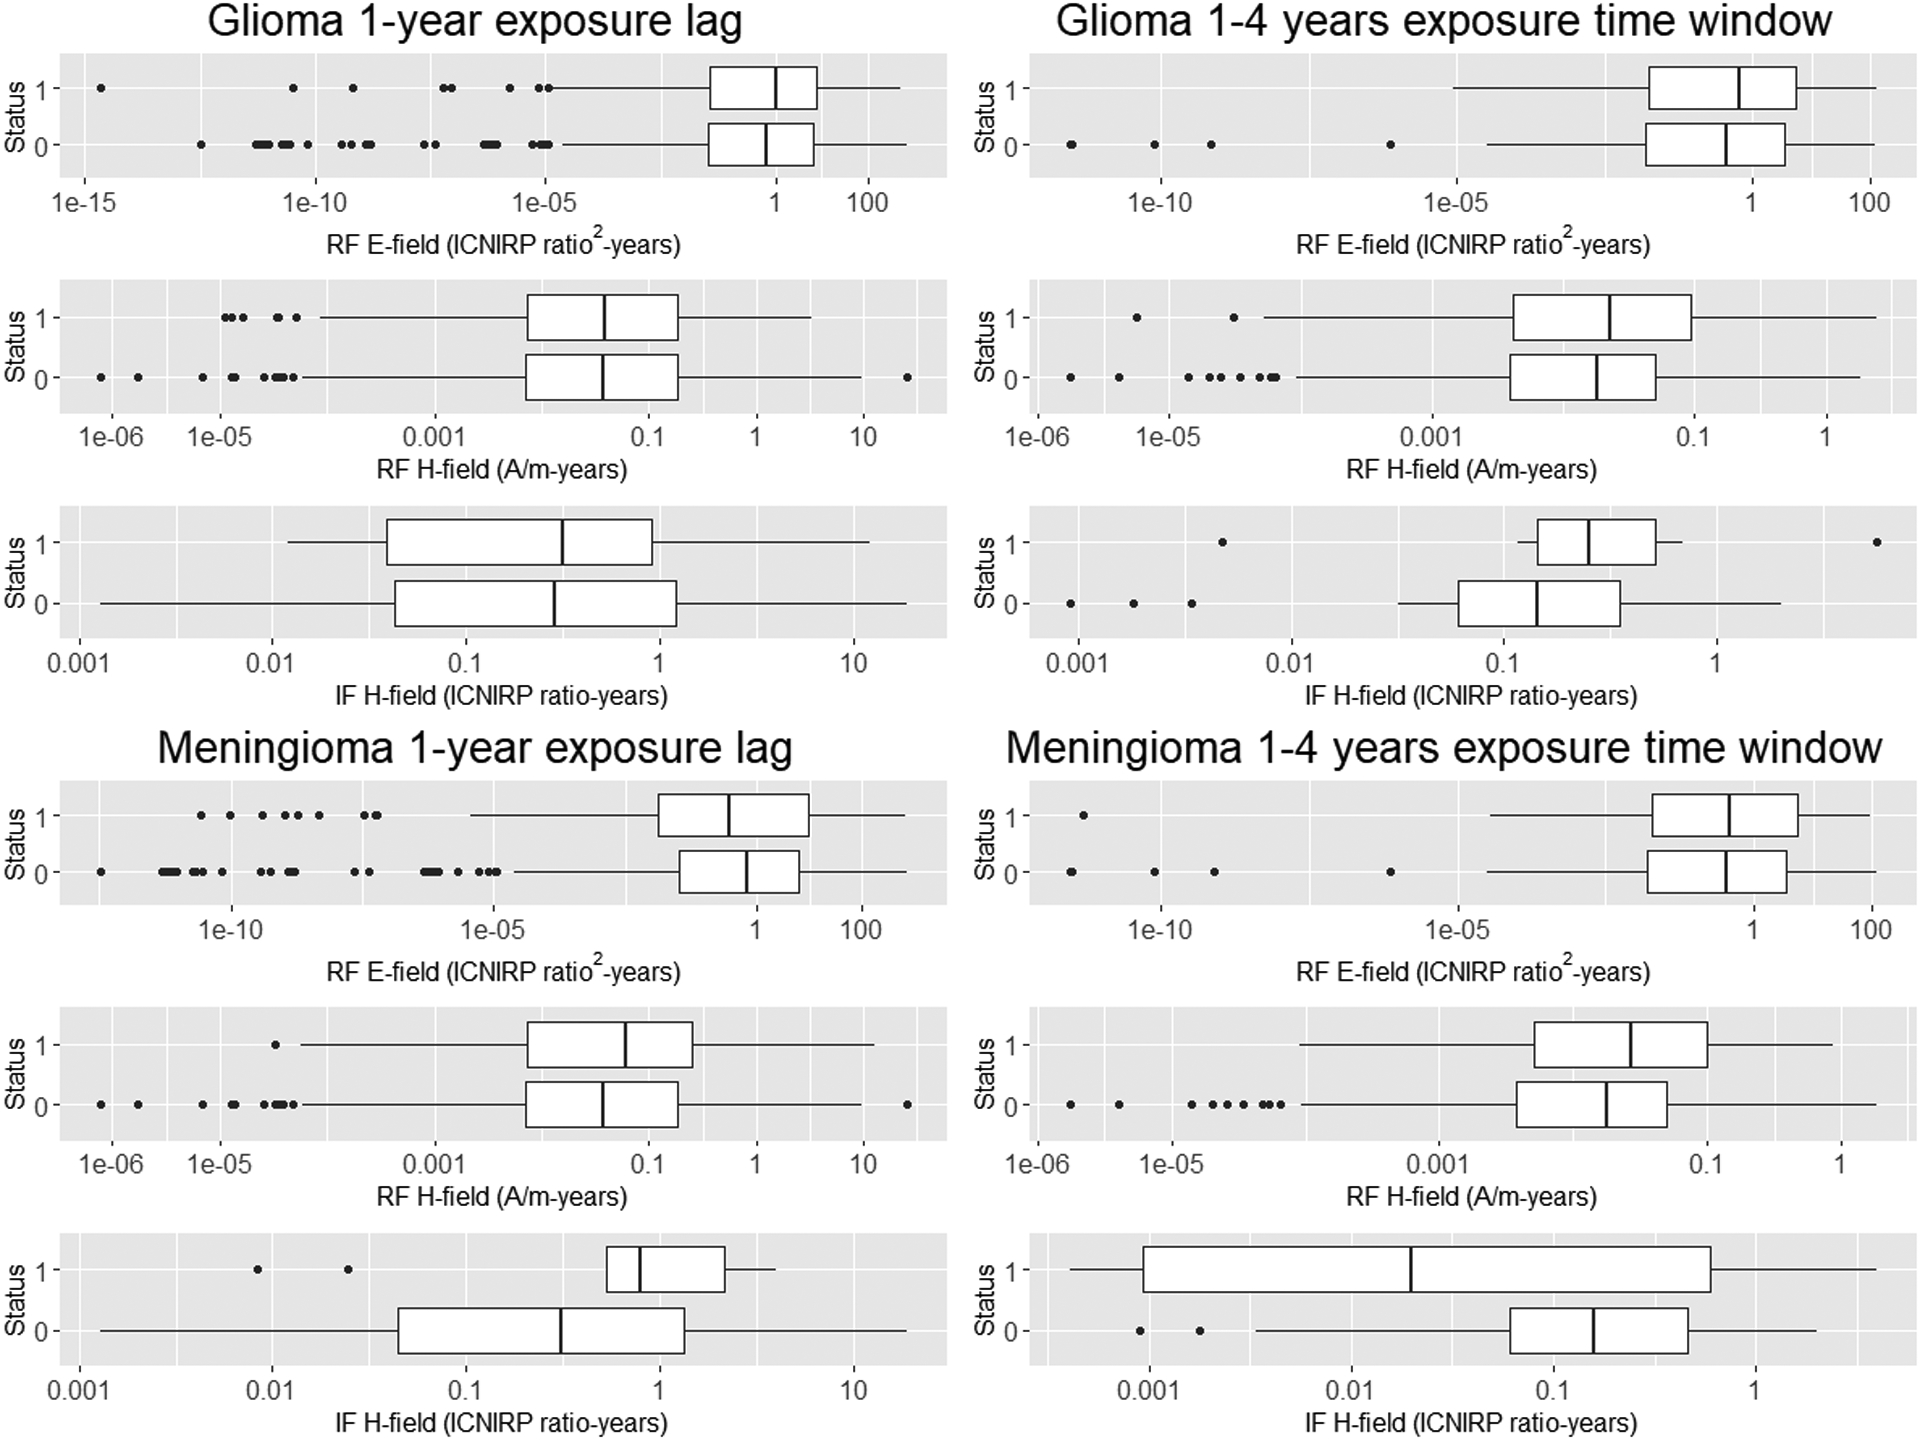
Methods: Individual indices of cumulative exposure to RF and IF-EMF (overall and in specific exposure time windows) were assigned to study participants using a source-exposure matrix and detailed interview data on work with or nearby EMF sources. Conditional logistic regression was used to investigate associations with glioma and meningioma risk.
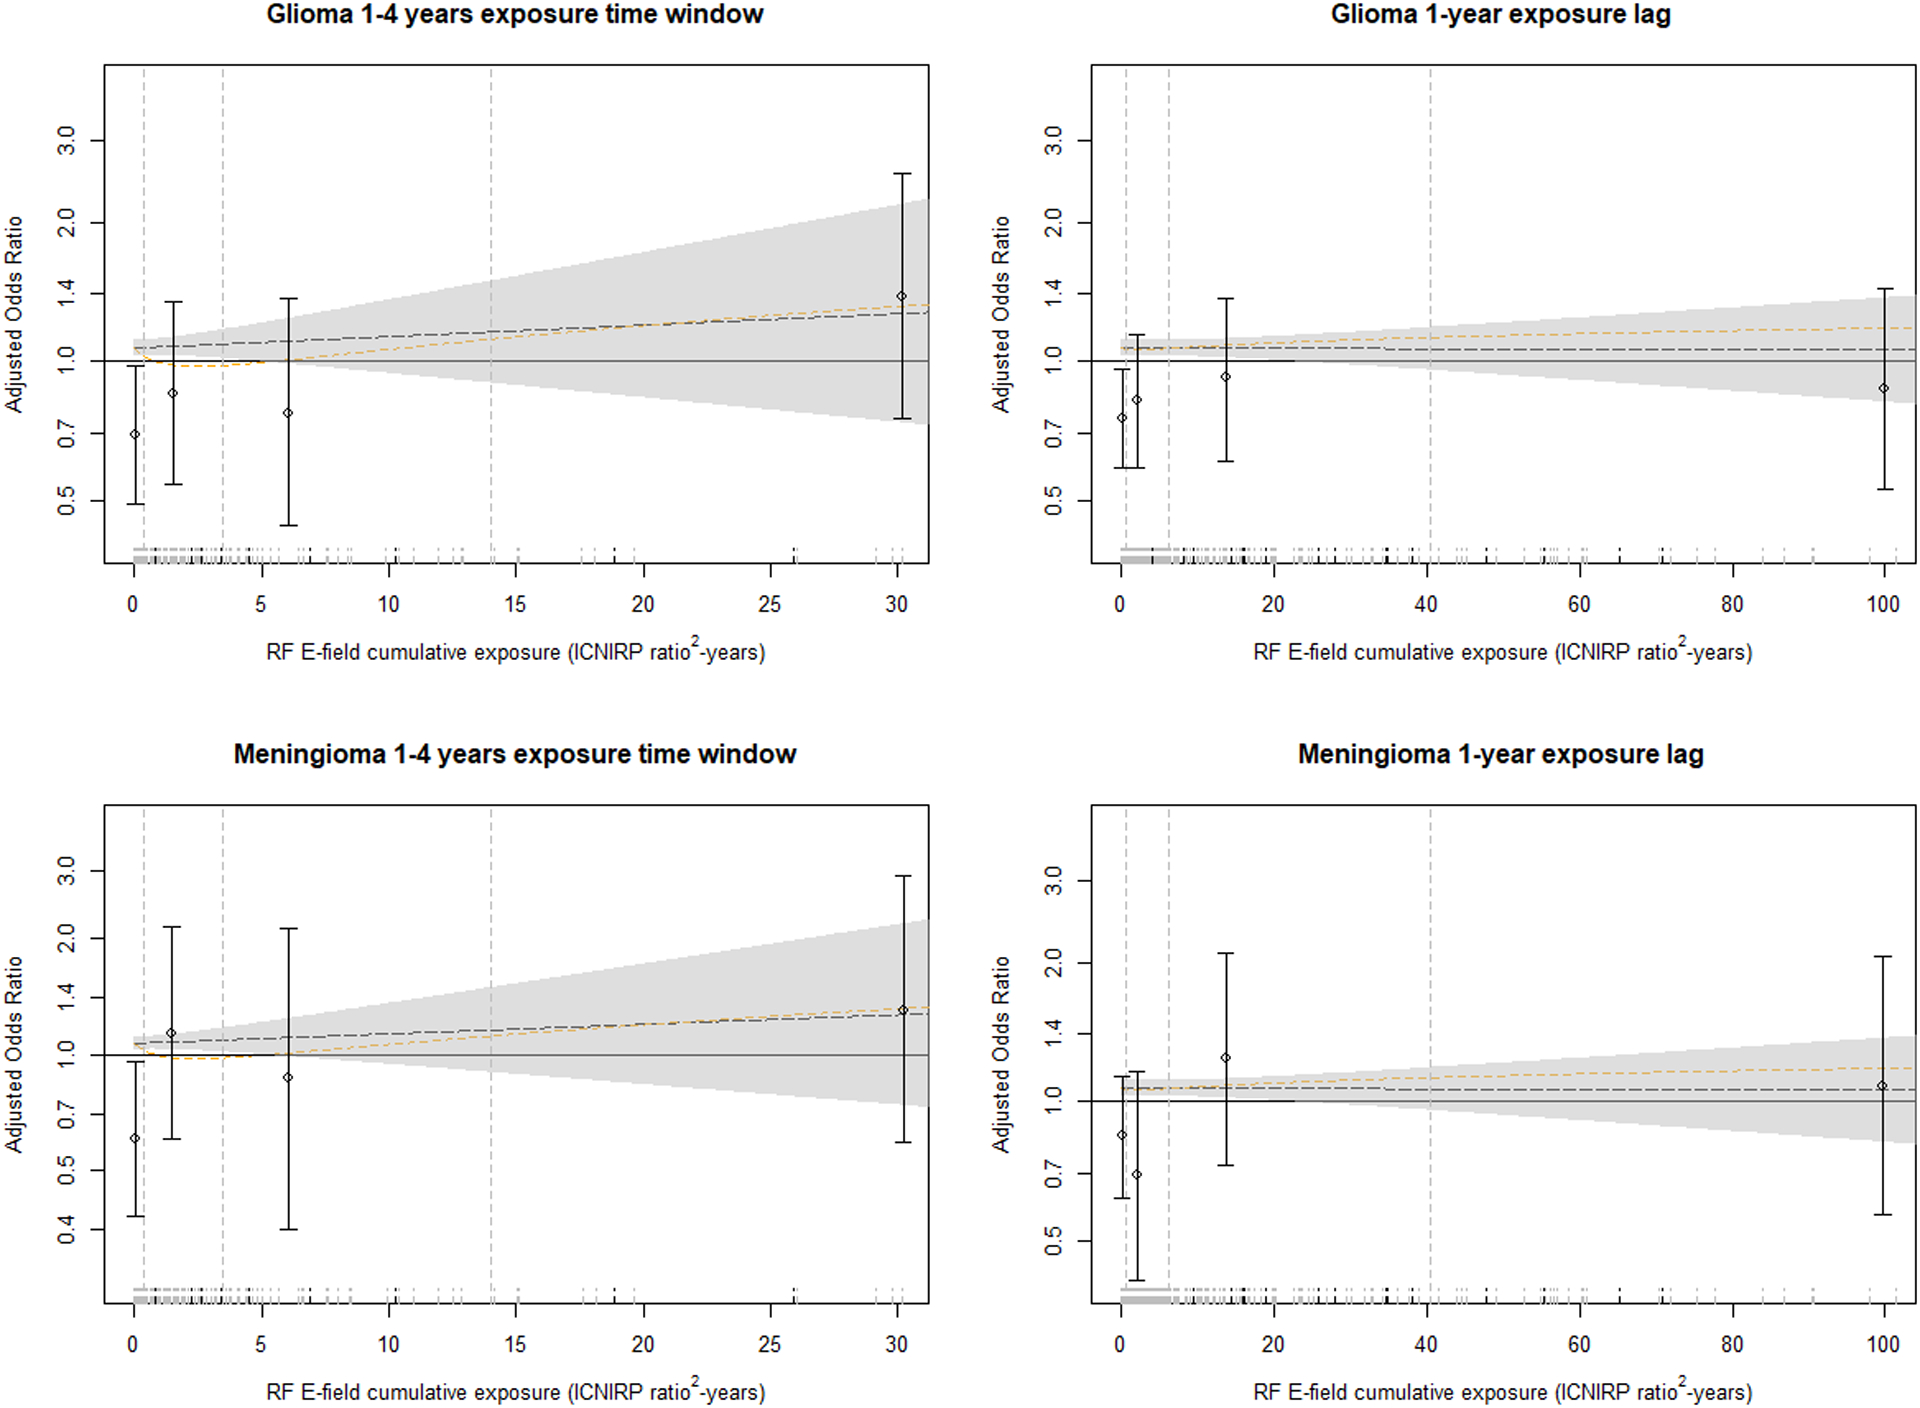
Results: Overall, around 10% of study participants were exposed to RF while only 1% were exposed to IF-EMF. There was no clear evidence for a positive association between RF or IF-EMF and the brain tumors studied, with most results showing either no association or odds ratios (ORs) below 1.0. The largest adjusted ORs were obtained for cumulative exposure to RF magnetic fields (as A/m-years) in the highest exposed category (≥90th percentile) for the most recent exposure time window (1-4 years before the diagnosis or reference date) for both glioma, OR = 1.62 (95% confidence interval (CI): 0.86, 3.01) and meningioma (OR = 1.52, 95% CI: 0.65, 3.55).
Conclusion: Despite the improved exposure assessment approach used in this study, no clear associations were identified. However, the results obtained for recent exposure to RF electric and magnetic fields are suggestive of a potential role in brain tumor promotion/progression and should be further investigated.
Keywords: Brain cancer; EMF; Intermediate frequency; Radiofrequency; Source-exposure matrix; Workers.
Copyright © 2018 Elsevier Ltd. All rights reserved.
Conflict of interest statement
Conflict of interest: The authors have no conflicts of interest to declare.
Figures
Comment in
-
Comments regarding: "Occupational exposure to high-frequency electromagnetic fields and brain tumor risk in the INTEROCC study: An individualized assessment approach".Environ Int. 2018 Dec;121(Pt 1):1024. doi: 10.1016/j.envint.2018.08.008. Epub 2018 Aug 24. Environ Int. 2018. PMID: 30146273
-
Authors' response to the Comments from S.M.J. Mortazavi regarding: "Occupational exposure to high-frequency electromagnetic fields and brain tumor risk in the INTEROCC study: An individualized assessment approach".Environ Int. 2018 Dec;121(Pt 1):1025-1026. doi: 10.1016/j.envint.2018.08.007. Epub 2018 Aug 28. Environ Int. 2018. PMID: 30170868 No abstract available.
References
-
- Schwartzbaum JA, Fisher JL, Aldape KD, Wrensch M. Epidemiology and molecular pathology of glioma. Nat Clin Pract Neurol. 2006. Sep;2(9):494–503; quiz 1 p following 516. - PubMed
Publication types
MeSH terms
Grants and funding
LinkOut - more resources
Full Text Sources
Other Literature Sources
Medical
Miscellaneous
