

Sustained high glucose exposure sensitizes macrophage responses to cytokine stimuli but reduces their phagocytic activity
- PMID: 29996768
- PMCID: PMC6042333
- DOI: 10.1186/s12865-018-0261-0
Sustained high glucose exposure sensitizes macrophage responses to cytokine stimuli but reduces their phagocytic activity
Abstract
Background: Macrophages are tissue resident immune cells important for host defence and homeostasis. During diabetes, macrophages and other innate immune cells are known to have a pro-inflammatory phenotype, which is believed to contribute to the pathogenesis of various diabetic complications. However, diabetic patients are highly susceptible to bacterial infections, and often have impaired wound healing. The molecular mechanism underlying the paradox of macrophage function in diabetes is not fully understood. Recent evidence suggests that macrophage functions are governed by metabolic reprograming. Diabetes is a disorder that affects glucose metabolism; dysregulated macrophage function in diabetes may be related to alterations in their metabolic pathways. In this study, we seek to understand the effect of high glucose exposure on macrophage phenotype and functions.
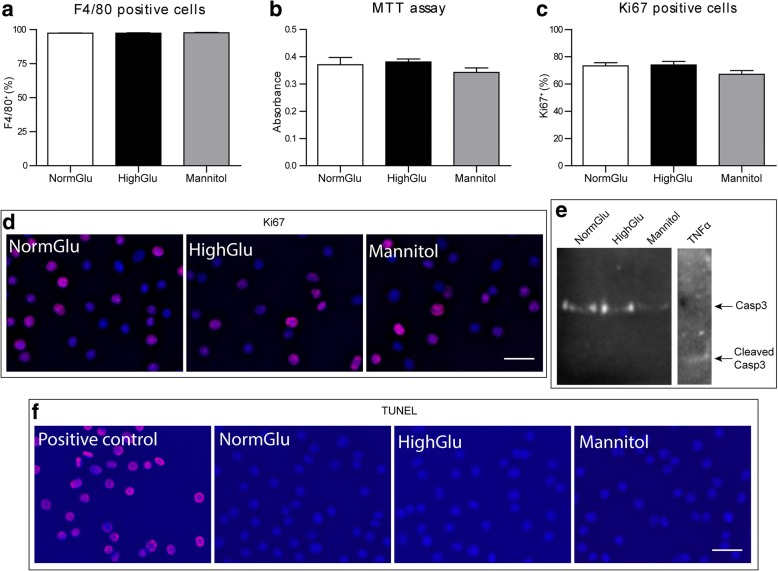
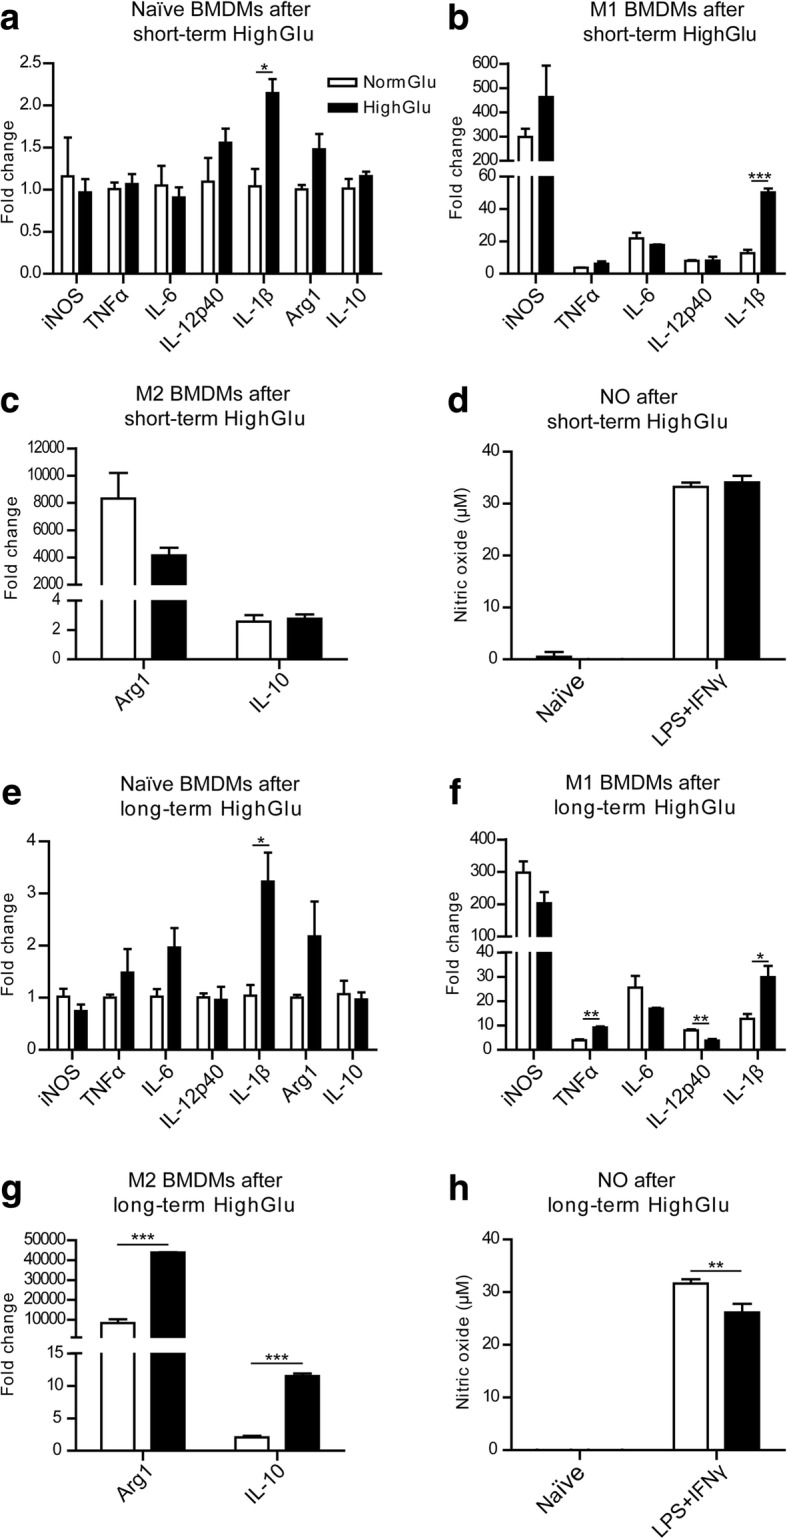
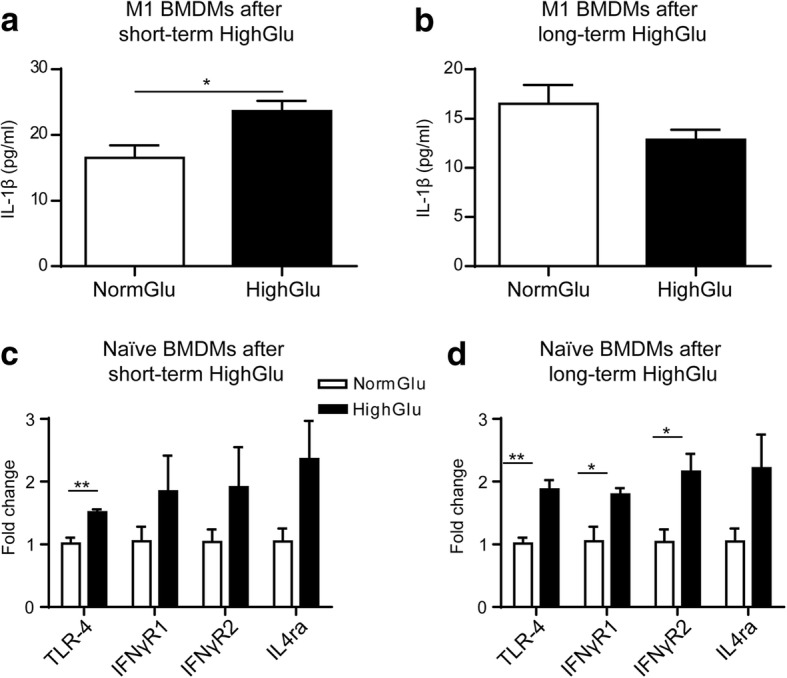
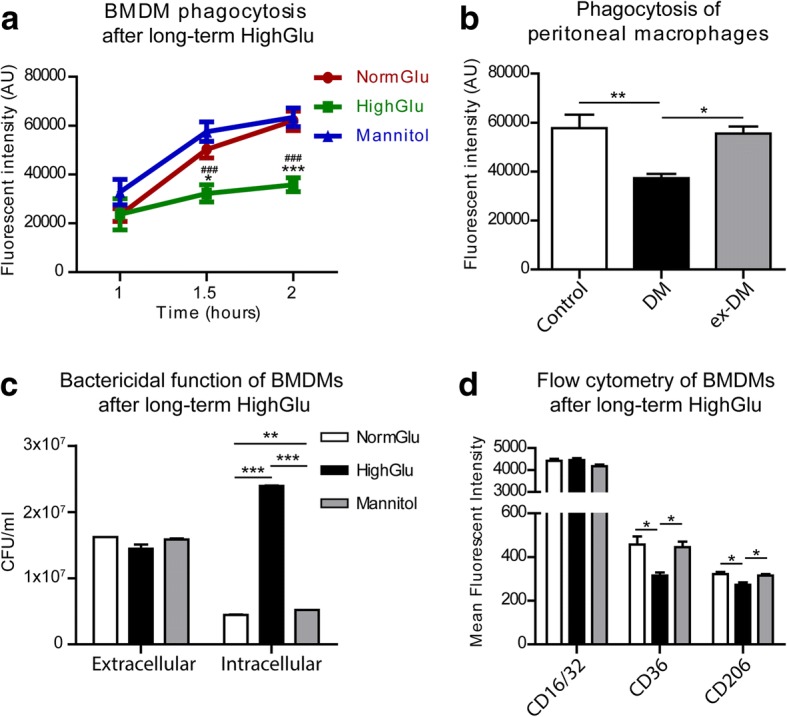
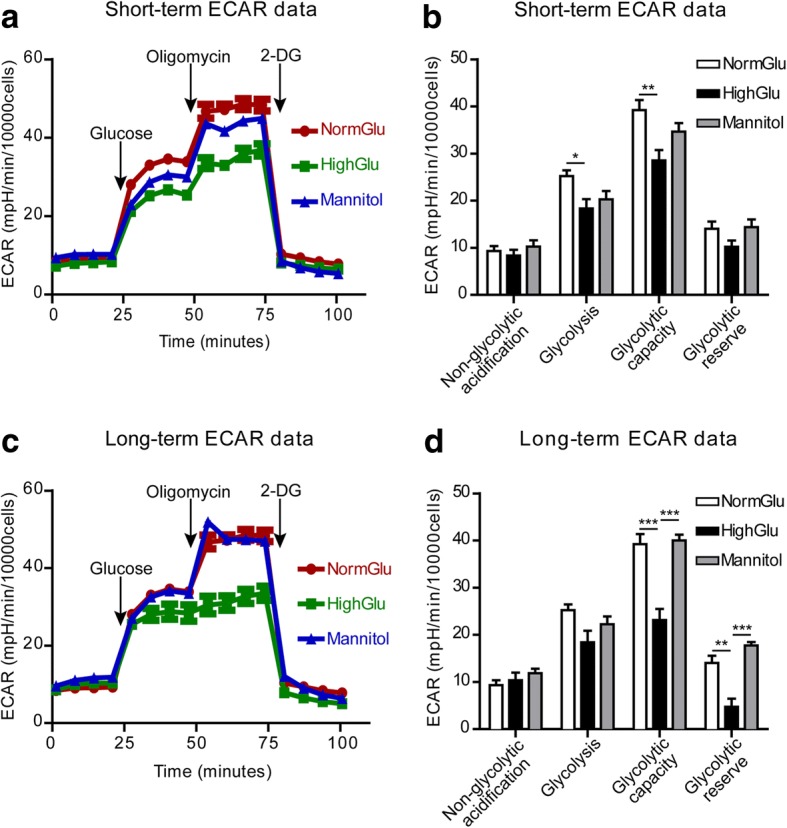
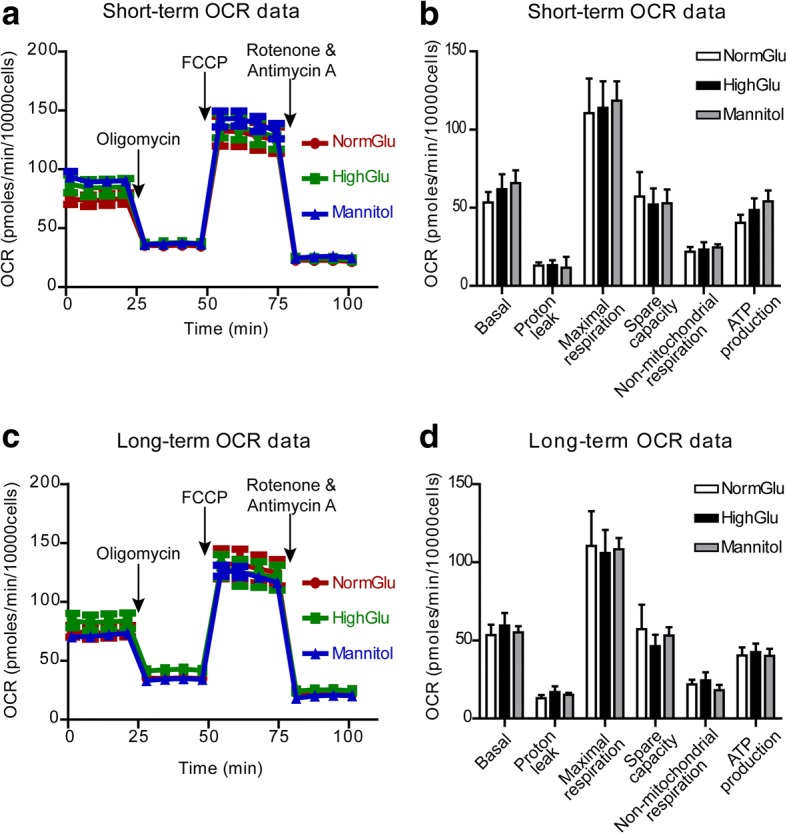
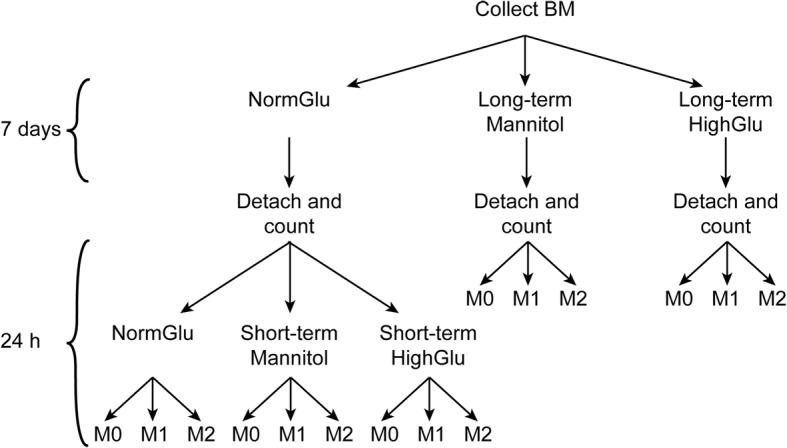
Results: Bone marrow cells were cultured in short or long term high glucose and normal glucose medium; the number and phenotype of bone marrow derived macrophages were not affected by long-term high glucose treatment. Short-term high glucose increased the expression of IL-1β. Long-term high glucose increased the expression of IL-1β and TNFα but reduced the expression of IL-12p40 and nitric oxide production in M1 macrophage. The treatment also increased Arg-1 and IL-10 expression in M2 macrophages. Phagocytosis and bactericidal activity was reduced in long-term high glucose treated macrophages and peritoneal macrophages from diabetic mice. Long-term high glucose treatment reduced macrophage glycolytic capacity and glycolytic reserve without affecting mitochondrial ATP production and oxidative respiration.
Conclusion: Long-term high glucose sensitizes macrophages to cytokine stimulation and reduces phagocytosis and nitric oxide production, which may be related to impaired glycolytic capacity.
Keywords: Cytokine; Diabetes; Glycolysis; Macrophages; Phagocytosis.
Conflict of interest statement
Ethics approval
Animal procedures (PPL 2773) were approved by the UK Home Office under the Home Office Animal Act (1986).
Consent for publication
Not applicable.
Competing interests
The authors declare that they have no competing interests.
Publisher’s Note
Springer Nature remains neutral with regard to jurisdictional claims in published maps and institutional affiliations.
Figures
Similar articles
-
Azithromycin reduces exaggerated cytokine production by M1 alveolar macrophages in cystic fibrosis.Am J Respir Cell Mol Biol. 2009 Nov;41(5):590-602. doi: 10.1165/rcmb.2008-0155OC. Epub 2009 Feb 24. Am J Respir Cell Mol Biol. 2009. PMID: 19244203
-
Preconditioning of bone marrow-derived mesenchymal stem cells highly strengthens their potential to promote IL-6-dependent M2b polarization.Stem Cell Res Ther. 2018 Oct 25;9(1):286. doi: 10.1186/s13287-018-1039-2. Stem Cell Res Ther. 2018. PMID: 30359316 Free PMC article.
-
IL-27 accelerates diabetic wound healing by modulating macrophage polarization.Int Immunopharmacol. 2025 May 16;155:114575. doi: 10.1016/j.intimp.2025.114575. Epub 2025 Apr 10. Int Immunopharmacol. 2025. PMID: 40199138
-
Exploring the mechanism and crosstalk between IL-6 and IL- 1β on M2 macrophages under metabolic stress conditions.Cytokine. 2025 Feb;186:156852. doi: 10.1016/j.cyto.2024.156852. Epub 2025 Jan 6. Cytokine. 2025. PMID: 39765025 Review.
-
Metabolic reprograming in macrophage polarization.Front Immunol. 2014 Sep 2;5:420. doi: 10.3389/fimmu.2014.00420. eCollection 2014. Front Immunol. 2014. PMID: 25228902 Free PMC article. Review.
Cited by
-
Experience on rhino-orbital mucormycosis from a tertiary care hospital in the first wave of COVID-19: An Indian perspective.Med J Armed Forces India. 2022 Apr 2;79(Suppl 1):S94-S101. doi: 10.1016/j.mjafi.2022.01.009. Online ahead of print. Med J Armed Forces India. 2022. PMID: 35400798 Free PMC article.
-
Chronically Elevated O-GlcNAcylation Limits Nitric Oxide Production and Deregulates Specific Pro-Inflammatory Cytokines.Front Immunol. 2022 Apr 1;13:802336. doi: 10.3389/fimmu.2022.802336. eCollection 2022. Front Immunol. 2022. PMID: 35432339 Free PMC article.
-
Type 2 diabetes and the clinically normal pulp: An in vitro study.Int Endod J. 2022 Jun;55(6):660-671. doi: 10.1111/iej.13732. Epub 2022 Apr 1. Int Endod J. 2022. PMID: 35322881 Free PMC article.
-
The role of cardiac resident macrophage in cardiac aging.Aging Cell. 2023 Dec;22(12):e14008. doi: 10.1111/acel.14008. Epub 2023 Oct 10. Aging Cell. 2023. PMID: 37817547 Free PMC article. Review.
-
Targeting immunometabolism during cardiorenal injury: roles of conventional and alternative macrophage metabolic fuels.Front Physiol. 2023 Apr 28;14:1139296. doi: 10.3389/fphys.2023.1139296. eCollection 2023. Front Physiol. 2023. PMID: 37234412 Free PMC article. Review.
References
-
- Serra AM, Waddell J, Manivannan A, Xu H, Cotter M, Forrester JV. CD11b+ bone marrow-derived monocytes are the major leukocyte subset responsible for retinal capillary leukostasis in experimental diabetes in mouse and express high levels of CCR5 in the circulation. Am J Pathol. 2012;181(2):719–727. doi: 10.1016/j.ajpath.2012.04.009. - DOI - PubMed
-
- Barouch FC, Miyamoto K, Allport JR, Fujita K, Bursell SE, Aiello LP, et al. Integrin-mediated neutrophil adhesion and retinal leukostasis in diabetes. Invest Ophthalmol Vis Sci. 2000;41(5):1153–1158. - PubMed
Publication types
MeSH terms
Substances
LinkOut - more resources
Full Text Sources
Other Literature Sources
Research Materials
Miscellaneous
