

Capacity of health facilities for diagnosis and treatment of HIV/AIDS in Ethiopia
- PMID: 29996821
- PMCID: PMC6042210
- DOI: 10.1186/s12913-018-3347-8
Capacity of health facilities for diagnosis and treatment of HIV/AIDS in Ethiopia
Abstract
Background: There are dearth of literature on the capacity of the health system to diagnose and treat HIV/AIDS in Ethiopia. In this study we evaluated the capacity of health facilities for HIV/AIDS care, its spatial distribution and variations by regions and zones in Ethiopia.
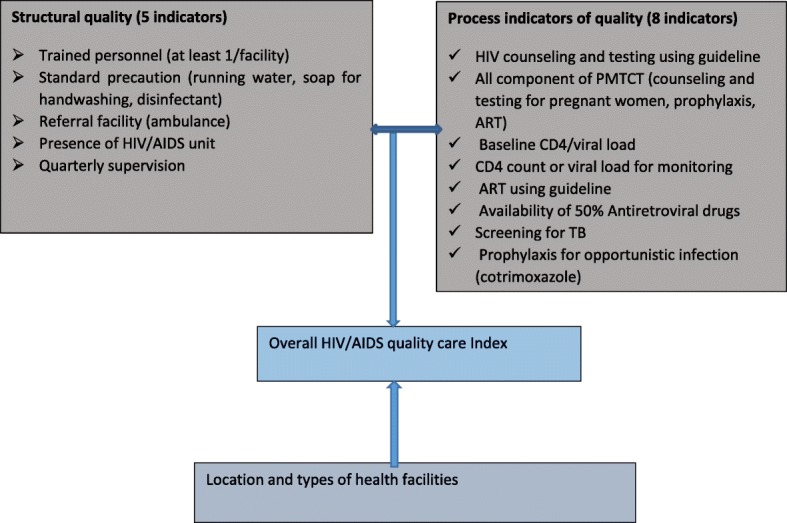
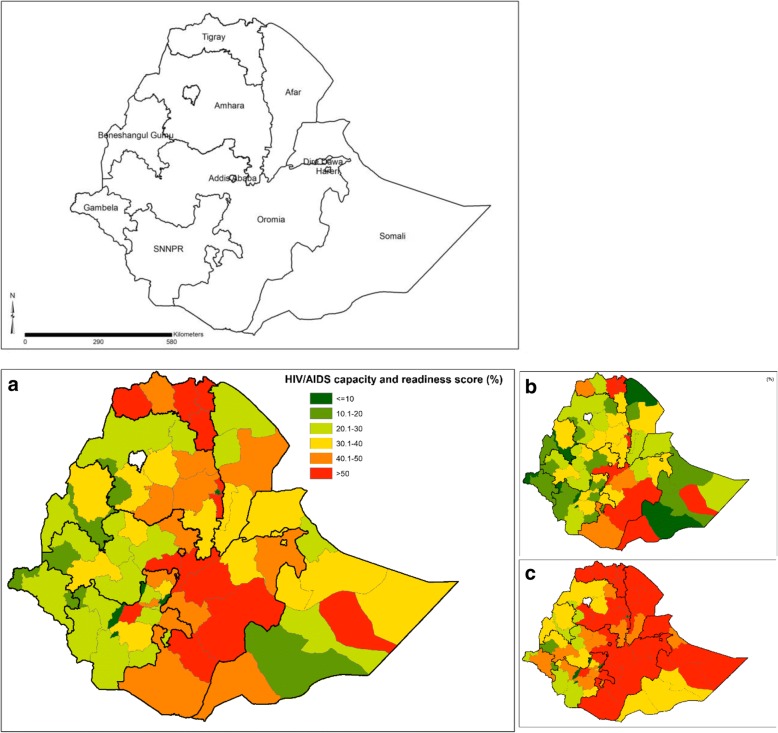
Methods: We analyzed the Service Provision Assessment plus (SPA+) survey data that were collected in 2014 in all regions of Ethiopia. We assessed structural, process and overall capacity of the health system based on the Donabedian quality of care model. We included 5 structural and 8 process indicators and overall capacity score was constructed by taking the average of all indicators. Multiple linear regression was done using STATA 14 to assess the association of the location and types of health facilities with overall capacity score. Maps displaying the average capacity score at Zonal level were produced using ArcGIS Desktop v10.3 (Environmental Systems Research Institute Inc., Redlands CA, USA).
Results: A total of 873 health facilities were included in the analysis. Less than 5% of the private facilities provided antiretroviral therapy (ART); had national ART guideline, baseline CD4 count or viral load and tuberculosis screening mechanisms. Nearly one-third of the health centers (34.9%) provided ART. Public hospitals have better capacity score (77.1%) than health centers (45.9%) and private health facilities (24.8%). The overall capacity score for urban facilities (57.1%) was higher than that of the rural (38.2%) health facilities (β = 15.4, 95% CI: 11.7, 19.2). Health centers (β = - 21.4, 95% CI: -25.4, - 17.4) and private health facilities (β = - 50.9, 95% CI: -54.8, - 47.1) had lower overall capacity score than hospitals. Facilities in Somali (β = - 13.8, 95% CI: -20.6, - 7.0) and SNNPR (β = - 5.0, 95% CI: -9.8, - 0.1) regions had lower overall capacity score than facilities in the Oromia region. Zones located in emerging regions such as Gambella and Benishangul Gumz and in remote areas of Oromia and SNNPR had lower capacity score in terms of process indicators.
Conclusions: There is a significant geographical heterogeneity on the capacity of health facilities for HIV/AIDS care and treatment in Ethiopia. Targeted capacity improvement initiatives are recommended with focus on health centers and private health facilities, and emerging Regions and the rural and remote areas.
Keywords: Capacity; Ethiopia; HIV/AIDS; Health facilities.
Conflict of interest statement
Ethics approval and consent to participate
The study used a secondary data and the local ethics committee at the Ethiopian Public Health Institute ruled that no formal ethical approval is required. We used de-identified data (summary data without individuals identity) to ensure confidentiality.
Consent for publication
Not applicable.
Competing interests
The authors declare that they have no competing interests.
Publisher’s Note
Springer Nature remains neutral with regard to jurisdictional claims in published maps and institutional affiliations.
Figures
References
-
- UNAIDS. Ending AIDS: Progress towards the 90-90-90 targets. UNAIDS, 2017. (http://www.unaids.org/sites/default/files/media_asset/Global_AIDS_update...). Accessed 4 July 2018.
-
- WHO: From MDG to SDG. World Health Organization(WHO). (http://apps.who.int/iris/bitstream/handle/10665/200009/9789241565110_eng...). Accessed on November 28, 2017. 2015.
-
- FMOH: HIV epidemic estimates by regional states and Ethiopia. FMOH (Federal Ministry of Health), HIV/AIDS Prevention and Control Office 2015.
-
- Ojikutu B, Higgins-Biddle M, Greeson D, Phelps BR, Amzel A, Okechukwu E, Kolapo U, Cabral H, Cooper E, Hirschhorn LR. The association between quality of HIV care, loss to follow-up and mortality in pediatric and adolescent patients receiving antiretroviral therapy in Nigeria. PLoS One. 2014;9(7):e100039. doi: 10.1371/journal.pone.0100039. - DOI - PMC - PubMed
MeSH terms
Grants and funding
LinkOut - more resources
Full Text Sources
Other Literature Sources
Medical
Research Materials
