. 2018 Jul 11;17(1):259.
doi: 10.1186/s12936-018-2405-3.

Mapping the stability of malaria hotspots in Bangladesh from 2013 to 2016

Affiliations

Mapping the stability of malaria hotspots in Bangladesh from 2013 to 2016

Andrés Noé et al. Malar J. .

Abstract

Background: Malaria claims hundreds of thousands of lives each year, most of them children. A "malaria-free world" is the World Health Organization's vision, but elimination from the southeast Asian Region is hampered by factors including anti-malarial resistance and systematic underreporting. Malaria is a significant public health problem in Bangladesh and while there have been recent gains in control, there is large spatial and temporal heterogeneity in the disease burden. This study aims to determine the pattern and stability of malaria hotspots in Bangladesh with the end goal of informing intervention planning for elimination.

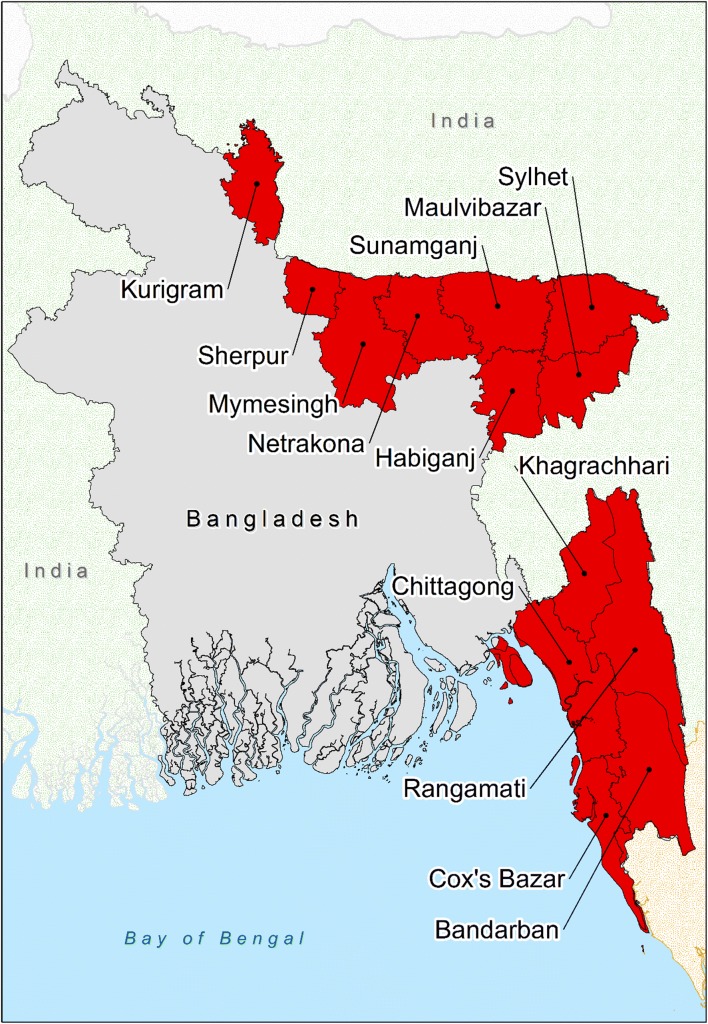
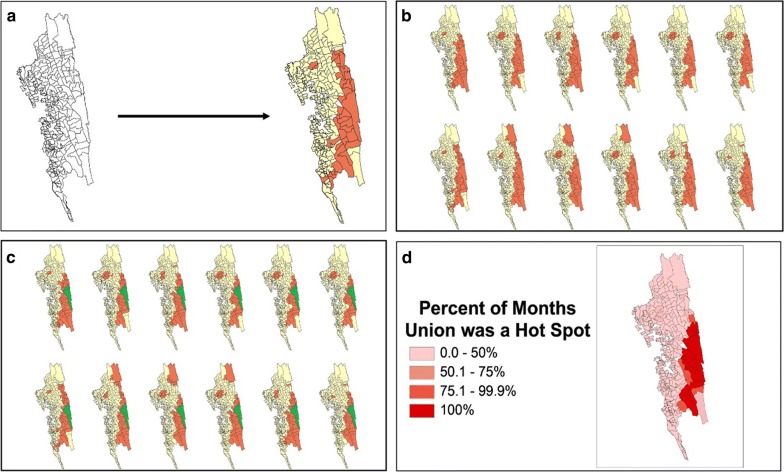
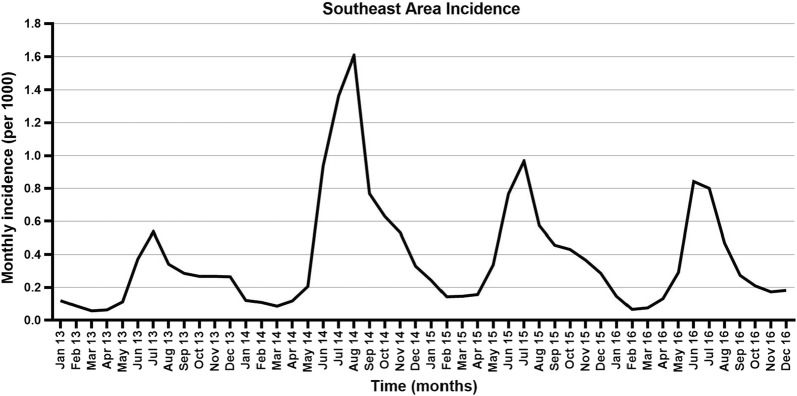
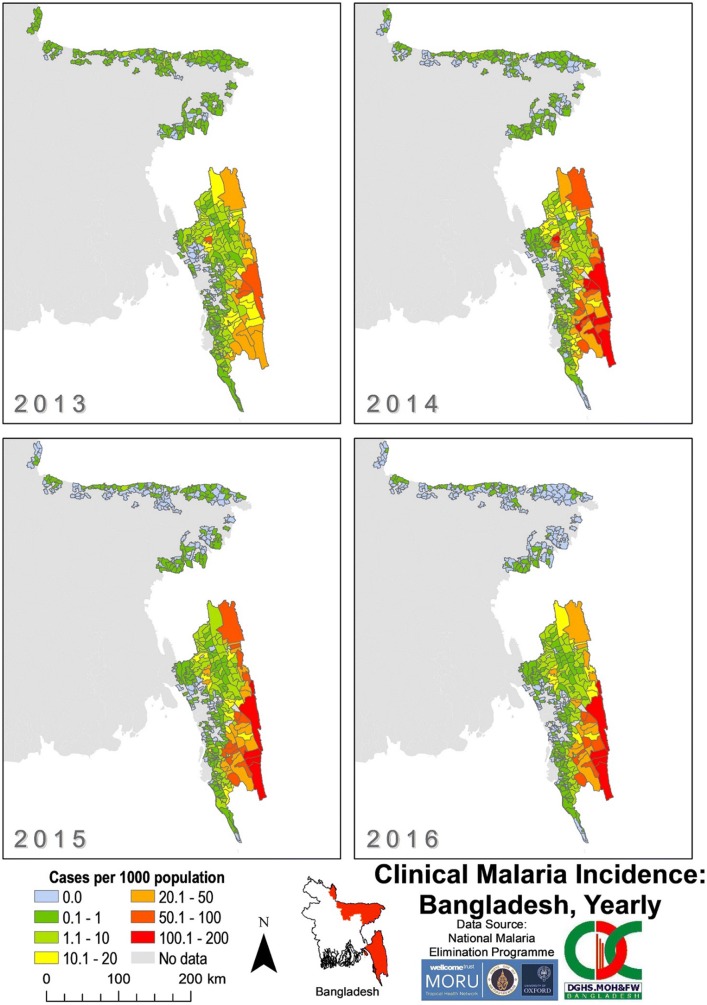
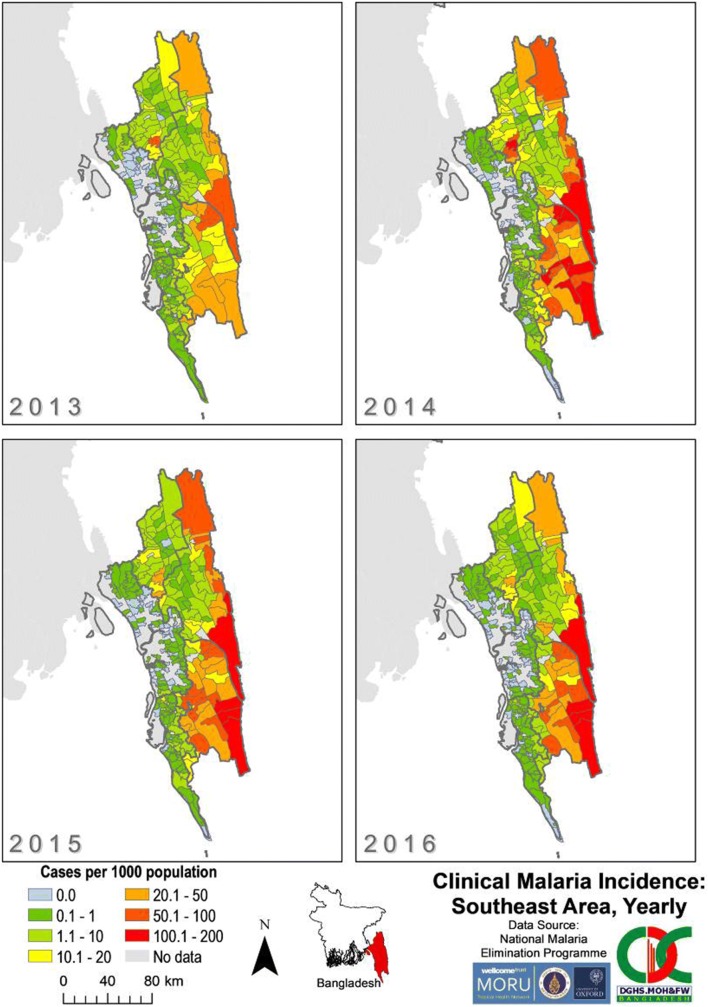
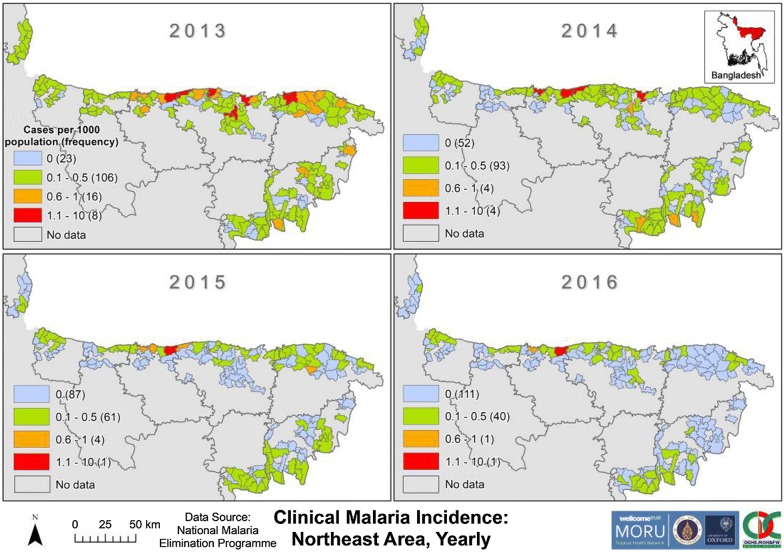
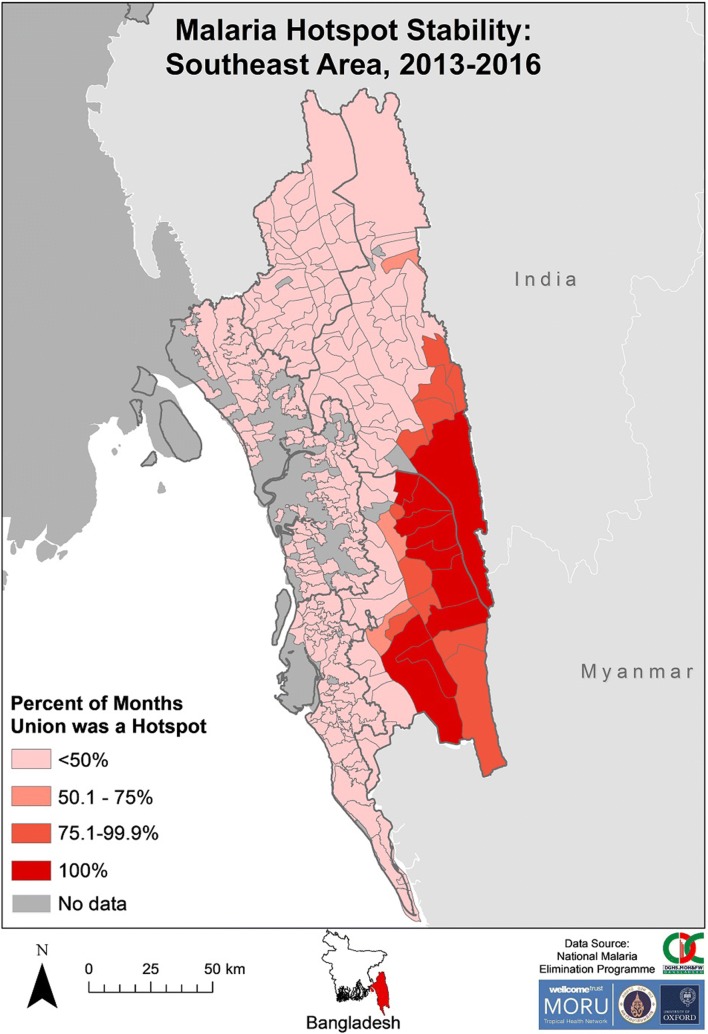
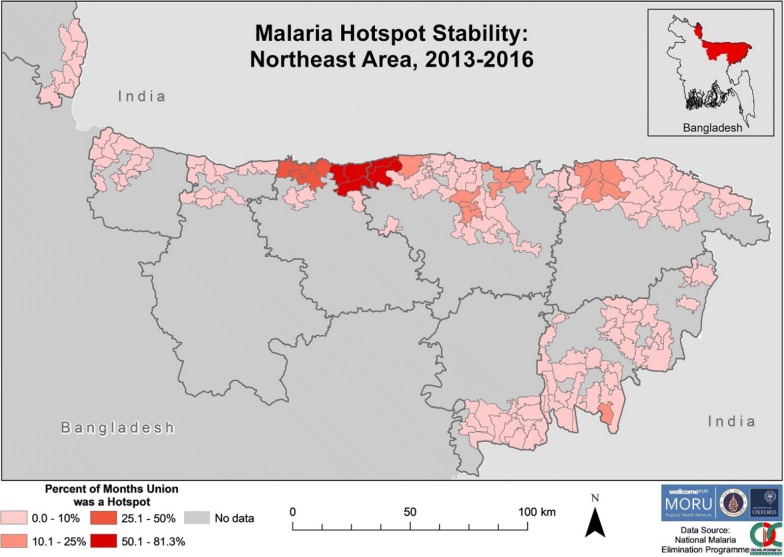
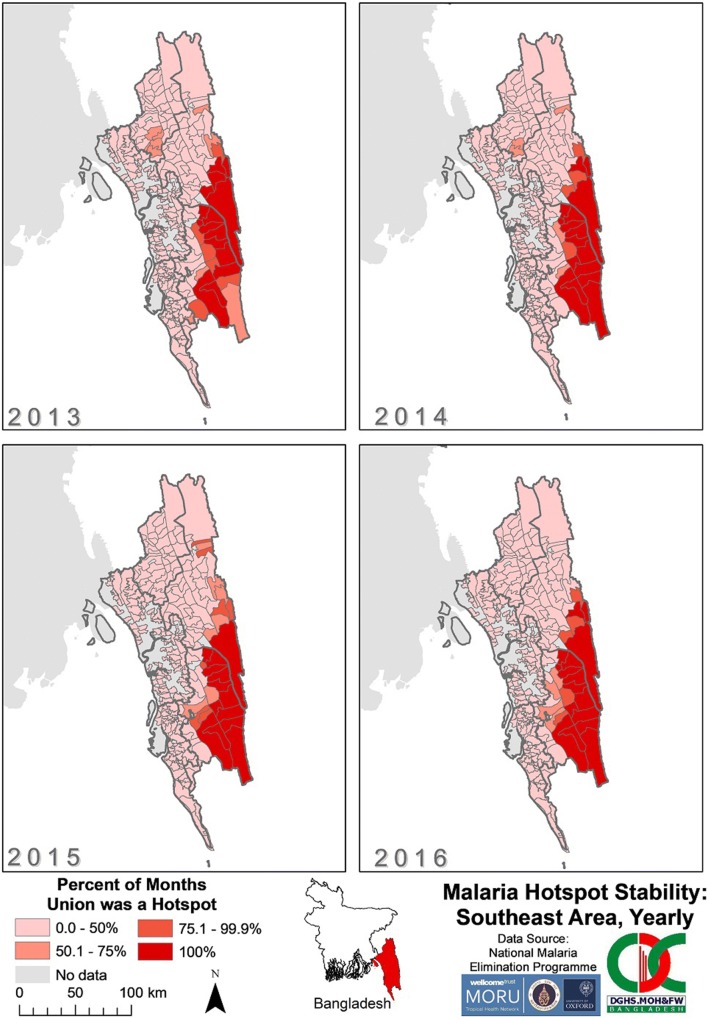
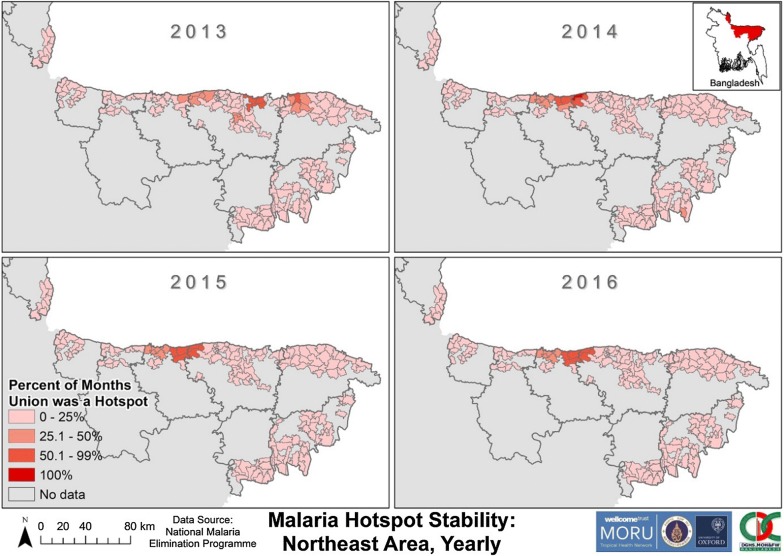
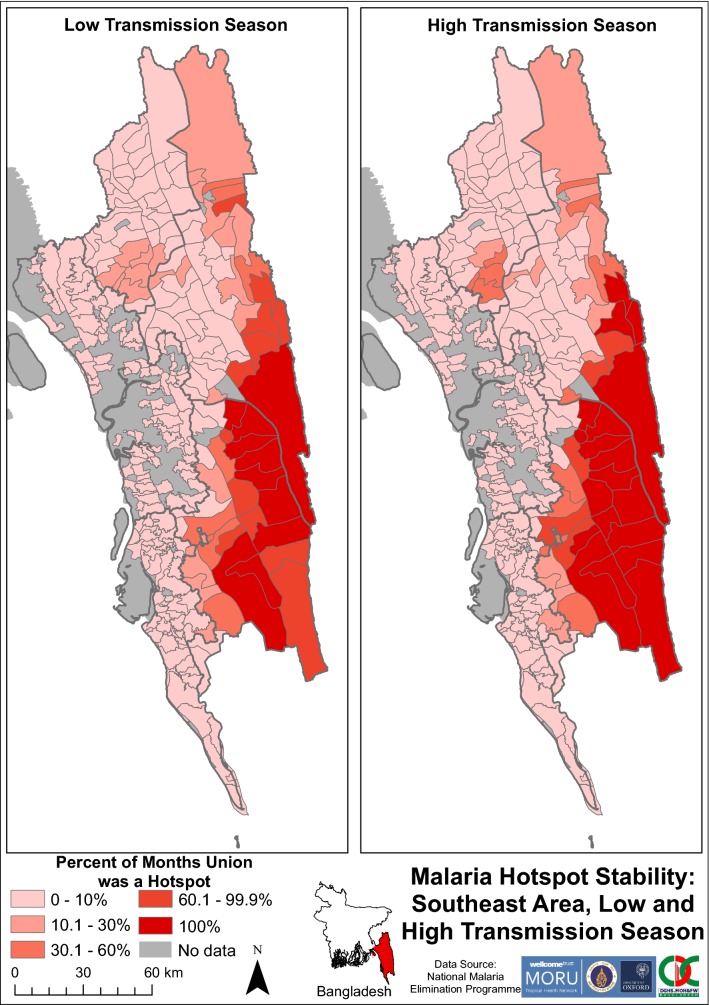
Results: Malaria in Bangladesh exhibited highly seasonal, hypoendemic transmission in geographic hotspots, which remained conserved over time. The southeast areas of the Chittagong Hill Tracts were identified as malaria hotspots for all 4 years examined. Similarly, areas in Sunamganj and Netrakona districts in the Northeast were hotspots for 2013-2016. Highly stable hotspots from 1 year predicted the following year's hotspot locations in the southeast of Bangladesh. Hotspots did not appear to act as sources of spread with no evidence of consistent patterns of contiguous spread or recession of hotspots as high or low transmission seasons progressed.

Conclusions: Areas were identified with temporal and spatial clustering of high malaria incidence in Bangladesh. Further studies are required to understand the vector, sociodemographic and disease dynamics within these hotspots. Given the low caseloads occurring in the low transmission seasons, and the conserved nature of malaria hotspots, directing resources towards these areas may be an efficient way to achieve malaria elimination in Bangladesh.

Keywords: Cartography; GIS; Heterogeneity; Hotspots; Incidence; Spatial epidemiology; Spatiotemporal.


Figures

Fig. 1
Fig. 1
The 13 malaria-endemic districts of Bangladesh. SeA is the area highlighted red to the southeast of Bangladesh (Bandarban, Chittagong, Cox’s Bazar, Khagrachhari and Rangamati) and NeA is the eight districts highlighted red to the northeast of Bangladesh (Habiganj, Kurigram, Maulvibazar, Mymesingh, Netrakona, Sherpur, Sunamganj and Sylhet). Note: the CHTs are Khagrachhari, Rangamati and Bandarban. CHTs, Chittagong Hill Tract districts. NeA The Northeast Area, SeA The Southeast Area
Fig. 2
Fig. 2
Population counts in the malaria at-risk unions in Bangladesh from 2013 to 2016
Fig. 3
Fig. 3
Elevation of land in Bangladesh. The 13 endemic districts are outlined. Data source: diva-gis.org
Fig. 4
Fig. 4
Depiction of the stability map production process. The four panels show an example of how a stability map was produced from monthly incidence data for 1 year. a Hotspot analysis for 1 month. The Getis-Ord Gi* statistical technique identifies hotspots of malaria incidence to a 95% confidence level (marked in orange). The features that are not statistically significant hotspots are marked in yellow. b Monthly hotspots for each month in the year. The Getis-Ord Gi* technique identifies hotspots for each month of the year in question. c Hotspot stability identification. Each geographical area is examined for how many months it was identified to be a hotspot in the year. For example, Farua, the area highlighted in green, was a hotspot for all 12 months of the year. Therefore, the percent of months the union was a Hotspot is 100%. d Stability map depiction. The amount of time each geographic area was a hotspot is displayed on a map. Farua can be seen shaded in the deepest red, indicating it was a hotspot for 100% of that year
Fig. 5
Fig. 5
Monthly malaria incidence in SeA as reported by BLNC. Malaria diagnoses increased significantly throughout 2014 compared to 2013. The following 2 years had smaller peaks in the high transmission season. “Per 1000” = malaria cases per 1000 population at risk
Fig. 6
Fig. 6
Clinical malaria incidence in Bangladesh by union from 2013 to 2016 as reported by BLNC. The “No data” category indicates that for that area, no cases of malaria were reported in the dataset
Fig. 7
Fig. 7
Clinical malaria incidence by union in SeA from 2013 to 2016. The “No data” category indicates that for that area, no cases of malaria were reported in the dataset. The dark grey outlines overlying the maps denote endemic district boundaries. Refer to Fig. 1 for an endemic district reference map
Fig. 8
Fig. 8
Clinical malaria incidence by union in NeA from 2013 to 2016. The “No data” category indicates that for that area no cases of malaria were reported in the dataset. The dark grey outlines overlying the maps denote endemic district boundaries. Refer to Fig. 1 for an endemic district reference map
Fig. 9
Fig. 9
Malaria hotspot stability in SeA from 2013 to 2016. The “No data” category indicates that for that area no cases of malaria were reported in the dataset. The dark grey outlines overlying the map denote endemic district boundaries
Fig. 10
Fig. 10
Malaria hotspot stability in NeA from 2013 to 2016. The “No data” category indicates that for that area no cases of malaria were reported in the dataset. The dark grey outlines overlying the maps denote endemic district boundaries
Fig. 11
Fig. 11
Malaria hotspot stability in SeA by year from 2013 to 2016. The “No data” category indicates that for that area no cases of malaria were reported in the dataset. The dark grey outlines overlying the maps denote endemic district boundaries
Fig. 12
Fig. 12
Malaria Hotspot Stability in NeA by year from 2013 to 2016. The “No data” category indicates that for that area no cases of malaria were reported in the dataset. The dark grey outlines overlying the maps denote endemic district boundaries
Fig. 13
Fig. 13
Malaria hotspot stability in SeA by transmission seasons. The “No data” category indicates that for that area no cases of malaria were reported in the dataset. The dark grey outlines overlying the maps denote endemic district boundaries

Similar articles

Cited by

References

    1. Haque U, Overgaard HJ, Clements AC, Norris DE, Islam N, Karim J, et al. Malaria burden and control in Bangladesh and prospects for elimination: an epidemiological and economic assessment. Lancet Glob Health. 2014;2:e98–e105. doi: 10.1016/S2214-109X(13)70176-1. - DOI - PubMed
    1. WHO . World Malaria Report 2016. Geneva: World Health Organization; 2016.
    1. National Malaria Control Programme . Malaria national strategic plan: 2015–2020. Dhaka: Ministry of Health & Family Welfare; 2015.
    1. Ahmed S, Galagan S, Scobie H, Khyang J, Prue CS, Khan WA, et al. Malaria hotspots drive hypoendemic transmission in the Chittagong hill districts of Bangladesh. PLoS ONE. 2013;8:e69713. doi: 10.1371/journal.pone.0069713. - DOI - PMC - PubMed
    1. National Malaria Elimination Programme . National strategic plan for malaria elimination: a path to the phased elimination of malaria from Bangladesh. Dhaka: Ministry of Health and Family Welfare; 2017.

LinkOut - more resources