

Antiproliferative and proapoptotic effects of DODAC/synthetic phosphoethanolamine on hepatocellular carcinoma cells
- PMID: 29996919
- PMCID: PMC6042440
- DOI: 10.1186/s40360-018-0225-2
Antiproliferative and proapoptotic effects of DODAC/synthetic phosphoethanolamine on hepatocellular carcinoma cells
Abstract
Background: Current studies have demonstrated that DODAC/PHO-S (Dioctadecyldimethylammonium Chloride/Synthetic phosphoethanolamine) liposomes induces cytotoxicity in Hepa1c1c7 and B16F10 murine tumor cells, with a higher proportion than PHO-S. Therefore, our aim was to evaluate the potential of DODAC/PHO-S to elucidate the mechanism of cell death whereby the liposomes induces cytotoxicity in hepatocellular carcinoma Hepa1c1c7, compared to the PHO-S alone.
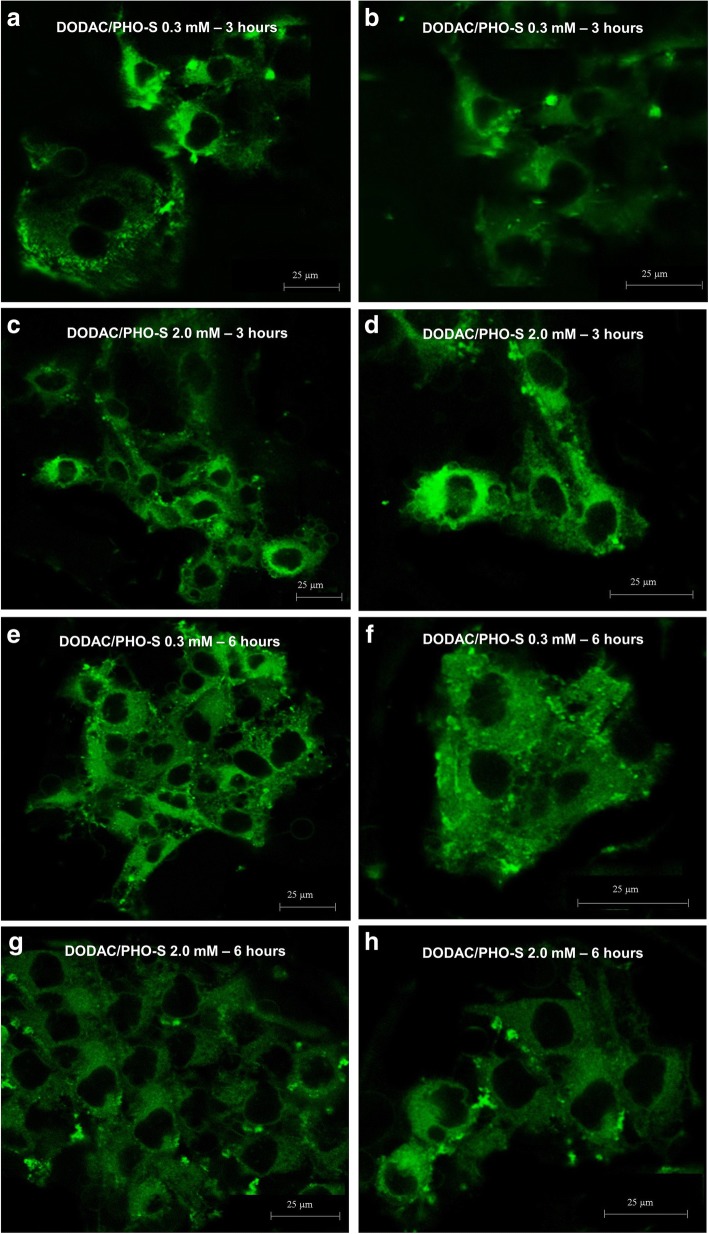
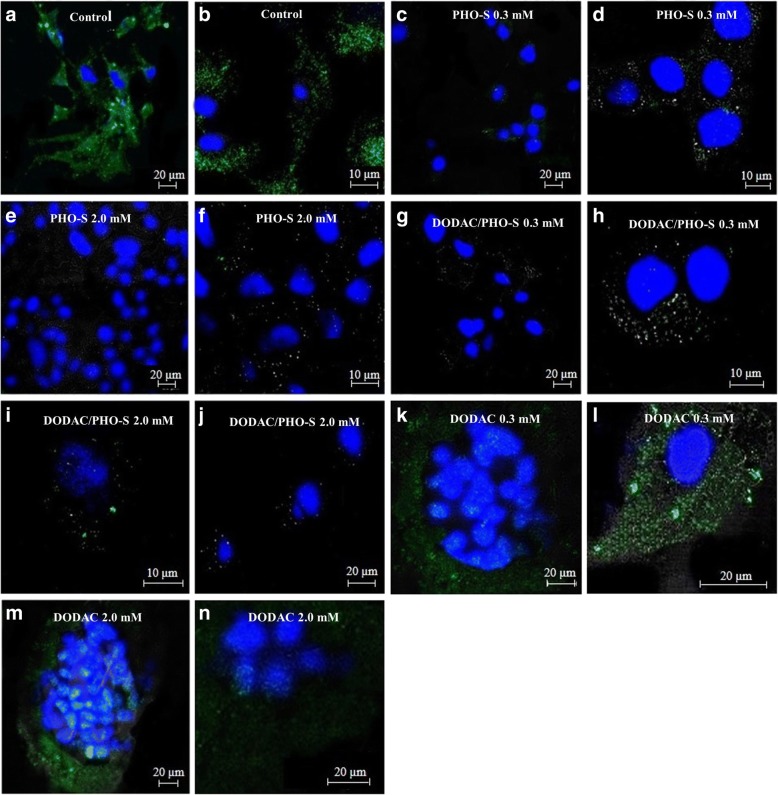
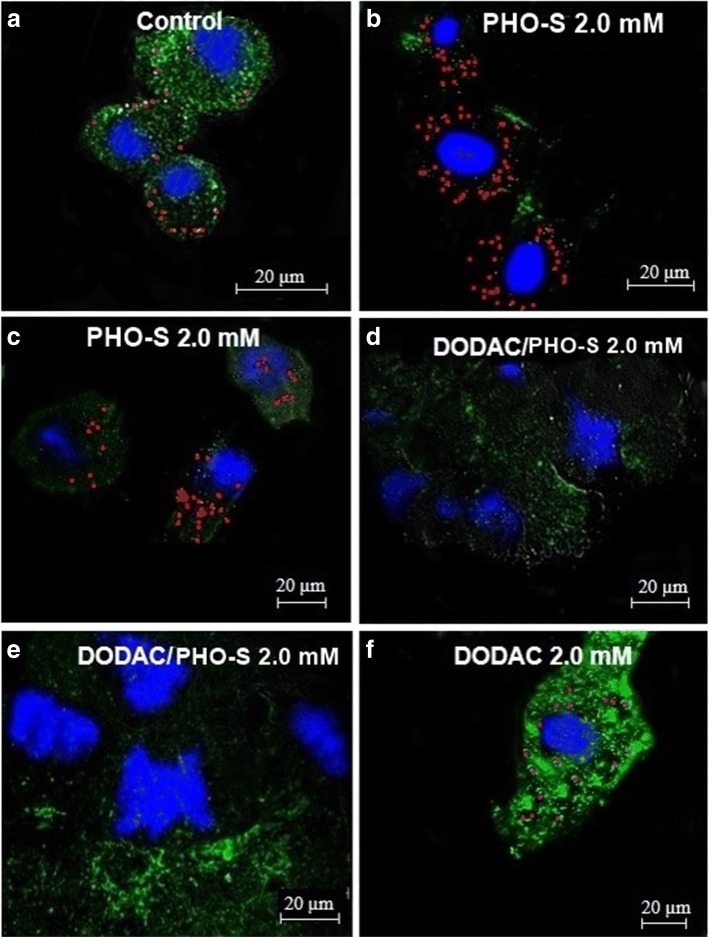
Methods: Liposomes (DODAC/PHO-S) were prepared by ultrasonication. The cell cycle phases, protein expression and types of cell's death on Hepa1c1c7 were analyzed by flow cytometry. The internalisation of liposomes, mitochondrial electrical potential and lysosomal stability were also evaluated by confocal laser scanning microscopy.
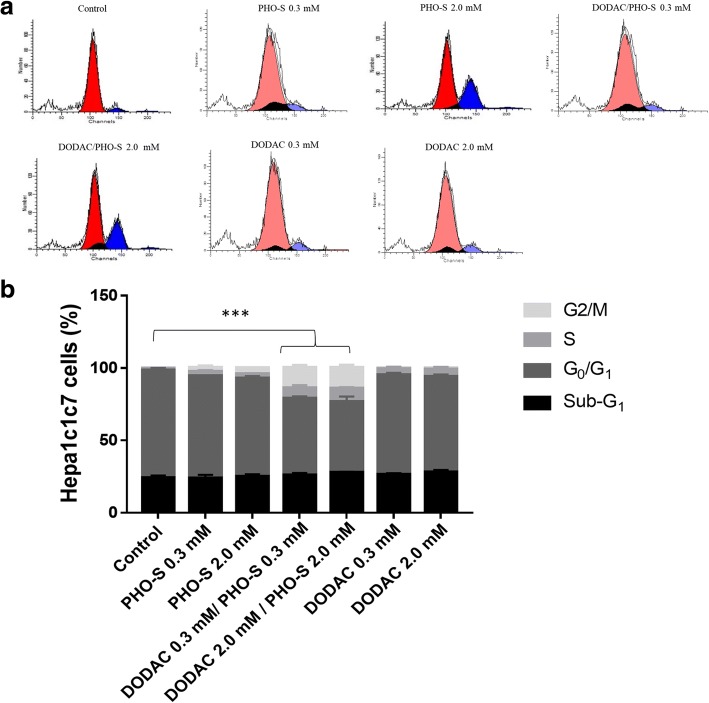
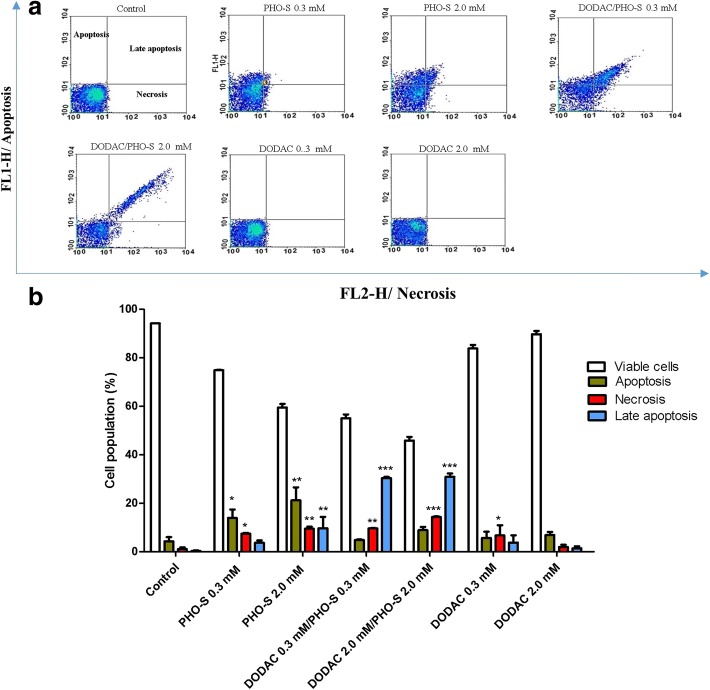
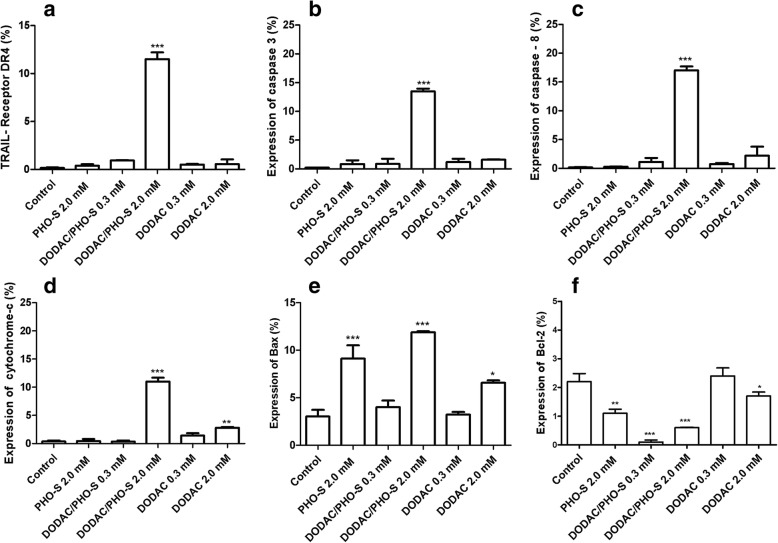
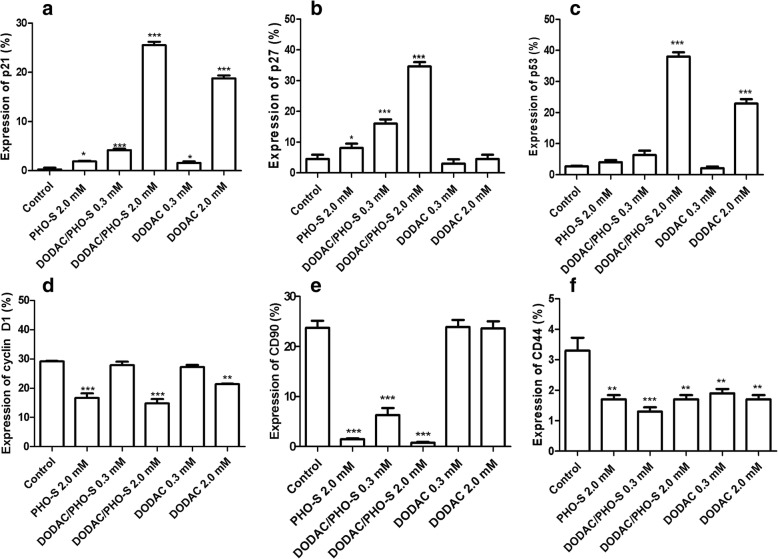
Results: After treatment with liposomes (DODAC/PHO-S), we observed a significant increase in the population of Hepa1c1c7 cells experiencing cell cycle arrest in the S and G2/M phases, and this treatment was significantly more effective to promote cell death by apoptosis. There also was a decrease in the mitochondrial electrical potential; changes in the lysosomes; nuclear fragmentation and catastrophic changes in Hepa1c1c7 cells. The liposomes additionally promoted increases in the expression of DR4 receptor, caspases 3 and 8, cytochrome c, p53, p21, p27 and Bax. There was also a decrease in the expression of Bcl-2, cyclin D1, CD90 and CD44 proteins.
Conclusion: The overall results showed that DODAC/PHO-S liposomes were more effective than PHO-S alone, in promoting cytotoxicity Hepa1c1c7 tumor cells, activating the intrinsic and extrinsic pathways of programmed cell death.
Keywords: Antitumoral alkylphospholipids; Hepatocellular carcinoma; Liposomes; Nanomedicine.
Conflict of interest statement
Ethics approval and consent to participate
Not Applicable
Consent for publication
Not Applicable
Competing interest
The authors declare that they have no competing interests.
Publisher’s Note
Springer Nature remains neutral with regard to jurisdictional claims in published maps and institutional affiliations.
Figures
Similar articles
-
Potential antitumor activity of novel DODAC/PHO-S liposomes.Int J Nanomedicine. 2016 Apr 18;11:1577-91. doi: 10.2147/IJN.S90850. eCollection 2016. Int J Nanomedicine. 2016. PMID: 27143880 Free PMC article.
-
Modulation of pro-apoptotic effects and mitochondrial potential on B16F10 cells by DODAC/PHO-S liposomes.BMC Res Notes. 2018 Feb 14;11(1):126. doi: 10.1186/s13104-018-3170-7. BMC Res Notes. 2018. PMID: 29444697 Free PMC article.
-
Synthetic phosphoethanolamine induces cell cycle arrest and apoptosis in human breast cancer MCF-7 cells through the mitochondrial pathway.Biomed Pharmacother. 2013 Jul;67(6):481-7. doi: 10.1016/j.biopha.2013.01.012. Epub 2013 Feb 16. Biomed Pharmacother. 2013. PMID: 23773853
-
Synthetic phosphoethanolamine a precursor of membrane phospholipids reduce tumor growth in mice bearing melanoma B16-F10 and in vitro induce apoptosis and arrest in G2/M phase.Biomed Pharmacother. 2012 Oct;66(7):541-8. doi: 10.1016/j.biopha.2012.04.008. Epub 2012 May 18. Biomed Pharmacother. 2012. PMID: 22902646
-
Anti-angiogenic and anti-metastatic activity of synthetic phosphoethanolamine.PLoS One. 2013;8(3):e57937. doi: 10.1371/journal.pone.0057937. Epub 2013 Mar 14. PLoS One. 2013. PMID: 23516420 Free PMC article.
Cited by
-
2-Aminoethyl Dihydrogen Phosphate (2-AEH2P) Associated with Cell Metabolism-Modulating Drugs Presents a Synergistic and Pro-Apoptotic Effect in an In Vitro Model of the Ascitic Ehrlich Tumor.Biomedicines. 2024 Jan 4;12(1):109. doi: 10.3390/biomedicines12010109. Biomedicines. 2024. PMID: 38255214 Free PMC article.
-
Lipid based nanoparticles as a novel treatment modality for hepatocellular carcinoma: a comprehensive review on targeting and recent advances.J Nanobiotechnology. 2022 Mar 5;20(1):109. doi: 10.1186/s12951-022-01309-9. J Nanobiotechnology. 2022. PMID: 35248080 Free PMC article. Review.
-
Theoretical Model for In Vivo Induction of Chemotherapy Sensitization Using miRNA Packaged in Distinct Layered Liposomes.J Funct Biomater. 2024 Oct 5;15(10):298. doi: 10.3390/jfb15100298. J Funct Biomater. 2024. PMID: 39452596 Free PMC article.
-
Ethanolamine-phosphate phospho-lyase (ETNPPL) contributes to the diagnosis, prognosis, and therapy of hepatocellular carcinoma.PeerJ. 2023 Aug 21;11:e15834. doi: 10.7717/peerj.15834. eCollection 2023. PeerJ. 2023. PMID: 37637156 Free PMC article.
-
Tolerability and Effects of 2-Aminoethyl Dihydrogen Phosphate in Dogs With Mast Cell Tumors.Front Vet Sci. 2022 Jul 12;9:898077. doi: 10.3389/fvets.2022.898077. eCollection 2022. Front Vet Sci. 2022. PMID: 35903136 Free PMC article.
References
Publication types
MeSH terms
Substances
LinkOut - more resources
Full Text Sources
Other Literature Sources
Research Materials
Miscellaneous
