. 2018 Jul 11;37(1):146.
doi: 10.1186/s13046-018-0796-1.

Simultaneous E-cadherin and PLEKHA7 expression negatively affects E-cadherin/EGFR mediated ovarian cancer cell growth

Affiliations

Simultaneous E-cadherin and PLEKHA7 expression negatively affects E-cadherin/EGFR mediated ovarian cancer cell growth

Katia Rea et al. J Exp Clin Cancer Res. .

Abstract

Background: The disruption of E-cadherin-mediated adhesion is considered an important driver of tumor progression. Nevertheless, numerous studies have demonstrated that E-cadherin promotes growth- or invasion-related signaling, contrary to the prevailing notion. During tumor progression, epithelial ovarian cancer (EOC) maintains E-cadherin expression and can positively affect EOC cell growth by contributing to PI3K/AKT activation. In polarized epithelia PLEKHA7, a regulator of the zonula adherens integrity, impinges E-cadherin functionality, but its role in EOCs has been never studied.

Methods: Ex-vivo EOC cells and cell lines were used to study E-cadherin contribution to growth and EGFR activation. The expression of the proteins involved was assessed by real time RT-PCR, immunohistochemistry and western blotting. Cells growth and drug susceptibility was monitored in different 3-dimensional (3D) systems. Recombinant lentivirus-mediated gene expression, western blotting, immunoprecipitation and confocal microscopy were applied to investigate the biological impact of PLEKHA7 on E-cadherin behaviour. The clinical impact of PLEKHA7 was determined in publicly available datasets.

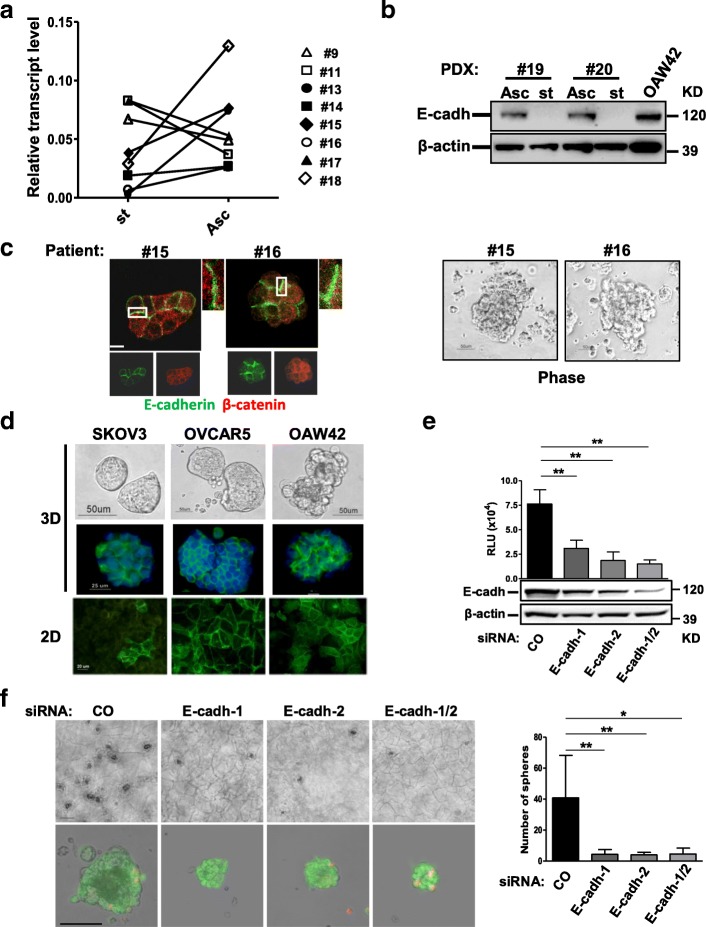
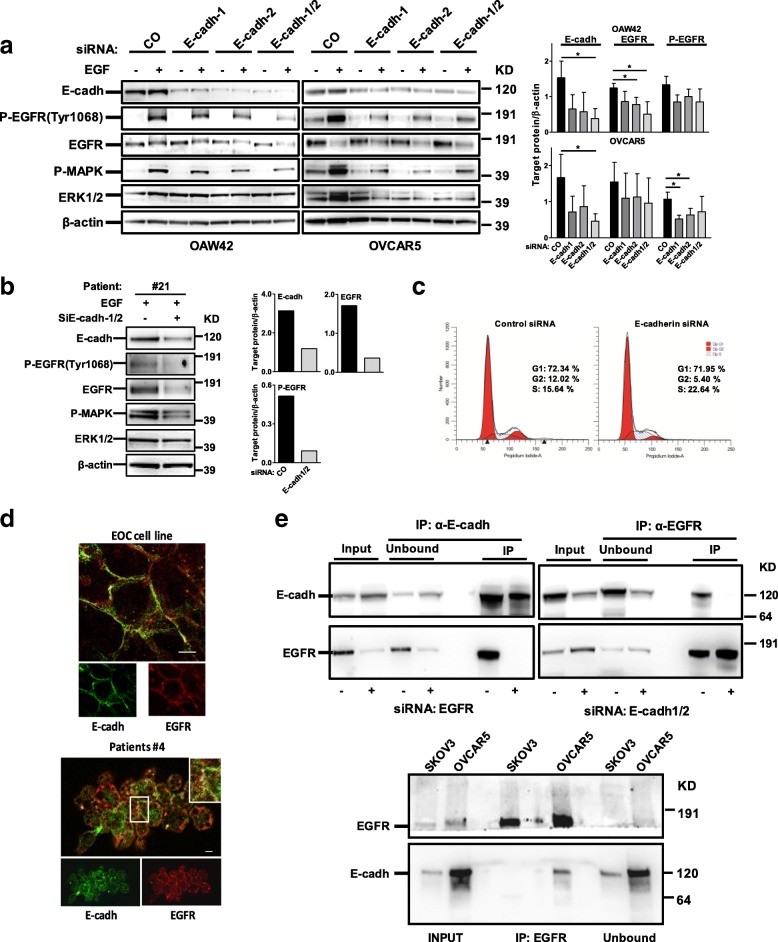
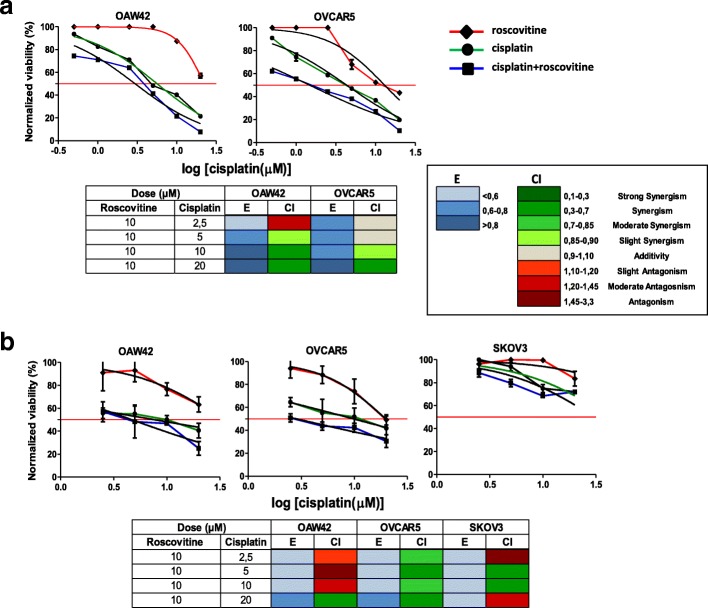
Results: We show that E-cadherin expression contributes to growth of EOC cells and forms a complex with EGFR thus positively affecting ligand-dependent EGFR/CDK5 signaling. Accordingly, 3D cultures of E-cadherin-expressing EOC cells are sensitive to the CDK5 inhibitor roscovitine combined with cisplatin. We determined that PLEKHA7 overexpression reduces the formation of E-cadherin-EGFR complex, EGFR activation and cell tumorigenicity. Clinically, PLEKHA7 mRNA is statistically decreased in high grade EOCs respect to low malignant potential and low grade EOCs and correlates with better EOC patient outcome.

Conclusions: These data represent a significant step towards untangling the role of E-cadherin in EOCs by assessing its positive effects on EGFR/CDK5 signaling and its contribution to cell growth. Hence, the inhibition of this signaling using a CDK5 inhibitor exerts a synergistic effect with cisplatin prompting on the design of new therapeutic strategies to inhibit growth of EOC cells. We assessed for the first time in EOC cells that PLEKHA7 induces changes in the asset of E-cadherin-containing cell-cell contacts thus inhibiting E-cadherin/EGFR crosstalk and leading to a less aggressive tumor phenotype. Accordingly, PLEKHA7 levels are lower in high grade EOC patient tumors and EOC patients with better outcomes display higher PLEKHA7 levels.

Keywords: CDK5; E-cadherin; EGFR; Epithelial ovarian cancer; PLEKHA7.


Conflict of interest statement

Ethics approval and consent to participate

All participants provided written informed consent, and the study was approved by the Institutional Research Ethic Committee of Fondazione IRCCS Istituto Nazionale dei Tumori.

Consent for publication

Not applicable.

Competing interests

The authors declare that they have no competing interests.

Publisher’s Note

Springer Nature remains neutral with regard to jurisdictional claims in published maps and institutional affiliations.

Figures

Fig. 1
Fig. 1
E-cadherin membrane expression contributes to EOC MCA formation. a Real-time RT-PCR showing the levels of E-cadherin transcript in freshly isolated matched solid peritoneal tumor masses (st) and ascites-derived MCAs (Asc) from eight HG-SOC patients. Results are presented as relative expression normalized to GAPDH mRNA levels. b Western blotting on total cell lysates from two pairs of MCAs (Asc) and solid tumors (st) of PDXs obtained from two different HG-SOC patients as reported in the Methods. β-actin was used as control of gel loading. c Representative images of MCAs from two HG-SOC patients. Left panel: staining with anti-E-cadherin and β-catenin Abs on MCAs from the same HG-SOC patients. Higher magnification images, corresponding to the highlighted white box are reported. Right panel: phase contrast microscopy performed on MCAs from two (#15 and #16) HG-SOC patients. d Upper panel: phase contrast and IF with anti-E-cadherin Ab (green) of 3D of SKOV3, OVCAR5, and OAW42 cells. Lower panel: IF with anti-E-cadherin Ab performed on confluent SKOV3, OVCAR5, and OAW42 cells (2D). e OAW42 cells transiently transfected with a control (CO) siRNA or with two E-cadherin siRNAs, separately (E-cadh-1, E-cadh-2) or pooled (E-cadh-1/2), and then grown as MCAs for 9 days. Upper panel: cell viability assay performed on silenced OAW42 MCAs. Lower panel: western blotting for evaluation of E-cadherin levels in OAW42 MCAs after 9 days of culture. A representative experiment is shown. Immunoblottings were performed with Abs against the proteins reported on the left. β-actin was used as a control for gel loading. f Left upper panel: representative phase contrast images of OAW42 MCAs obtained as above; bar, 100 μm. Left lower panel: phase contrast images of OAW42 MCAs obtained as above, dissociated from Algimatrix, and stain with LIVE/DEAD™ Viability/Cytotoxicity Kit. Merge of phase contrast, green (live cells) and red (dead cells) fluorescent images are shown. Single images are shown in Additional file 2: Figure S2a. Bar, 50 μm. Right panel: number of OAW42 MCAs (named spheres) obtained as above. Asterisks indicate statistically significant values by Student’s t test (p < 0.01)
Fig. 2
Fig. 2
E-cadherin positively impinges EGFR activation. a Left panel: representative western blotting of three performed on lysates from OAW42 and OVCAR5 cells transiently transfected with a control (CO) siRNA or with two E-cadherin siRNAs, separately (E-cadh-1, E-cadh-2) or pooled (E-cadh-1/2). Cells were starved (−) for 24 h and then stimulated with EGF 20 ng/ml (+) for 15 or 30 min (OAW42 and OVCAR 5, respectively). β-actin was used as control for gel loading. Right panel: quantitative evaluation of E-cadherin, EGFR and P-EGFR on E-cadherin silenced cells. The graph reports the ratio between the target protein and β-actin from three different experiments performed on both OAW42 and OVCAR5 cells. b Left panel: western blotting on lysates from MCAs from HG-SOC patient #21 transiently transfected with a control (−) or a pool (+) of E-cadherin siRNAs (E-cadh-1/2). Cells were starved for 24 h and then stimulated with EGF 20 ng/ml overnight (+). Right panel: quantitative evaluation performed as Fig. 1a panel right. c Cell cycle analysis performed on OAW42 cells transiently transfected with a control (Control siRNA) or a pool of E-cadherin siRNAs (E-cadherin siRNA), starved 24 h and then stimulated with EGF 20 ng/ml for 48 h. Western blotting with anti-E-cadherin Ab to evaluate E-cadherin silencing on these experiments are reported in Additional file 2: Figure S2d. d Upper panel: confocal IF on fixed OAW42 cells performed with anti-E-cadherin (cadh, green) and -EGFR (red) Abs. Lower panel: Representative staining with anti-E-cadherin (cadh, green) and anti-EGFR (red) Abs on MCAs from HG-SOC patient #4. Enlarged detail in box is shown in the upper right side of the merge image. Bars, 10 μm. e Upper panel: IP performed with anti-EGFR or -E-cadherin (cadh) Abs on lysates from OAW42 cells. IPs were performed upon transient transfection of non silencing RNA or siRNA for E-cadherin or EGFR followed by IP with anti-EGFR or –E-cadherin, respectively, to test Abs specificity. Upon knockdown of the relevant protein, the complex E-cadherin/EGFR was not formed. Input, total cell lysates; Unbound, protein fraction not immunoprecipitated. Lower panel: IP performed with anti-EGFR Ab on lysates from 3D OVCAR5 and SKOV3 cells. Immunoprecipitated samples were analyzed by western blotting together with the unbound fraction. Immunoblottings were performed with Abs against the proteins reported on the left
Fig. 3
Fig. 3
EGFR/CDK5 signaling is activated in E-cadherin-expressing cells and can be inhibited by roscovitine. a Proliferation assay performed on control (CO) or E-cadherin silenced OAW42 cells (E-cadh-1/2) grown in the presence of EGF and treated with roscovitine alone (20 μM), or gefitinib (10 μM) or with both drugs. Asterisks indicate statistically significant values by Student’s t test. A representative experiment is shown of three performed. b Western blotting on total cell lysates from OAW42 and OVCAR5 cells transiently transfected with control (−) or a pool (+) of E-cadherin siRNAs (siE-cadh-1/2), starved and then stimulated with EGF 20 ng/ml and treated with roscovitine. Immunoblottings were performed with Abs against the proteins reported on the left. β-actin was used as control of gel loading. c Upper panel: western blotting on total cell lysates from OVCAR5, OAW42, SKOV3 and NL3507 cells. Immunoblottings were performed with Abs against the proteins reported on the left. β-actin was used as control of gel loading. Lower panel: cell viability assay on OVCAR5, OAW42, SKOV3 and NL3507 cells treated with roscovitine (2, 5, 10, 20, 40 μM) up to 96 h. Each point represents the mean of three replicates. Error bars, SD
Fig. 4
Fig. 4
Cisplatin susceptibility in E-cadherin-expressing EOC cells is enhanced by combination with CDK5 inhibitor. a Dose-response curves of OAW42 and OVCAR5 cells treated with increasing concentration of roscovitine or cisplatin or alone (0.625, 1.25, 2.5, 5, 10, 20 μM) or in combination with 10 μM (the dose below the IC50 in these cells) roscovitine up to 96 h. The red line shows the dose-response curve to roscovitine alone. b Dose-response curves of OAW42, OVCAR5 and SKOV3 cells grown as MCA in Algimatrix™ treated treated as above. Cell viability was measured by CellTiter-Glo® Luminescent Cell viability assay. Tables below each panel: drug interaction analysis evaluated by the Chou and Talalay method. Effect and combination index are reported in the lower right panel A; color-coded fraction represents the effect values (E) and the combination index (CI) at the indicated drug combination doses
Fig. 5
Fig. 5
Impact of PLEKHA7 on E-cadherin-mediated EGFR signaling activation. a IP performed with anti-EGFR Ab on lysates from OAW42 cells transiently transfected with an empty LZRS (−) or with a LZRS- PLEKHA7 vector (+). Normal rabbit (IgG) serum was used as negative control. Immunoprecipitated samples were analyzed by western blotting with Abs against the proteins reported on the left. The inset above indicates the Myc-tag overexpression corresponding to PLEKHA7 expression. b Left panel: western blotting on total cell lysates from starved empty LZRS vector (−) or LZRS-PLEKHA7 infected OAW42 cells (+) starved and then stimulated with EGF 20 ng/ml for 30 min. Right panel: graph reporting the amount of P-EGFR anf EGFR in EGF stimulated cells evaluated in three different immunoblottings. c Proliferation assay of empty LZRS vector or PLEKHA7 infected OAW42 cells. Asterisks indicate statistically significant values evaluated with one-way Anova. d Left: representative phase contrast images of infected OAW42 cells grown in soft agar for 10 days. Three replicates for each condition were done. Right panel: graph reporting the number of clones/well. Asterisk indicates significant values (p˂0.05). e Left panel: IP with anti-PLEKHA7 Ab on lysates from LZRS vector (−) or LZRS-PLEKHA7 (+) OAW42 cells. Immunoblottings were performed with Abs against the proteins reported on the left. Right panel: quantitative analysis of E-cadherin immunoprecipitated with PLEKHA7 Ab or present in the unbound fraction evaluated in three different experiments as the ratio between the immunoprecipitated (IP) or not immunoprecipitated (Unbound) and the total input. Asterisks indicate significant values (p˂0.001). f Confocal IF performed on infected OAW42 cells immunostained with E-cadherin (E-cadh) together with PLEKHA7, or -β-catenin (cat) Abs. The panel reports the 0.5 μm stacks acquired from the bottom to the top of the cells. Merge images are shown. Bar, 20 μm for xy images; bar, 3 μm for xz images
Fig. 6
Fig. 6
Clinical impact of PLEKHA7 in EOC patients. a Western blotting on total cell lysates from MCAs present in ascites from HG-SOC patients (n = 13). Caco2 lysates were used as positive control of PLEKHA7 expression. Claudin-4 was included as epithelial marker. Immunoblottings were performed with Abs against the proteins reported on the left. β-actin was used as control of gel loading. b Representative IF performed on a fixed sample of HG-SOC MCAs (sample #11) with anti-E-cadherin (cadh) and anti-PLEKHA7 Abs. c Representative images of the IHC performed with anti-PLEKHA7 Ab on HG-SOCs. The reaction on the fallopian tube epithelium (FT) was considered as a positive control. The empty black box in the left panel highlights the image reported in the right panel at higher magnification. d Meta-analysis, as described in Methods section, for evaluation of PLEKHA7 expression intensity in OSE and EOCs of different histotypes. Asterisks indicate statistically significant values by Student’s t test (p ˂ 0.001). e Kaplan-Meyer curves reporting the PFS and OS analyses on patient selected for PLEKHA7 expression

Similar articles

Cited by

References

    1. Takeichi M. Dynamic contacts: rearranging adherens junctions to drive epithelial remodelling. Nat Rev Mol Cell Biol. 2014;15:397–410. doi: 10.1038/nrm3802. - DOI - PubMed
    1. Ye X, Weinberg RA. Epithelial-Mesenchymal plasticity: a central regulator of Cancer progression. Trends Cell Biol. 2015;25:675–686. doi: 10.1016/j.tcb.2015.07.012. - DOI - PMC - PubMed
    1. Tomassetti A, De Santis G, Castellano G, Miotti S, Mazzi M, Tomasoni D, et al. Variant HNF1 modulates epithelial plasticity of normal and transformed ovary cells. Neoplasia. 2008;10:1481–1492. doi: 10.1593/neo.81004. - DOI - PMC - PubMed
    1. De Santis G, Miotti S, Mazzi M, Canevari S, Tomassetti A. E-cadherin directly contributes to PI3K/AKT activation by engaging the PI3K-p85 regulatory subunit to adherens junctions of ovarian carcinoma cells. Oncogene. 2009;28:1206–1217. doi: 10.1038/onc.2008.470. - DOI - PubMed
    1. Rodriguez FJ, Lewis-Tuffin LJ, Anastasiadis PZ. E-cadherin's dark side: possible role in tumor progression. Biochim Biophys Acta. 2012;1826:23–31. - PMC - PubMed