

Long noncoding RNA expression profile and association with SLEDAI score in monocyte-derived dendritic cells from patients with systematic lupus erythematosus
- PMID: 29996948
- PMCID: PMC6042324
- DOI: 10.1186/s13075-018-1640-x
Long noncoding RNA expression profile and association with SLEDAI score in monocyte-derived dendritic cells from patients with systematic lupus erythematosus
Abstract
Background: Monocyte-derived dendritic cells (moDCs) play important roles in the pathogenesis of systemic lupus erythematosus (SLE). Aberrant expression of long noncoding RNAs (lncRNAs) could affect the function of moDCs. The aim of this study was to explore the lncRNA expression profile in moDCs of SLE patients to provide new insights into SLE.
Methods: LncRNA and mRNA microarrays were performed to identify differentially expressed lncRNAs and mRNAs in moDCs of SLE patients compared with normal controls. Bioinformatics analysis was also performed. Quantitative polymerase chain reaction (qPCR) was used to validate the results, and correlation analysis was used to analyze the relationship between these aberrantly expressed lncRNAs and SLE disease activity index (SLEDAI) scores.
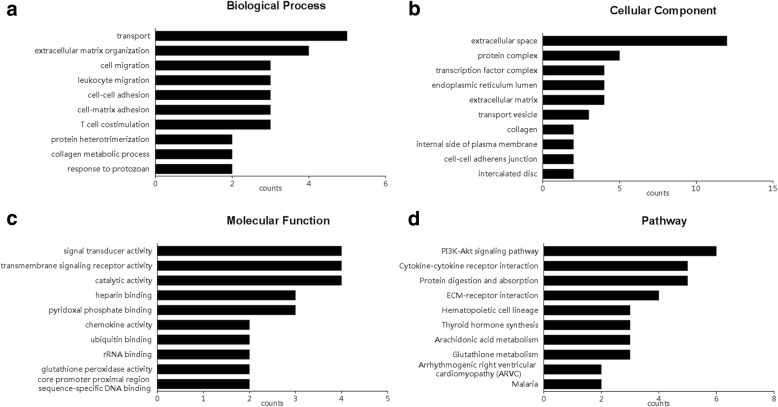
Results: According to the gene expression profiles, 163 lncRNAs were differentially expressed between SLE and normal controls, including 118 that were upregulated and 45 that were downregulated. A total of 137 mRNAs were differentially expressed in moDCs of patients with SLE, including 83 that were upregulated and 54 that were downregulated. Furthermore, qPCR data showed that lncRNA ENST00000604411.1 (18.23-fold, P < 0.001) and ENST00000501122.2 (1.96-fold, P < 0.001) were upregulated and the other two lncRNAs, lnc-HSFY2-3:3 (0.42-fold, P < 0.001) and lnc-SERPINB9-1:2 (0.50-fold, P = 0.040), were downregulated in moDCs of SLE patients. The expression levels of ENST00000604411.1 (r = 0.593, P = 0.020) and ENST00000501122.2 (r = 0.539, P = 0.038) were positively correlated with the SLEDAI score, respectively.
Conclusions: The results indicate that the abnormal expression of lncRNAs in moDCs may be involved in the pathological processes of SLE. The expression level of ENST00000604411.1 and ENST00000501122.2 may have potential value for the assessment of disease activity in SLE.
Keywords: Expression profile; Long noncoding RNA; Monocyte-derived dendritic cells; Systematic lupus erythematosus.
Conflict of interest statement
Ethics approval and consent to participate
The study was approved by the Independent Ethics Committee of Huashan Hospital and written informed consent was obtained from all subjects.
Consent for publication
Written informed consents were obtained from the patients for publication of their individual details and accompanying images in this manuscript. The consent form is held by the authors and is available for review by the Editor-in-Chief.
Competing interests
The authors declare that they have no competing interests.
Publisher’s Note
Springer Nature remains neutral with regard to jurisdictional claims in published maps and institutional affiliations.
Figures


Similar articles
-
Exploring the Role of Non-Coding RNAs in the Pathophysiology of Systemic Lupus Erythematosus.Biomolecules. 2020 Jun 22;10(6):937. doi: 10.3390/biom10060937. Biomolecules. 2020. PMID: 32580306 Free PMC article. Review.
-
Full high-throughput sequencing analysis of differences in expression profiles of long noncoding RNAs and their mechanisms of action in systemic lupus erythematosus.Arthritis Res Ther. 2019 Mar 5;21(1):70. doi: 10.1186/s13075-019-1853-7. Arthritis Res Ther. 2019. PMID: 30836987 Free PMC article.
-
Expression profile of long noncoding RNAs in children with systemic lupus erythematosus: a microarray analysis.Clin Exp Rheumatol. 2019 Jan-Feb;37(1):156-163. Epub 2018 May 24. Clin Exp Rheumatol. 2019. PMID: 29846163
-
A novel long noncoding RNA ENST00000597482 serves as a potential biomarker for disease activity and diagnosis of systemic lupus erythematosus.Lupus. 2024 Sep;33(10):1089-1099. doi: 10.1177/09612033241266988. Epub 2024 Jul 22. Lupus. 2024. PMID: 39037598
-
LncRNA Expression Profiles in Systemic Lupus Erythematosus and Rheumatoid Arthritis: Emerging Biomarkers and Therapeutic Targets.Front Immunol. 2021 Dec 23;12:792884. doi: 10.3389/fimmu.2021.792884. eCollection 2021. Front Immunol. 2021. PMID: 35003113 Free PMC article. Review.
Cited by
-
Long Noncoding RNAs and Circular RNAs in Autoimmune Diseases.Biomolecules. 2020 Jul 14;10(7):1044. doi: 10.3390/biom10071044. Biomolecules. 2020. PMID: 32674342 Free PMC article. Review.
-
An update on epigenetic regulation in autoimmune diseases.J Transl Autoimmun. 2022 Dec 9;5:100176. doi: 10.1016/j.jtauto.2022.100176. eCollection 2022. J Transl Autoimmun. 2022. PMID: 36544624 Free PMC article.
-
Expression of lncRNA NEAT1 in peripheral blood mononuclear cells of patients with systemic lupus erythematosus and its correlation with Th1/Th2 balance.Int J Clin Exp Pathol. 2021 May 15;14(5):646-652. eCollection 2021. Int J Clin Exp Pathol. 2021. PMID: 34093950 Free PMC article.
-
Exploring the Role of Non-Coding RNAs in the Pathophysiology of Systemic Lupus Erythematosus.Biomolecules. 2020 Jun 22;10(6):937. doi: 10.3390/biom10060937. Biomolecules. 2020. PMID: 32580306 Free PMC article. Review.
-
Epigenetics in Non-tumor Immune-Mediated Skin Diseases.Mol Diagn Ther. 2021 Mar;25(2):137-161. doi: 10.1007/s40291-020-00507-1. Epub 2021 Mar 1. Mol Diagn Ther. 2021. PMID: 33646564 Review.
References
Publication types
MeSH terms
Substances
LinkOut - more resources
Full Text Sources
Other Literature Sources
Medical
Molecular Biology Databases
