. 2018 Aug 6;215(8):2115-2136.
doi: 10.1084/jem.20171312. Epub 2018 Jul 11.

miR-196b target screen reveals mechanisms maintaining leukemia stemness with therapeutic potential

Affiliations
Free PMC article

miR-196b target screen reveals mechanisms maintaining leukemia stemness with therapeutic potential

Sara E Meyer et al. J Exp Med. .
Free PMC article

Abstract

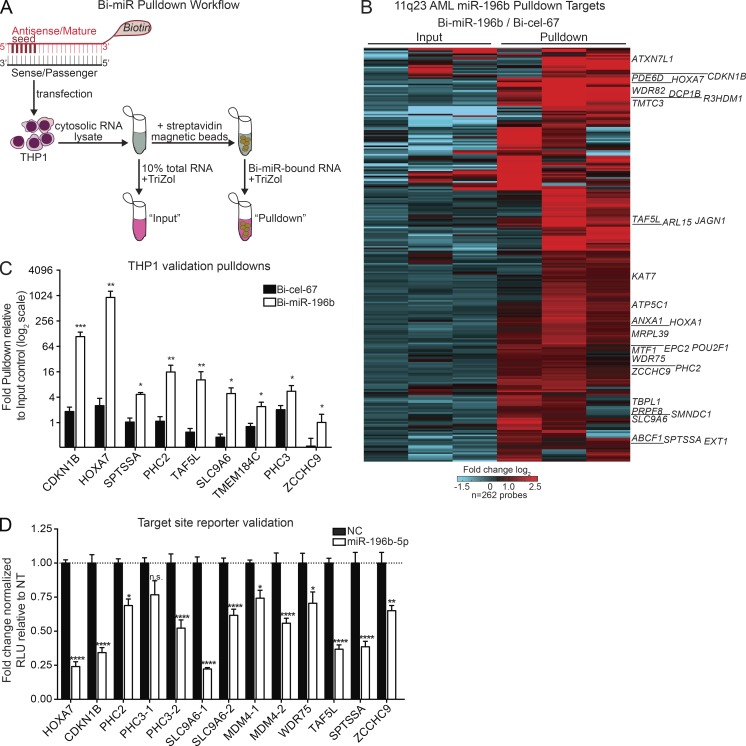
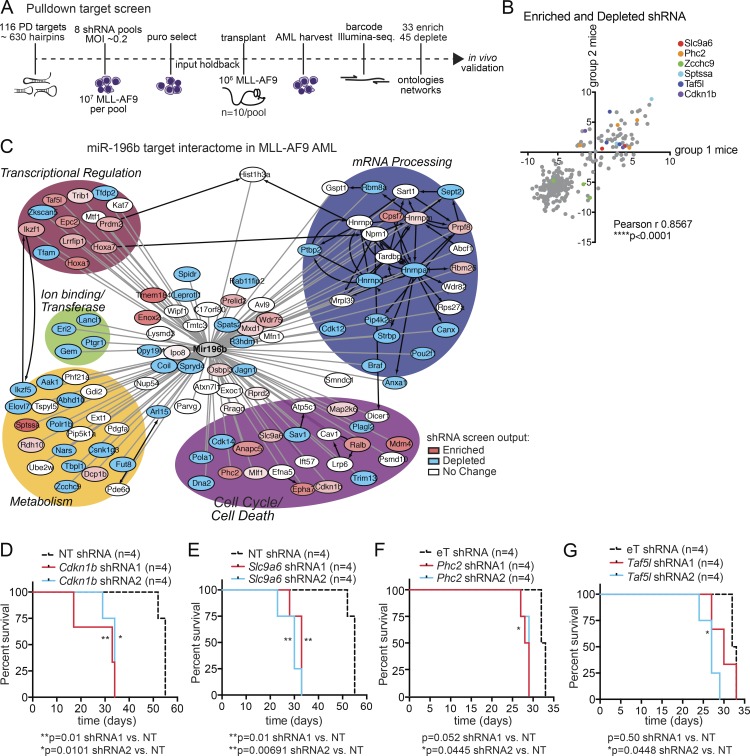
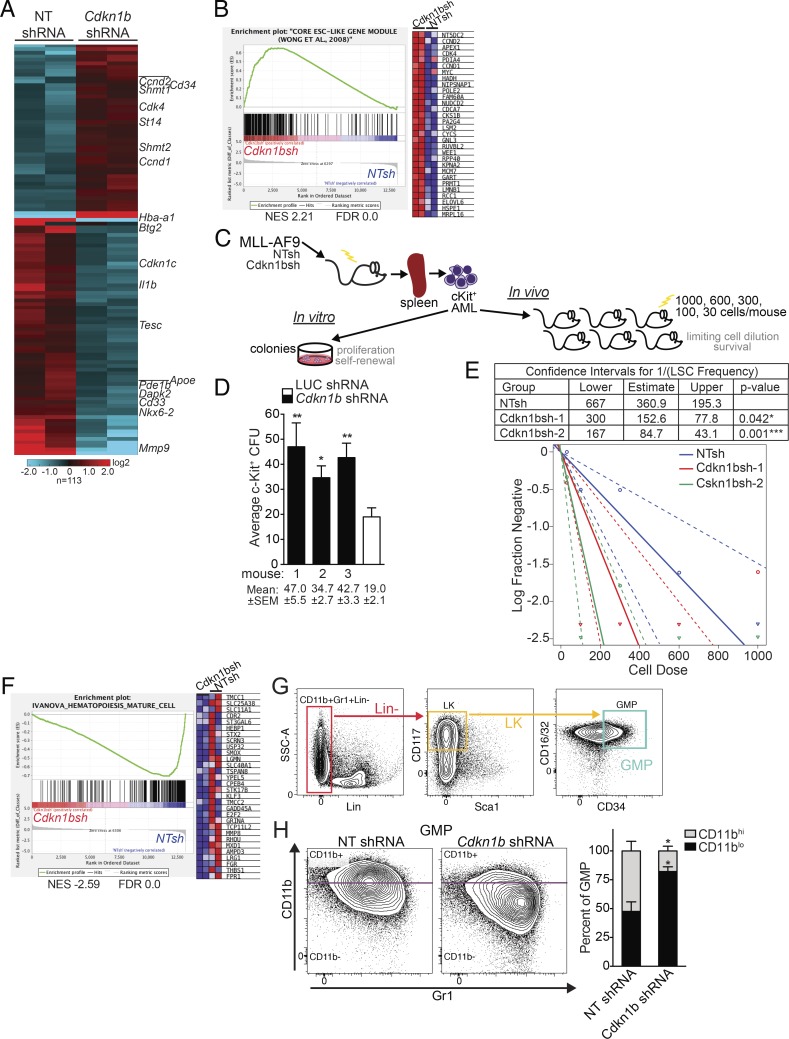
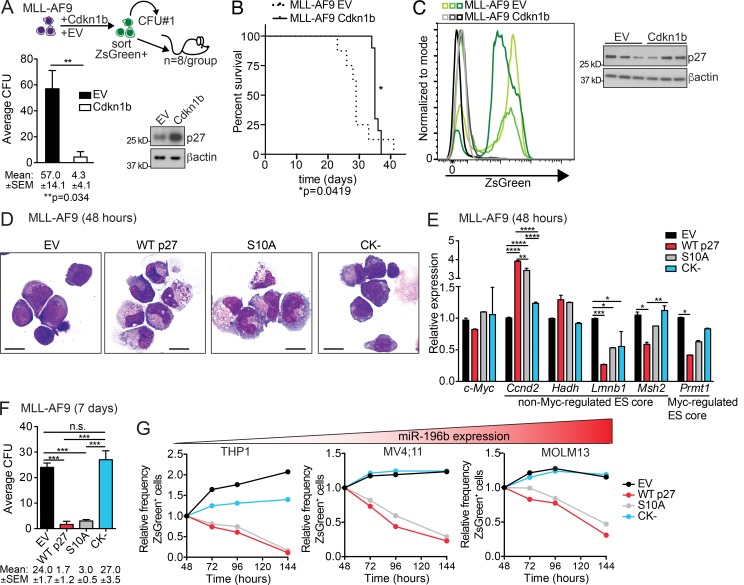
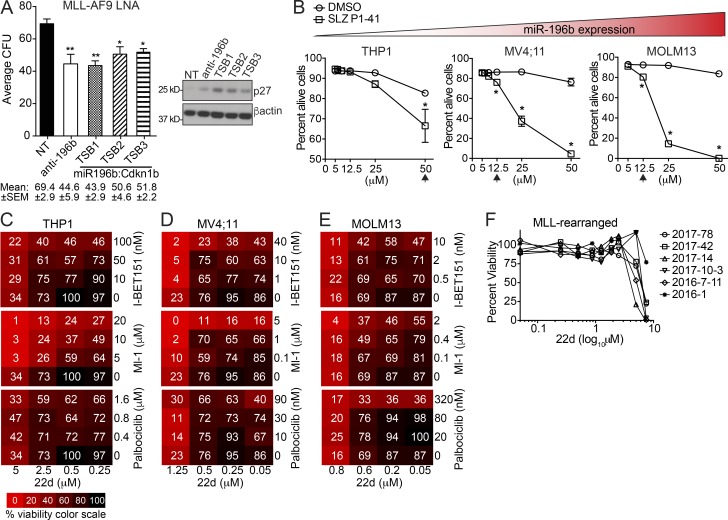
We have shown that antagomiR inhibition of miRNA miR-21 and miR-196b activity is sufficient to ablate MLL-AF9 leukemia stem cells (LSC) in vivo. Here, we used an shRNA screening approach to mimic miRNA activity on experimentally verified miR-196b targets to identify functionally important and therapeutically relevant pathways downstream of oncogenic miRNA in MLL-r AML. We found Cdkn1b (p27Kip1) is a direct miR-196b target whose repression enhanced an embryonic stem cell-like signature associated with decreased leukemia latency and increased numbers of leukemia stem cells in vivo. Conversely, elevation of p27Kip1 significantly reduced MLL-r leukemia self-renewal, promoted monocytic differentiation of leukemic blasts, and induced cell death. Antagonism of miR-196b activity or pharmacologic inhibition of the Cks1-Skp2-containing SCF E3-ubiquitin ligase complex increased p27Kip1 and inhibited human AML growth. This work illustrates that understanding oncogenic miRNA target pathways can identify actionable targets in leukemia.


Figures

Figure 1.
Figure 1.
Unbiased identification of direct miR-196b targets in human 11q23 AML. (A) Schematic of biotinylated miRNA-mimic (Bi-miR) pulldown approach. (B) Heat map of putative miR-196b target gene pulldowns enrichments from three independent pulldowns in 11q23 mutant THP1 AML cells. Displayed genes were enriched at least twofold in Bi-miR-196b pulldowns relative to matched Bi-cel-67 pulldowns in two of three experiments. The corresponding fold change Bi-miR-196b versus Bi-cel-67 inputs are shown for each gene. (C) Independent RT-qPCR validation of miR target mRNA pulldown. The average fold pulldown (± SEM) relative to matched input controls for each Bi-cel-67 control (black bars) and Bi-miR-196b mimic (white bars) in at least three independent experiments in THP1 cells. Statistical significance by paired t tests for each gene versus Bi-cel-67 control. (D) Functional miR target validation. Average fold change ± SEM repression by miR-196b (miR-196b-5p) relative to negative control (NC) of indicated miR-196b binding sites in three independent Luciferase reporter assay experiments. Multiple binding sites in the same gene are distinguished by “1” and “2”. Statistical significance was determined using a two-way ANOVA versus NC. *, P ≤ 0.05; **, P ≤ 0.01; ***, P ≤ 0.001; ****, P ≤ 0.0001. n.s., not significant.
Figure 2.
Figure 2.
An in vivo shRNA screen functionally dissects miR-196b networks in MLL-AF9 leukemogenesis. (A) Schematic overview. In vivo shRNA-positive selection screen of miR-196b-pulldown targets in primary MLL-AF9 leukemia. Leukemic splenocytes were transduced with eight different lentiviral shRNA pools against 116 miR-196b target genes and transplanted into recipient mice (n = 10 mice/pool). Sequencing of pretransplant pools (input) versus leukemic splenocytes (from moribund mice) identified 33 enriched and 45 deleted genes of at least two hairpins/gene over input control. (B) Replicate assay correlation. For each enriched and depleted hairpin, recipient mice were divided into two groups/pool (n = 4–5 mice/group/pool) and plotted. The relatedness between these two groups of mice was evaluated by Pearson correlation demonstrating that in vivo selection of hairpin activity is not stochastic (r = 0.8567). Examples of genes with enriched (Scl9a6, Phc2, Sptssa, Taf5l, and Cdkn1b) or depleted (Zcchc9) shRNA are color coded. (C) Network analysis of screen targets by gene ontology biological processes. RNAi screen enriched gene nodes (red), depleted gene nodes (blue), and unchanged gene nodes (white). Protein–protein interactions are denoted by black edges and putative miR-196b target transcript interactions experimentally identified in miR target pulldown assays are denoted by gray edges. (D–G) In vivo validation of positive selection of individual targets. Kaplan-Meier survival curves of mice transplanted with MLL-AF9 leukemia expressing individual shRNA hairpins against the indicated genes (n = 4 mice/group; 2 hairpins/gene). Non-targeting (NT) or EV (eT) were used as controls. miR-196b pulldown targets Cdkn1b (D), Slc9a6 (E), Phc2 (F), and Taf5l (G) accelerated leukemia lethality. Significant p-values are reported by Log-rank (Mantel-Cox) test for each hairpin compared with control. *, P ≤ 0.05; **, P ≤ 0.01; ****, P < 0.0001.
Figure 3.
Figure 3.
miR-196b targets Cdkn1b to regulate leukemia stemness and differentiation programs in MLL-AF9 leukemia. (A) Heatmap of gene expression in Cdkn1b shRNA-knockdown and NT-shRNA control leukemias. Hierarchical clustering of 113 differentially expressed genes showing greater than twofold change in expression by RNA-seq analysis of NT-shRNA control (n = 2) or Cdkn1b shRNA (n = 2) expressing MLL-AF9 leukemic splenocytes. (B) GSEA plot ranking ESC core gene set along descending fold change gene expression in Cdkn1b-knockdown (n = 2) versus NT control leukemias (n = 2) by RNA-seq. Expression of the top subset of leading edge genes is shown. NES, normalized enrichment score. (C) Schematic illustrating in vitro colony forming assay and in vivo limiting cell dilution transplantation assay to quantify functional stem cells from freshly isolated Cdkn1b shRNA and NT control MLL-AF9 leukemias. (D) In vitro leukemic stem cell analysis. Average CFU ± SEM from c-Kit+ leukemic splenocytes from individual Cdkn1b shRNA (n = 3) or control shRNA MLL-AF9 moribund mice. Mean numbers of CFU ± SEM indicated below. A representative experiment is shown. Statistical significance evaluated by t test. *, P ≤ 0.05; **, P ≤ 0.01. (E) In vivo quantitation of leukemic stem cells by limiting dilution. Sublethally irradiated mice transplanted with a cell dose range of 1,000, 600, 300, 100, and 30 cells (n = 6 mice/dose) were followed for 90 d. LSC frequencies and statistical comparisons for pairwise differences in active cell frequencies (table and log-fraction plot) between Cdkn1b-knockdown groups and NT control group were calculated by ELDA software (see Fig. S3 [E–G] for corresponding survival curves). Statistically significant differences in LSC frequencies of NTsh control (1/360.9) versus Cdkn1bsh1 (1/152.6); *, P = 0.042 and NTsh control (1/360.9) versus Cdkn1bsh2 (1/84.7) ***, P = 0.001. (F) GSEA plot ranking mature hematopoietic cells gene set along descending fold change gene expression in Cdkn1b-knockdown versus NT control leukemias by RNA-seq (n = 2/group). Expression of the top subset of leading edge genes is shown. (G) Leukemic GMP gating strategy: CD11b+Gr1+ lineage negative (Lin, red), Linc-Kit+ (LK, orange), and LK CD34+CD16/32+ granulocyte monocyte progenitor gate (GMP, green). (H) Flow cytometric validation of differentiation status. Representative flow plots (left) and average percentage of CD11bhi and CD11blo leukemic GMP-gate populations ± SEM (right) from spleens of moribund Cdkn1b shRNA or control NT shRNA MLL-AF9 mice (n = 3/group). *, P < 0.05 for CD11bhi and CD11blo GMP in Cdkn1b shRNA versus NT shRNA by two-way ANOVA.
Figure 4.
Figure 4.
Cdkn1b/p27Kip1 suppresses MLL-r leukemia in a cyclin–CDK-dependent manner. (A) Top, schematic of CFU and transplantation of ZsGreen+ sorted Cdkn1b-ZsGreen (Cdkn1b) or EV-ZsGreen (EV) control expressing MLL-AF9 leukemia cells. Bottom, average number of colonies ± SEM (n = 3 replicates/group). Mean CFU numbers ± SEM indicated below bar graph. **, P ≤ 0.01 by t test. Immunoblot analyses of p27 performed on cells from CFU assays with β-actin as loading control. A representative of two independent experiments is shown with similar results. (B) Kaplan-Meier survival curve of mice transplanted with ZsGreen+ Cdkn1b overexpressing MLL-AF9 cells (n = 6/group). Significant differences in survival evaluated by Log-rank (Mantel-Cox) test; *, P ≤ 0.05. (C) Counter selection of p27 overexpression in vivo. Flow cytometric analyses for ZsGreen+ expression in EV (green lines) and Cdkn1b-overexpressing (black lines) MLL-AF9 leukemic splenocytes from moribund mice. Three representative mice/group are shown. Immunoblot analysis of p27 with β-actin as loading control (n = 3 mice/group). (D–F) Functional dissection of p27 activity. WT p27Kip1 (WT p27), nuclear localized p27Kip1 (S10A; increased cell cycle inhibition), or CDK-binding domain mutant p27Kip1 (CK; no cell cycle inhibition) were expressed via lentiviral vectors in murine MLL-AF9 leukemic splenocytes. EV vector served as control. Cells were FACS sorted for ZsGreen+ 48 h after transduction and prepared for cytospin (D), RNA (E), or plated in CFU assay (F). Representatives of two independent experiments with similar results is shown. (D) Cytologies of ZsGreen+ EV, WT p27, S10A, and CK expressing MLL-AF9 cells were visualized with Wright Giemsa stain and imaged at 60× magnification. Bars, 10 µm. (E) RNA extracted from ZsGreen+ EV, WT p27, S10A, and CK MLL-AF9 cells was examined by RT-qPCR for changes in c-Myc expression as well as representative non–Myc-regulated (Ccnd2, Hadh, Lmnb1, and Msh2) and ESC core genes (Prmt1; n = 2 replicates/group; from Fig. S3, K and L). Expression was compared with Sdha as loading control and is graphed as average relative to EV ± SEM. Statistical significance was evaluated for each gene by two-way ANOVA Holm-Sidak multiple comparisons test. (F) Equal numbers of ZsGreen+ EV, WT p27, S10A, and CK expressing MLL-AF9 leukemic splenocytes were plated in triplicate in methylcellulose. The average number colonies ± SEM enumerated after 7 d in methylcellulose is shown for three technical replicates with mean CFU ± SEM indicated below. A representative of two independent experiments is shown. Statistical significance was evaluated by one-way ANOVA Holm-Sidak multiple comparisons test. *, P ≤ 0.05; **, P ≤ 0.01; ***, P ≤ 0.001; ****, P ≤ 0.0001. n.s., not significant. (G) Human AML cell lines are organized according to their levels of miR-196b expression (lowest to highest, red gradient triangle; see also Fig. S4 B). The relative frequency of ZsGreen+ EV, WT p27, S10A, or CK transduced THP1, MV4;11, and MOLM13 cells measured over time are shown as relative to the proportion of ZsGreen+ cells at the initial time point 48 h post-transduction. A representative experiment is shown.
Figure 5.
Figure 5.
RNAi disruption of miR-196b activity or pharmacologic inhibition of SCFSKP2 elevate p27Kip1 and inhibit human AML growth. (A) MLL-AF9 leukemic splenocytes were treated with indicated LNA and plated in triplicate for CFU assays. The sequences of the LNAs coded for a scramble nontargeting control (NT), homologous sequence to miR-196b-5p (anti-196b), or three variant target site–blocking (TSB1-3) LNAs designed with sequence homology to the Cdkn1b 3′UTR miR-196b target binding site (miR196b:Cdkn1b). CFU results are shown as the average number of colonies ± SEM for each LNA in two independent experiments (left), with mean CFU ± SEM indicated below. Statistical significance was evaluated by t test for anti-196b and TSB LNAs compared with NT control. Immunoblots for p27 (right) were performed on LNA-treated CFU to detect target engagement with β-actin as loading control. (B) Average ± SEM percentage of alive (AnnexinVPI) THP1, MV4;11, and MOLM13 human AML cells treated for 3 d in duplicate with the indicated amounts (μM) of SLZ P1-41 (squares) or equivalent volume of DMSO control (circles). Statistical significance was evaluated for each cell line by multiple unpaired t tests Holm-Sidak multiple testing correction. *, P ≤ 0.05; **, P < 0.01. Relative miR-196b expression indicated by triangular color scale (see also Fig. S4 B). (C–E) Cell viability heat maps of THP1 (C), MV4;11 (D), and MOLM13 (E) cells treated for 3 d with single drugs or combinations of 22d, IBET-151, Ml-1, or Palbociclib. Color scale is denoted in C. A representative of at least two experiments with similar results is shown for each. See Table S3 for analyses of drug synergies. (F) Primary human MLL-r AML patient samples (n = 6) were treated with increasing concentrations of 22d. Cell viability was measured by MTS for all doses after 3-d 22d treatment.

References

    1. Agarwal V., Bell G.W., Nam J.W., and Bartel D.P.. 2015. Predicting effective microRNA target sites in mammalian mRNAs. eLife. 4:e05005 10.7554/eLife.05005 - DOI - PMC - PubMed
    1. Armstrong S.A., Staunton J.E., Silverman L.B., Pieters R., den Boer M.L., Minden M.D., Sallan S.E., Lander E.S., Golub T.R., and Korsmeyer S.J.. 2002. MLL translocations specify a distinct gene expression profile that distinguishes a unique leukemia. Nat. Genet. 30:41–47. 10.1038/ng765 - DOI - PubMed
    1. Ayton P.M., and Cleary M.L.. 2003. Transformation of myeloid progenitors by MLL oncoproteins is dependent on Hoxa7 and Hoxa9. Genes Dev. 17:2298–2307. 10.1101/gad.1111603 - DOI - PMC - PubMed
    1. Besson A., Gurian-West M., Chen X., Kelly-Spratt K.S., Kemp C.J., and Roberts J.M.. 2006. A pathway in quiescent cells that controls p27Kip1 stability, subcellular localization, and tumor suppression. Genes Dev. 20:47–64. 10.1101/gad.1384406 - DOI - PMC - PubMed
    1. Betel D., Wilson M., Gabow A., Marks D.S., and Sander C.. 2008. The microRNA.org resource: targets and expression. Nucleic Acids Res. 36(Database):D149–D153. 10.1093/nar/gkm995 - DOI - PMC - PubMed

Publication types

MeSH terms